
ABSTRACT
Purpose: Liver metastasis develops in >50% of patients with colorectal cancer (CRC), and is a leading cause of CRC-related mortality. We aimed to identify which inhibitory immune checkpoint pathways can be targeted to enhance functionality of intra-tumoral T-cells in mismatch repair-proficient liver metastases of colorectal cancer (LM-CRC).
Methodology: Intra-tumoral expression of multiple inhibitory molecules was compared among mismatch repair-proficient LM-CRC, peritoneal metastases of colorectal cancer (PM-CRC) and primary CRC. Expression of inhibitory molecules was also analyzed on leukocytes isolated from paired resected metastatic liver tumors, tumor-free liver tissues, and blood of patients with mismatch repair-proficient LM-CRC. The effects of blocking inhibitory pathways on tumor-infiltrating T-cell responses were studied in ex vivo functional assays.
Results: Mismatch repair-proficient LM-CRC showed higher expression of inhibitory receptors on intra-tumoral T-cells and contained higher proportions of CD8+ T-cells, dendritic cells and monocytes than mismatch repair-proficient primary CRC and/or PM-CRC. Inhibitory receptors LAG3, PD-1, TIM3 and CTLA4 were higher expressed on CD8+ T-cells, CD4+ T-helper and/or regulatory T-cells in LM-CRC tumors compared with tumor-free liver and blood. Antibody blockade of LAG3 or PD-L1 increased proliferation and effector cytokine production of intra-tumoral T-cells isolated from LM-CRC in response to both polyclonal and autologous tumor-specific stimulations. Higher LAG3 expression on intra-tumoral CD8+ T-cells associated with longer progression-free survival of LM-CRC patients.
Conclusion: Mismatch repair-proficient LM-CRC may be more sensitive to immune checkpoint inhibitors than mismatch repair-proficient primary CRC. Blocking LAG3 enhances tumor-infiltrating T-cell responses of mismatch repair-proficient LM-CRC, and therefore may be a new promising immunotherapeutic target for LM-CRC.
Introduction
Colorectal cancer (CRC) is the third most common cause of cancer-related mortality worldwide.Citation1-Citation3 More than 50% of CRC patients develop metastatic disease to their liver over the course of their life,Citation4 and liver metastasis is a leading cause of death from CRC.Citation5-Citation7 Unfortunately, surgical resection of isolated liver metastases of CRC (LM-CRC) is curative in only 20%-30% of patients,Citation8,Citation9 and systemic therapy provides limited survival benefit.Citation10 Patients with unresectable LM-CRC have a poor prognosis with a median survival of only two years.Citation11 Therefore, there is a pressing need for more effective therapeutic strategies for LM-CRC.
The immune system plays a crucial role in cancer surveillance and elimination, and antibody blockade of inhibitory immune checkpoint pathways that suppress anti-tumor T-cell immunity and assist tumor immune evasion,Citation12-Citation16 has recently emerged as an attractive treatment option for multiple types of malignancies.Citation17-Citation21 Targeting the PD-1/PD-L1 inhibitory pathway has resulted in objective responses in 17%-28% of advanced melanoma patients, 12%-27% of renal cell cancer patients, 10%-18% of non-small cell lung cancer patients and 20% of advanced hepatocellular carcinoma patients.Citation22-Citation25 In contrast, CRC patients hardly respond to PD-1 and PD-L1 blocking antibodies,Citation23-Citation26 except for the minority of patients who are with mismatch repair (MMR)-deficient CRC.Citation27,Citation28 A defective MMR enzyme system occurs in 10%-20% of CRC tumors and results in microsatellite instability, which is used as a molecular marker of MMR-deficiency.Citation29 It has been hypothesized that the observed difference in responsiveness to PD-1/PD-L1 blockade between MMR-deficient and MMR-proficient CRC is related to the higher numbers of somatic mutations in MMR-deficient tumors, due to the reduced ability to repair DNA damage. The increased mutation rate may result in the presence of more mutation-encoded neo-antigens in the tumors, which elicit stronger anti-tumor T cell responses.Citation27 Indeed, MMR-deficient CRC tumors are characterized by denser CD8+ T cell infiltration.Citation30 They also have higher expression levels of inhibitory checkpoint molecules, probably to resist immune-mediated tumor elimination.Citation31 Together, enhanced immune cell infiltration and upregulation of inhibitory immune checkpoints may render MMR-deficient CRC more sensitive to PD-1/PD-L1 blockade than MMR-proficient CRC.
In LM-CRC the incidence of MMR deficiency is low,Citation32 and it may therefore be expected that LM-CRC poorly respond to immune checkpoint inhibitors. Nevertheless, these tumors contain immune infiltrates, and increased numbers of tumor-infiltrating CD8+ T cells are positively associated with overall survival and response to chemotherapy,Citation33,Citation34 indicating that intra-tumoral T cell immunity is an important determinant of LM-CRC progression. In addition, MMR-proficient LM-CRC are immunologically distinct from primary CRC in terms of immune infiltration.Citation35 Moreover, the unique immune environment in the liverCitation36 favors immunological tolerance,Citation36 and one of the mechanisms used by the liver to resist immune responses is the induction of expression of inhibitory receptors on hepatic T cellsCitation37,Citation38 and their ligands on hepatocytes and other liver tissue cells.Citation39 Previously we have observed that intra-tumoral CD8+ cytotoxic T cells (CTL) and CD4+ T helper cells (Th) are functionally compromised in LM-CRC,Citation40 and we also demonstrated that the suppression mediated by intra-tumoral regulatory T cells (Treg) in LM-CRC can be alleviated by blocking the inhibitory receptor CTLA4 and activating the stimulatory receptor GITR.Citation41 However, the expression and functional roles of inhibitory receptor-ligand pathways in regulating tumor-infiltrating effector T cell responses have not been studied yet in LM-CRC.
Therefore, the aim of this study was to determine whether inhibitory immune checkpoint pathways can be targeted to enhance the functionality of tumor-infiltrating lymphocytes (TIL) in MMR-proficient LM-CRC. We measured the expression of inhibitory receptors and their ligands on leukocytes isolated from paired resected metastatic liver tumors, tumor-free liver tissues (TFL) and blood of patients with LM-CRC, and compared their expression levels with those on leukocytes isolated from peritoneal metastasis of CRC (PM-CRC) and primary CRC. In addition, we studied the effects of antibody blockade of inhibitory pathways on TIL responses of LM-CRC in ex vivo functional assays.
Results
Comparison of immune infiltrates and expression of inhibitory molecules among MMR-proficient liver metastases, peritoneal metastases and primary CRC
To speculate whether TIL in CRC tumors at different anatomical sites may differ in sensitivity to checkpoint inhibitors, we first compared frequencies of T cell and antigen-presenting cell (APC) subsets, as well as their expression of inhibitory molecules, between MMR-proficient LM-CRC, primary CRC, and metastases outside the liver. Two in all LM-CRC tumors and three out of twelve primary CRC tumors that we collected were MMR-deficient, whereas all eleven PM-CRC tumors were MMR-proficient ( and Supplementary Table S1). The data of the five patients with MMR-deficient tumors are shown in Supplementary Fig. S1.
Table 1. Patient characteristics.
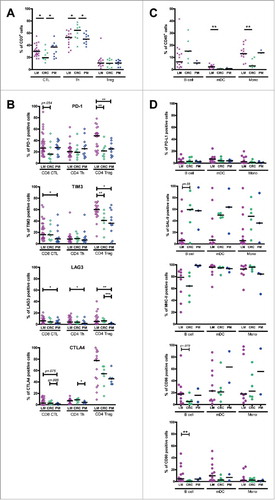
We observed several interesting differences among MMR-proficient tumors from different anatomical locations. Firstly, both LM-CRC and PM-CRC contained significantly higher frequencies of CD8+ CTL and significantly lower frequencies of CD4+Foxp3− Th than primary CRC, while frequencies of Treg were similar in CRC tumors at all three sites (). Secondly, CD8+ CTL in LM-CRC displayed a higher frequency of PD1+ cells than those in primary CRC, and also contained higher frequencies of TIM3+ and LAG3+ cells than those in PM-CRC, while CD4+ Th in LM-CRC displayed a higher frequency of LAG3+ cells than those in PM-CRC (). Thirdly, CD4+Foxp3+ Treg in LM-CRC contained higher frequencies of PD-1+ and TIM3+ cells than those in primary CRC and PM-CRC, and also displayed a higher frequency of LAG3+ cells than those in PM-CRC (). Finally, LM-CRC contained significantly higher frequencies of myeloid dendritic cells (mDC) and monocytes than primary CRC (), which not only can present tumor antigens to T cells but also express the inhibitory ligands PD-L1 (for PD-1), galectin 9 (for TIM3), MHC class II molecules (for LAG3), CD86 and CD80 (for CTLA4) (). Hierarchical clustering analysis showed that the immunological data of most LM-CRC patients clustered together as did the data of most primary CRC patients (Supplementary Fig. S2). Together, these data indicate that the CD8+ CTL:Treg ratio, which is critical for immunological tumor control in primary as well as metastasized CRC,Citation42 is more favorable in CRC metastases compared to primary CRC. In addition, the increased expression of PD-1 on TIL suggests that TIL of LM-CRC may be more sensitive to blockade of the PD-1/PD-L1 pathway than TIL of primary CRC.
Figure 1. Comparison of immune infiltrates and inhibitory molecule expression among MMR-proficient liver metastases (LM), peritoneal metastases (PM) and primary CRC. (A) The frequencies of CD8+ CTL, CD4+Foxp3− Th and CD4+Foxp3+ Treg within CD3+ TIL from LM-CRC, primary CRC and PM-CRC. (B) The frequencies of inhibitory receptor positive cells within CD8+ CTL, Th and Treg in LM-CRC, primary CRC and PM-CRC. (C) The frequencies of B cells, mDC and monocytes (Mono) within CD45+ cells from LM-CRC, primary CRC and PM-CRC. (D) The frequencies of inhibitory ligand positive cells within tumor-infiltrating B cells, mDC and monocytes from LM-CRC, primary CRC and PM-CRC. Values of individual patients are shown, and lines depict medians. Differences were analyzed by unpaired t test or Mann-Whitney test; *p < 0.05, **p < 0.01, ***p < 0.001.
Elevated expression of inhibitory receptors on CD8+ cytotoxic T cells, CD4+ T helper cells and regulatory T cells in MMR-proficient LM-CRC tumors
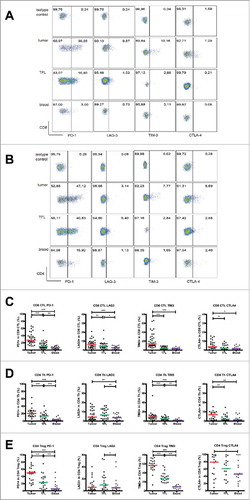
We isolated leukocytes from surgically resected metastatic liver tumors, TFL and blood of LM-CRC patients, and compared the expression levels of five inhibitory receptors (PD-1, TIM3, LAG3, CTLA4 and BTLA) on CD8+ CTL, CD4+Foxp3− Th and CD4+Foxp3+ Treg. When compared to TFL and blood, significantly higher proportions of CD8+ CTL, Th and Treg in TIL expressed PD-1 and TIM-3. In addition, TIL contained higher frequencies of CTLA4+ CTL and CTLA4+ Th, while LAG3 was overexpressed on CD8+ CTL in TIL when compared to TFL and blood (). Interestingly, the highest expression of CTLA4, which is functionally involved in the suppressive capacity of Treg,Citation43 and also of PD-1 and TIM3 was found on tumor-infiltrating Treg. In contrast, frequencies of BTLA+ cells in intra-tumoral T cells were low, and they did not differ significantly from those in TFL and blood (Supplementary Fig. S3). Therefore, we focused on the other four receptors in the rest of this study. To investigate whether the expression of inhibitory receptors on circulating T cells had a relation with the expression on intra-tumoral T cells, we performed correlation analysis, as illustrated in Supplementary Fig. S4. There were significant positive correlations between the frequencies of PD-1+ CTL and PD-1+ Treg in the tumor and those in the blood, between the frequency of LAG3+ Th in the tumor and that in the blood, and between the frequencies of CTLA4+ Th and CTLA4+ Treg in the tumor and those in the blood. These results indicate that the expression of inhibitory receptors on circulating T cells partly reflects their expression on intra-tumoral T cells.
Figure 2. Expression of inhibitory receptors on CD8+ CTL, CD4+ Th and CD4+ Treg in the tumor, TFL and blood of MMR-proficient LM-CRC. PBMC and leukocytes isolated from LM-CRC tumors and TFL were stained with antibodies against PD-1, LAG3, TIM3 and CTLA4. (A) (B) Representative dot plots of inhibitory receptor expression on (A) CD3+CD8+ CTL and (B) CD3+CD4+Foxp3− Th in the tumor, TFL and blood; the gates were made according to appropriate isotype controls. (C) (D) (E) The frequencies of inhibitory receptor positive cells within (C) CD8+ CTL, (D) CD4+Foxp3− Th and (E) CD4+Foxp3+ Treg in the tumor, TFL and blood. Values of individual patients are shown, and lines depict medians. Differences were analyzed by paired t test or Wilcoxon matched pairs test; *p < 0.05, **p < 0.01, ***p < 0.001.
Intra-tumoral antigen-presenting cells express inhibitory ligands
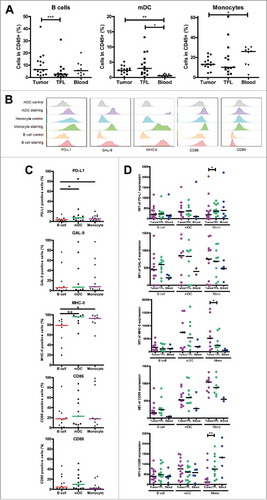
To study the expression of inhibitory ligands PD-L1, galectin 9, MHC-II molecules, CD86 and CD80 on APC in LM-CRC tissues, we measured these molecules by flow cytometry. Three major APC subsets BDCA-1+CD19− mDC, CD14+ monocytes and CD19+ B cells were found in all tumors. The frequency of B cells was higher in tumors than in TFL, and the frequency of mDC was higher in tumors and TFL than in the blood, whereas the frequency of monocytes was lower in tumors than in the blood (). The three different tumor-infiltrating APC populations expressed the five ligands at different levels and considerable variations between individual patients were observed (, C). Intra-tumoral mDC and monocytes contained higher proportions of PD-L1+ and MHC-II+ cells than intra-tumoral B cells. The median fluorescence intensities of five ligands in APC subsets in the tumor, TFL and blood are presented in , showing that the expression of inhibitory ligands is generally not increased on tumor-infiltrating APC compared to APC in TFL. Together, the abovementioned data suggest that inhibitory interactions between T cells and APC in MMR-proficient LM-CRC are possible.
Figure 3. Intra-tumoral antigen-presenting cells of MMR-proficient LM-CRC express inhibitory ligands. Expression of inhibitory ligands PD-L1, galectin 9 (GAL-9), MHC-II, CD86 and CD80 was measured by flow cytometry. (A) The frequencies of CD19+ B cells, BDCA1+CD19− mDC and CD14+ monocytes (Mono) within CD45+ cells derived from tumors, TFL and blood. Values of individual patients are presented, lines depict medians. (B) Representative histograms of inhibitory ligand stainings and isotype controls on tumor-infiltrating mDC, monocytes and B cells. (C) The frequencies of inhibitory ligand positive cells within tumor-infiltrating B cells, mDC and monocytes in individual patients are presented; lines depict medians. (D) The median fluorescence intensities (MFI) of inhibitory ligands on B cells, mDC and monocytes derived from tumors, TFL and blood of LM-CRC patients. Values of individual patients are shown, and lines depict medians. Differences were analyzed by paired t test or Wilcoxon matched pairs test; *p < 0.05, **p < 0.01, ***p < 0.001.
Intra-tumoral T cells expressing inhibitory receptors show increased levels of activation markers
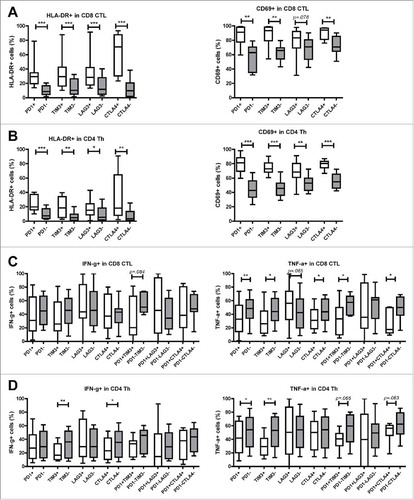
Considering that increased expression of inhibitory receptors on T cells can be induced by recent activation, or by chronic stimulation that may lead to T cell dysfunctionality, we examined the ex vivo activation status and in vitro effector cytokine production of effector T cells derived from MMR-proficient LM-CRC. First we compared the expression of activation markers HLA-DR and CD69 on intra-tumoral T cells that do or do not express inhibitory receptors. Interestingly, PD-1+, TIM3+, LAG3+ or CTLA4+ CTL and Th showed a more activated status than PD-1−, TIM3−, LAG3− or CTLA4− CTL and Th, respectively (, B). Subsequently, we assessed effector cytokine production of tumor-derived T cells after short-term PMA and ionomycin stimulation. Despite the activated status, the frequencies of inhibitory receptor positive CTL and Th cells that produced IFN-γ and TNF-α were reduced or similar to those in the respective receptor negative T cells (, D). Interestingly, LAG3+ CTL and Th cells did not show reduction in cytokine production. Because among all studied inhibitory receptors, tumor-infiltrating CTL and Th showed the highest expression of PD-1 (, D), we analyzed co-expression of PD-1 and the other three receptors. Co-expression of PD-1 and either TIM3, LAG3 or CTLA4 was found, especially in CD8+ CTL, but expression of TIM3, LAG3 or CTLA4 without PD-1 was also observed (Supplementary Fig. S5). Similar to single receptor positive CTL and Th, double receptor positive CTL and Th showed reduced or comparable frequencies of IFN-γ and TNF-α producing cells to double receptor negative cells, while LAG3+PD-1+ CTL and Th did not show significant reduction in cytokine production (, D). These data demonstrate that in general intra-tumoral T cells that express inhibitory receptors do not produce more effector cytokines, despite the activated status.
Figure 4. Tumor-infiltrating T cells expressing inhibitory receptors show increased expression of activation markers. TIL from MMR-proficient LM-CRC were stained ex vivo with antibodies against surface activation markers HLA-DR and CD69. (A) (B) The frequencies of HLA-DR+ or CD69+ cells in (A) CD8+ CTL and (B) CD4+ Th that do or do not express PD-1, TIM3, LAG3, or CTLA4 are presented (n = 9–11). Lines show medians, whiskers depict minimum to maximum. Differences were analyzed by paired t test or Wilcoxon matched pairs test. (C) (D) TIL from MMR-proficient LM-CRC were stimulated with PMA and ionomycin at 37°C for five hours, in the presence of protein transport inhibitor brefeldin for the last four hours, followed by intracellular cytokine staining. The frequencies of cytokine-producing cells in (C) CD8+ CTL and (D) CD4+ Th that do or do not express inhibitory receptors are presented (n = 7–12). Lines show medians, whiskers depict Min to Max, boxes indicate the 25th to 75th percentiles. Differences were analyzed by paired t test or Wilcoxon matched pairs test; *p < 0.05, **p < 0.01, ***p < 0.001.
Antibody blockade of LAG3 or PD-L1 boosts ex vivo proliferation and effector cytokine production of T cells derived from MMR-proficient LM-CRC
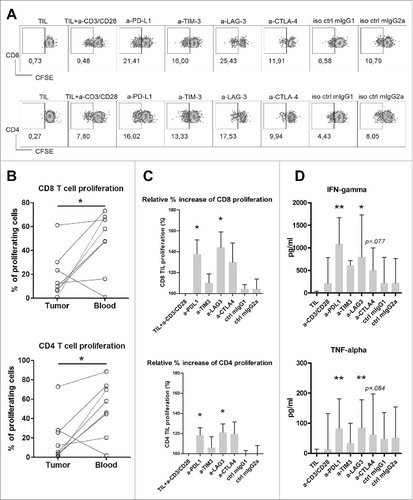
Because PD-1, TIM3, LAG3 and CTLA4 are upregulated on T cells in MMR-proficient LM-CRC tumors, we tested whether blockade of the PD-1/PD-L1, TIM3/galectin 9, LAG3/MHC-II or CTLA4/CD80/CD86 pathways could enhance the effector functions of tumor-derived T cells. We stimulated CFSE-labeled total tumor-infiltrating mononuclear leukocytes with CD3/CD28 beads, in the presence or absence of antagonistic antibodies against human PD-L1, TIM3, LAG3, CTLA4 or isotype controls (mIgG1 or mIgG2 a). After four days of culture, T cell proliferation was measured by flow cytometry (), and effector cytokine secretion in the culture supernatants was quantified by enzyme-linked immunosorbent assay. illustrates that the baseline proliferation of CD8+ and CD4+ T cells derived from tumors was significantly lower than that of T cells from the blood of the same patients, indicating the proliferative function of intra-tumoral T cells is impaired compared to circulating T cells of patients with MMR-proficient LM-CRC. Interestingly, treatment with anti-LAG3 antibody or anti-PD-L1 antibody significantly increased the proliferation of both CD8+ and CD4+ TIL compared with the control condition without antagonistic antibody (). These two antibodies also significantly increased IFN-γ and TNF-α secretion ().
Figure 5. Antibody blockade of LAG3 or PD-L1 boosts ex vivo proliferation and cytokine production of intra-tumoral T cells from MMR-proficient LM-CRC in response to polyclonal stimuli. CFSE-labeled TIL from LM-CRC patients were stimulated with CD3/CD28 beads for four days, in the presence or absence of 10 μg/ml antagonistic antibodies. (A) Representative dot plots of CD3+CD8+ and CD3+CD4+ TIL proliferation in response to CD3/CD28 beads (a-CD3/CD28) in the presence or absence of antagonistic antibodies (a-) or isotype controls (iso ctrl). Dotplots indicated by “TIL” show proliferative responses in the absence of CD3/CD28 beads. In all other conditions, CD3/CD28 beads were added. (B) The percentages of proliferating cells (CFSE-low) within CD8+ and CD4+ T cells derived from the tumor or blood in response to CD3/CD28 beads without addition of any antagonistic antibody. Values of individual patients are presented. (C) Effects of antibody blockade of inhibitory interactions on CD8+ and CD4+ TIL proliferation (n = 7-9). Because the proliferative responses differed between patients, the results are reported as relative proliferation in the presence of antibodies compared to baseline proliferation, which was calculated by dividing the percentages of proliferating (CFSE-low) T cells in the presence of antagonistic antibody or isotype control antibody by the percentages in the control condition with only CD3/CD28 beads. Values are depicted as means with standard error of the mean. (D) IFN-γ and TNF-α accumulation in culture supernatants was quantified at day four by enzyme-linked immunosorbent assay. Values are depicted as medians with interquartile range (n = 10-11). Differences were analyzed by paired t test or Wilcoxon matched pairs test; *p < 0.05, **p < 0.01.
Antibody blockade of LAG3 or PD-L1 boosts ex vivo responses of T cells derived from MMR-proficient LM-CRC to autologous tumor antigens
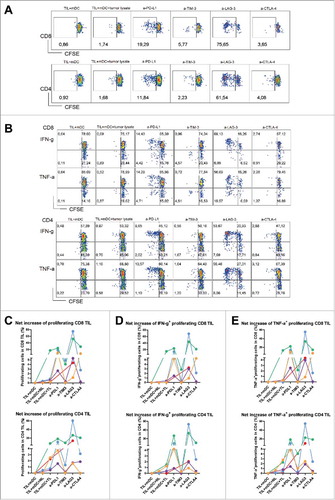
To investigate whether blockade of the aforementioned inhibitory pathways can enhance tumor-specific anti-tumor T cell responses, we stimulated CFSE-labeled total tumor-infiltrating mononuclear leukocytes with autologous blood-derived mDC preloaded with autologous tumor lysates, in the presence or absence of antagonistic antibodies, and measured CD8+ and CD4+ T cell proliferation after six days. Increased TIL proliferation against mDC loaded with tumor lysates compared with mDC without tissue lysates was observed in all five tested patients, while loading of mDC with normal liver lysates did not increase or minimally increased TIL proliferative responses (, C). Addition of anti-PD-L1 antibody enhanced proliferative responses of TIL in all four tested patients, while treatment with anti-LAG3 antibody increased both CD8+ and CD4+ TIL proliferation in four out of five patients. In three out of four patients anti-LAG3 antibody boosted CD8+ and/or CD4+ TIL responses to higher levels than anti-PD-L1 antibody (, C). After five hours of restimulation, intracellular expression of IFN-γ and TNF-α in proliferating T cells was analyzed, and was found to be enhanced by both anti-LAG3 and anti-PD-L1 antibodies in most patients (, D, E). Like in CD3/CD28 stimulations, anti-TIM3 and anti-CTLA4 antibodies boosted TIL responses less strongly and also in less patients.
Figure 6. Antibody blockade of LAG3 or PD-L1 boosts ex vivo responses of intra-tumoral T cells from MMR-proficient LM-CRC to autologous tumor antigens. Blood mDC loaded with autologous tumor lysates were used to stimulate CFSE-labeled TIL, in the presence or absence of 10 μg/mL antagonistic antibodies. After six days T cell proliferation and intracellular cytokine production were analyzed after re-stimulation with PMA and ionomycin. (A) (B) Representative dot plots of T cell proliferation, IFN-γ and TNF-α expression in CD3+CD8+ and CD3+CD4+ TIL, in response to autologous mDC pre-loaded with tumor lysates (TIL+mDC+tumor lysate), in the presence or absence of antagonistic antibodies (a-). TIL responses to mDC that were not pre-loaded with tumor lysates (TIL+mDC) served as controls to determine non-antigen-specific TIL proliferation and cytokine production. (C) (D) (E) Collective data of five patients tested. Each line and each color represent one patient. The results are reported as net tumor-specific responses, calculated by subtracting the percentages of proliferating (CFSE-low) T cells or IFN-γ+ or TNF-α+ proliferating T cells in the control condition (mDC without tissue lysates) from the percentages in the conditions with tumor lysates (TL) in the absence or presence of antagonistic antibody. In two experiments an additional control was included, in which TIL were stimulated with blood mDC pre-loaded with normal liver lysates (NL), which did not lead to increased TIL responses.
Higher LAG3 expression on intra-tumoral CD8+ T cells is associated with longer progression-free survival of patients with MMR-proficient LM-CRC
In a subset of patients, we could analyze associations between the frequencies of inhibitory receptor positive TIL and patient progression-free survival after the LM-CRC resection. In survival analysis higher expression of LAG3 on CD8+ TIL, CD4+ Th and Treg was associated with longer time to recurrence (), whereas higher expression of PD-1 or TIM3 on CD8+ TIL was associated with shorter time to recurrence (data not shown). In multivariable analysis only LAG3 expression on CD8+ TIL was demonstrated to be an independent predictor of progression-free survival (), which supports its functional relevance to anti-cancer immunity in TIL of LM-CRC. We hypothesize that LAG3+CD8+ TIL may be highly activated T cells () stimulated by tumor antigens, but subsequently inhibited by increased and continuous expression of LAG3 and interaction with its ligands on APC and tumor cells, yet with preserved effector functions (), which may control tumor growth. Because the sample size is small, these results need conformation in an independent study. In one fourth of the patients we only have data of LAG3 expression on CD8+ TIL but not on CD4+ Th or Treg, so we did not include the latter T cell subsets in the multivariable analysis. The death events were too few to analyze overall survival of LM-CRC patients.
Figure 7. Kaplan-Meier curves of progression-free survival (time to recurrence) in relation to LAG3 expression on intra-tumoral T cells in MMR-proficient LM-CRC. The cutoff values to divide the patients into two groups are the median percentages of LAG3+ cells in tumor-infiltrating CD8+ CTL, CD4+Foxp3− Th or CD4+Foxp3+ Treg cells. For determination of the p values the Breslow test was used.
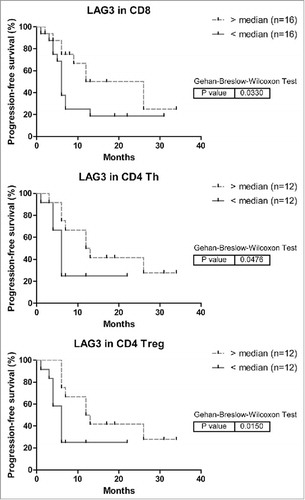
Table 2. Multivariable Cox proportional Hazard regression analysis of progression-free survival of patients with MMR-proficient LM-CRC.
Discussion
Checkpoint inhibitors have recently emerged as attractive treatments for several types of solid cancers. However, PD-1 and PD-L1 blocking antibodies were proven unsuccessful in CRC, with the exception of MMR-deficient CRC.Citation23-Citation25,Citation27,Citation28 The first aim of this study was to investigate whether the composition of the immune infiltrates and the intra-tumoral expression levels of inhibitory molecules in CRC metastases in the liver environment differ from those in primary CRC tumors and metastases outside the liver, which would suggest potential differences in sensitivity to checkpoint inhibitors among CRC tumors at different anatomical locations. The second objective was to determine whether targeting of inhibitory checkpoint pathways by antagonistic antibodies can enhance the functionality and anti-tumor responses of tumor-infiltrating T cells in LM-CRC. Because the incidence of MMR deficiency in LM-CRC is low, we focused on MMR-proficient tumors.
This study is the first to investigate the expression levels of inhibitory receptors on TIL in LM-CRC. Similar to what we reported in hepatocellular carcinoma,Citation44 intra-tumoral CD8+ CTL and CD4+ Th in MMR-proficient LM-CRC displayed increased expression of PD-1, TIM3, CTLA4 and/or LAG3 compared to their counterparts in TFL and blood. In addition, we found selectively enhanced expression of PD-1 and TIM3 on intra-tumoral Treg (-E). The elevated frequencies of inhibitory receptor positive cells in TIL together with the expression of their ligands on tumor-infiltrating APC (-D) suggest that these inhibitory checkpoint pathways may be involved in intra-tumoral suppression of T cells in MMR-proficient LM-CRC.
Interestingly, we observed higher expression of PD-1 and/or TIM3 on CD8+ CTL and Treg in LM-CRC than in primary CRC, while expression of LAG3, TIM3 and/or PD-1 on CD8+ CTL, Th and Treg was higher in LM-CRC than in PM-CRC (). We hypothesize that these differences are due to the unique tolerogenic properties of the liver environment, which induces expression of inhibitory receptors on hepatic T cells both in diseased and healthy conditions.Citation37,Citation38 Furthermore, we found increased proportions of CD8+ CTL in LM-CRC and PM-CRC compared with primary CRC (). The observed differences between MMR-proficient LM-CRC and MMR-proficient primary CRC are to some extent reminiscent of those found between MMR-deficient primary CRC and MMR-proficient primary CRC by Llosa et al.Citation31 They demonstrated that MMR-deficient primary CRC displayed higher infiltration with CD8+ CTL as well as upregulated expression of PD-1, PD-L1, CTLA4 and LAG3 compared to MMR-proficient primary CRC, and suggested that these differences contributed to the enhanced clinical responsiveness to anti-PD-1 therapy of microsatellite instable CRC compared with microsatellite stable CRC.Citation31 In addition, we found that LM-CRC contained increased frequencies of professional APC subsets (mDC and monocytes) (), which may result in improved presentation of tumor antigens to intra-tumoral T cells as well as more PD-L1 and MHC-II expression in LM-CRC compared with primary CRC, because in LM-CRC mDC and monocytes expressed more PD-L1 and MHC-II than B cells (). Hierarchical clustering analysis showed that the immune phenotypical data of most LM-CRC tumors clustered together as did the data of most primary CRC tumors (Supplementary Fig. S2). These data confirm those of Halama et al., who demonstrated similar heterogeneity in composition of immune infiltrates between paired primary CRC tumors and liver metastases derived from the same patients.Citation35 We extracted and statistically analyzed their paired data of primary CRC and LM-CRC from 16 patients and found a higher CD8+ cell density in LM-CRC than in primary CRC (Supplementary Fig. S6).
Moreover, discrepancies in somatic mutations, copy number alterations, genetic and epigenetic molecular alterations between primary CRC tumors and matched liver metastases were revealed in up to a half of the cases, which may lead to higher mutational load and thereby more neo-epitopes in LM-CRC.Citation45-Citation48 Together, these findings indicate major differences between liver metastases and primary CRC as well as peritoneal metastases, including differences in immune cell infiltration and inhibitory molecule expression, which may be at least partly induced by the liver environment. We therefore suggest that TIL of MMR-proficient LM-CRC may be more sensitive to PD-1/PD-L1 blockade and other checkpoint inhibitors than TIL of MMR-proficient primary CRC and CRC metastases at other anatomical locations. Nevertheless, to precisely compare the effects of checkpoint inhibitors on TIL of primary CRC and LM-CRC, experiments with TIL from paired tissues might be needed but were unfortunately not available in the current study.
To determine whether TIL expressing inhibitory receptors represent T cells that are recently activated upon recognition of tumor antigens, or are dysfunctional due to chronic antigenic stimulation, we studied their ex vivo activation status and in vitro effector cytokine production. Similar to what we reported in hepatocellular carcinoma,Citation44 intra-tumoral CD4+ Th and CD8+ CTL expressing any of the four inhibitory receptors showed a more activated status but produced reduced or similar levels of effector cytokines than their counterparts not expressing the corresponding inhibitory receptor (). However, in our ex vivo cultures, tumor cells that may express inhibitory ligands are lacking, so the TIL might be less functional in vivo and need checkpoint inhibitors. Nevertheless, proliferative responses of tumor-derived T cells to CD3/CD28 stimulation were lower than those of circulating T cells (). Consistent with what others reported on IFN-γ production by CD8+ TIL in primary CRC patients,Citation49,Citation50 our results demonstrate a certain degree of dysfunctionality of intra-tumoral CD4+ Th and CD8+ CTL in MMR-proficient LM-CRC, which may be at least partly due to inhibitory checkpoint interactions between T cells and APC subsets in the TIL cultures, but not complete dysfunctionality.
This study is also the first to investigate the effects of antibody blockade of four inhibitory checkpoint pathways on responses of TIL isolated from MMR-proficient LM-CRC. In both polyclonal T cell activation and tumor-specific TIL stimulation assays, increased proliferation of TIL and increased production of effector cytokines were observed upon the addition of anti-LAG3 antibody or anti-PD-L1 antibody ( and ) In some patients ex vivo anti-tumor responses of TIL were more robustly enhanced by anti-LAG3 antibody than by anti-PD-L1 antibody (), suggesting that LAG3 might be the most promising target for immunotherapy of LM-CRC among all four checkpoint pathways tested in this study. However, these data need confirmation using TIL from a larger number of patients. The superiority of LAG3 blockade compared to PD-L1 blockade was more seen in tumor antigen-specific stimulation than in polyclonal stimulation. We hypothesize that the small proportion of LAG3+ TIL is strongly enriched with tumor antigen-reactive T cells, which are known to constitute only a small proportion of all tumor-infiltrating T cells. In addition, we propose that PD-1 is expressed on a larger fraction of TIL which contains more non-tumor antigen-specific T cells. Although TIM3 blockade was reported to reduce T cell apoptosis and inhibit tumor growth in a mouse CT26 colon tumor model,Citation51 little effect was observed in our experiments using TIL derived from human LM-CRC. This result also contrasts to our recent observation that ex vivo responses of TIL isolated from hepatocellular carcinomas can be invigorated by TIM3 blockade.Citation44 This difference may relate to the lower expression of galectin 9 on APC subsets in LM-CRC compared to hepatocellular carcinomas.
Because we were interested in the net effects of checkpoint inhibitors on TIL responses in a context that reflected the LM-CRC tumor microenvironment as much as possible, we used total tumor-infiltrating mononuclear leukocytes in our functional assays, which contained both T cells expressing inhibitory receptors and APC expressing inhibitory ligands. As a consequence, tumor-infiltrating Treg,Citation40,Citation41 type 1 regulatory T cellsCitation52 and probably other types of immune suppressor cells were also present in these assays. Therefore, the reported functional effects of checkpoint inhibitors on effector T cells in these assays may be partly indirect, mediated by effects of these antibodies on suppressor cells. The effects of checkpoint inhibitor on effector T cells in our assays might even be counteracted by its effects on suppressor cells. We found that half of Treg in LM-CRC tumors expressed PD-1, and blocking PD-1/PD-L1 interaction was shown to enhance the suppressive function of Treg isolated from liver tissues of patients with chronic hepatitis C infection.Citation53
Interestingly, higher expression of LAG3 on CD8+ TIL was associated with longer time to recurrence of patients with LM-CRC. We hypothesize that LAG3+CD8+ TIL are cells which have recently been activated () by recognition of antigens in the tumor, and upregulate LAG3 expression in response to activation but still have functional capacity to exert effector functions and delay tumor growth (). LAG3 expression is upregulated on T cells after activation and differentiation,Citation54,Citation55 and intra-tumoral T cells that recognize tumor antigens are characterized by expression of LAG3 and other inhibitory receptors.Citation56 Although chronic tumor antigen stimulation in the tumor microenvironment can induce T cell exhaustion with simultaneous induction of high expression of multiple inhibitory receptors, this does not mean that all CD8+ TIL which express one or more inhibitory receptors at any level are functionally exhausted. Indeed, a recent mouse study showed that tumor antigen-specific TIL which expressed LAG3 or PD-1 produced IFN-γ in situ and had cytolytic potential.Citation57 Likewise, in the current study we observed that LAG3+CD8+ TIL in LM-CRC were not functionally impaired (). Nevertheless, they could be functionally invigorated upon antibody blockade of LAG3 ( and ), indicating that interaction of LAG3 with its ligands serves as an extrinsic mechanism in the tumor microenvironment which inhibits their functionality.
Our study has several limitations:1 Due to the finite numbers of isolated TIL, the tumor-specific stimulation assay could only be performed in a limited number of LM-CRC patients (Supplementary Table S1), neither could all the conditions be tested in every functional assay, nor could the relation between the expression of inhibitory molecules on TIL and the effects of checkpoint inhibitors on TIL responses be well analyzed.2 We could not study paired LM-CRC, primary CRC and PM-CRC tumors from the same patients because primary and metastatic CRC tumors were resected at different time points and in different hospitals.3 MMR-deficient tumors could not be studied well, because we received fresh tissues from only a few MMR-deficient tumors during our study.
In conclusion, increased frequencies of CD8+ CTL, mDC and monocytes as well as increased inhibitory receptor expression on intra-tumoral T cells in MMR-proficient LM-CRC suggest that TIL of MMR-proficient LM-CRC may be more sensitive to immune checkpoint inhibitors than TIL of MMR-proficient primary CRC. Blockade of LAG3 and PD-L1 can both enhance ex vivo functions of tumor-infiltrating T cells from MMR-proficient LM-CRC. Therefore, these two inhibitory pathways may be potential immunotherapeutic targets for the most prevalent metastatic liver cancer, despite the lack of MMR deficiency. Clinical studies focusing on responses of LM-CRC to anti-LAG3 and combination with anti-PD-L1 or anti-PD-1 antibodiesCitation12,Citation58 are required to conclude whether this prediction based on our preclinical study is correct.
Patients and methods
Patients and specimens
Fifty three patients who were eligible for surgical resection of LM-CRC were enrolled in the study from November 2013 to March 2017. Another twelve patients who received surgical resection of primary CRC and another eleven patients whose PM-CRC were surgically resected before hyperthermic intraperitoneal chemotherapy were enrolled in the study from February 2016 to December 2016. Fresh tissue samples from hepatic tumors, tumor-free liver tissues as distant as possible from the tumor (minimum 1 cm distance), colorectal tumors and peritoneal tumors were obtained. Peripheral blood from LM-CRC patients was also collected on the day of resection. None of the patients received chemotherapy or immunosuppressive therapy at least three months before surgery. The clinical characteristics of the patients are summarized in . The study was approved by the local ethics committee, and signed informed consent from all patients was obtained before tissue and blood donation.
Cell preparation
Peripheral blood mononuclear cells (PBMC) were isolated by Ficoll density gradient centrifugation. Single cell suspensions from tumors and tumor-free liver were obtained by tissue digestion. Briefly, fresh tissues were first cut into small pieces and then digested with 0.125 mg/mL collagenase IV (Sigma-Aldrich, St. Louis, MO) and 0.2 mg/mL DNAse I (Roche, Indianapolis, IN) in Hanks' Balanced Salt solution with Ca2+ and Mg2+ (Sigma, Zwijndrecht, The Netherlands) for 30 minutes at 37°C with interrupted gently swirling. Cell suspensions were filtered through 100 µm pore cell strainers (BD Biosciences, Erembodegem, Belgium) and mononuclear leukocytes were obtained by Ficoll density gradient centrifugation. Viability was determined by trypan blue exclusion.
Flow cytometric analysis
Fresh peripheral blood mononuclear cells (PBMC) and leukocytes isolated from tissues were analyzed for expression of surface and intracellular markers using specific antibodies (Supplementary Table S2). Cell surface staining with fluorochrome-conjugated antibodies was performed in the dark at 4°C for 30 minutes, then cells were washed and resuspended in phosphate buffered saline with 0.2 mM EDTA and 0.5% human serum. For Foxp3 and CTLA4 staining, cells were fixed and permeabilized using the Foxp3 staining buffer set (eBioscience, Vienna, Austria). For intracellular cytokine staining, cells were stimulated with 40 ng/mL PMA (Sigma, Zwijndrecht, The Netherlands) and 1 µg/mL ionomycin (Sigma) at 37°C for five hours in the presence of 5 µg/mL brefeldin (Sigma) for the last four hours, followed by staining of IFN-γ and TNF-α upon fixation and permeabilization using the Foxp3 staining buffer set. Dead cells were excluded by using a LIVE/DEAD fixable dead cell stain kit with aqua fluorescent reactive dye (Invitrogen, Paisley, UK). Cells were measured using a FACS Canto II flow cytometer (BD Biosciences, San Diego, USA) and analyzed using FlowJo software (version 10.0, LLC). Appropriate isotype control antibodies were used for gating purposes (Supplementary Table S2).
Ex vivo polyclonal T cell activation assay
All LM-CRC cell cultures were performed in complete medium RPMI 1640 (Lonza, Breda, The Netherlands) supplemented with 10% human AB serum (Invitrogen), 2 mM L-glutamine (Invitrogen), 50 mM Hepes Buffer (Lonza), 1% penicillin-streptomycin (Life Technologies), 5 mM Sodium Pyruvate (Gibco) and 1% minimum essential medium non-essential amino acids), at 37°C. TIL and PBMC from LM-CRC were labeled with 0.1 µM carboxyfluorescein diacetate succinimidyl ester (CFSE, Invitrogen); afterwards 105 TIL or PBMC were cultured in 200 µl complete medium in each well of a 96-well round-bottom culture plate and stimulated with anti-human CD3/CD28 dynabeads (Gibco-Life Technologies AS, Norway) at a cell: bead ratio of 10:1, in the presence or absence of 10 μg/ml antagonistic monoclonal antibodies against human PD-L1 (clone 5H1, kindly provided by Dr. Haidong Dong, Mayo Clinic College of Medicine,Citation59) TIM3 (clone F38-2E2, Biolegend, San Diego, USA,Citation60,Citation61) LAG3 (clone 17B4, AdipoGen, Liestal, SwitzerlandCitation62) or CTLA4 (clone BNI3, Beckman Coulter, Marseille, France,Citation63) or isotype-matched control antibodies (mIgG1 and mIgG2 a, Biolegend, London, UK). In preliminary experiments a cell: bead ratio of 10:1 was established to provide sub-optimal stimulation of T cell proliferation. After four days, culture supernatant was collected and frozen at -20°C until secretion of IFN-γ and TNF-α was quantified by enzyme-linked immunosorbent assay (ELISA, Ready-SET-Go!, eBioscience). CFSE-labeled cells were harvested and stained with CD8, CD4 and CD3 antibodies. Dead cells were excluded by using the LIVE/DEAD fixable dead cell stain kit with aqua fluorescent reactive dye, and T cell proliferation was determined based on CFSE dilution by flow cytometric analysis.
Ex vivo tumor-specific T cell stimulation assay
Tumor lysates and normal liver lysates were generated from a small piece of freshly resected metastatic liver tumor or TFL by five cycles of freezing and thawing in phosphate buffered saline, followed by filtration (0.2 μm syringe filter), as previously described.Citation40,Citation41 Myeloid dendritic cells (mDC) were isolated from patient autologous PBMC by depletion of CD19+ B cells followed by positive selection for BDCA-1 (BDCA-1 DC isolation kit, Miltenyi Biotec). mDC were cultured overnight with or without 20 µg/mL autologous tumor lysates or normal liver lysates, in the presence of 10 ng/mL granulocyte-macrophage colony-stimulating factor (Miltenyi Biotec) and 0.5 µg/mL polyinosinic: polycytidylic acid (InvivoGen, San Diego, CA). Simultaneously TIL isolated from LM-CRC were kept at 4°C in complete medium overnight. Thereafter TIL were labeled with 0.1 µM carboxyfluorescein diacetate succinimidyl ester (CFSE, Invitrogen), and 105 TIL were co-cultured with autologous mDC preloaded with or without tumor lysates or normal liver lysates at an mDC: TIL ratio of 1:5, in the presence or absence of 10 μg/ml antagonistic monoclonal antibodies against human PD-L1 (clone 5H1, kindly provided by Dr. Haidong Dong, Mayo Clinic College of Medicine,Citation59) TIM3 (clone F38-2E2, Biolegend, San Diego, USA,Citation44) LAG3 (clone 17B4, AdipoGen, Liestal, SwitzerlandCitation44) or CTLA4 (clone BNI3, Beckman Coulter, Marseille, France,Citation63) in 200 µl complete medium in each well of a 96-well round-bottom culture plate. After six days, cells were restimulated with PMA (40 ng/mL) and ionomycin (1 µg/mL) for five hours in the presence of 5 µg/mL brefeldin for the last four hours. Cells were then stained with CD8, CD4 and CD3 antibodies, followed by intracellular staining of IFN-γ and TNF-α upon fixation and permeabilization according to the manufacturer's instructions (eBioscience A&B fixation/permeabilization kit). Dead cells were excluded by using the LIVE/DEAD fixable dead cell stain kit with aqua fluorescent reactive dye, and T cell proliferation was determined based on CFSE dilution by flow cytometric analysis.
Determination of mismatch repair status by immunohistochemistry
Immunostainings were performed on formalin-fixed paraffin-embedded whole tissue sections (4 μm thick) using the Benchmark Ultra autoimmunostainer (Ventana Medical Systems Inc, Roche Group, Tucson, USA) according to the manufacturer's protocols and instructions. Briefly, deparaffinization was followed by heat-induced epitope retrieval in Ultra CC1 pre-diluted buffer for 48–60 minutes at 100°C. Primary antibodies anti-MLH1 (Novocastra; Leica Microsystems B.V., Amsterdam, The Netherlands; clone ES05; dilution 1:75), anti-PMS2 (Cell Marque, Rocklin, USA; clone EPR3947, ready to use), anti-MSH2 (Cell Marque, clone G219-1129; ready to use) and anti-MSH6 (Dako, Glosturp, Denmark; clone EP49; dilution 1:75) were applied and followed by incubation (from 40 minutes to 1 hour and 32 minutes). Upon antibody incubation Ventana standard signal amplification was performed, followed by ultraWash counter-staining with one drop of Hematoxylin (for 20 minutes) and one drop of bluing reagent (for 4 minutes). Then slides were removed from the stainer, washed in water with a drop of dishwashing detergent and mounted. These immunohistochemical stainings detected the presence or absence of the protein products of the MMR genes MLH1, PMS2, MSH2 and MSH6. The pattern of their loss provides information about which gene is not functioning properly. IHC staining was evaluated under a light microscope as follows: nuclear expression of all MMR proteins indicates an MMR-proficient tumor status, loss of nuclear expression of any of the proteins indicates an MMR-deficient tumor status.
Statistical analysis
The distributions of all continuous data set were analyzed for normality by the Shapiro-Wilk normality test. Differences between paired groups of data were analyzed by either paired t test or Wilcoxon matched pairs test according to their distribution. Differences between different groups of patients were analyzed by either unpaired t test or Mann-Whitney test according to their distributions. Correlation was analyzed by either Pearson or Spearman correlation test according to their distributions. These statistical analyses were performed using GraphPad Prism 5 (GraphPad Software). Hierarchical clustering was analyzed by one minus Pearson correlation using GENE-E (Broad Institute). Progression-free survival (time to recurrence) was calculated from the date of LM-CRC surgery to the date of event (LM-CRC recurrence), or the date of last follow-up. Patients lost to follow-up were censored as of the last day of follow-up. Survival curves were estimated by the Kaplan-Meier mothed. The Breslow test was used to assess differences between survival curves of different groups. For multivariable analysis, the Cox proportional Hazard regression analysis was used. These statistical analyses were performed using SPSS Statistics 21 (IBM). P values less than 0.05 were considered statistically significant (*p < 0.05; **p < 0.01; ***p < 0.001).
Abbreviations
| (CRC) | = | colorectal cancer |
| (LM-CRC) | = | liver metastasis of colorectal cancer |
| (PD-1) | = | programmed cell death protein 1 |
| (PD-L1) | = | CD274 molecule |
| (MMR) | = | mismatch repair |
| (CTL) | = | cytotoxic T cells |
| (Th) | = | T helper cells |
| (Treg) | = | regulatory T cells |
| (CTLA4) | = | cytotoxic T-lymphocyte associated antigen 4 |
| (GITR) | = | tumor necrosis factor receptor superfamily member 18 |
| (TIL) | = | tumor-infiltrating lymphocytes |
| (TFL) | = | tumor-free liver tissues |
| (PM-CRC) | = | peritoneal metastasis of colorectal cancer |
| (PBMC) | = | peripheral blood mononuclear cells |
| (mDC) | = | myeloid dendritic cells |
| (CFSE) | = | carboxyfluorescein diacetate succinimidyl ester |
| (TIM3) | = | hepatitis A virus cellular receptor 2 |
| (LAG3) | = | lymphocyte activating 3 |
| (BTLA) | = | B and T lymphocyte associated |
| (APC) | = | antigen-presenting cells |
| (MHC-II) | = | major histocompatibility complex class II |
Disclosure of potential conflicts of interest
No potential conflicts of interest were disclosed.
Supplemental Material
Download MS Word (1.5 MB)Acknowledgments
We acknowledge Sonja Buschow from department of Gastroenterology and Hepatology for assisting with hierarchical clustering analysis and Nicole Erler from department of Biostatistics for assisting with survival and multivariable analyses.
Supplemental Material
Supplemental data for this article can be accessed on the publisher's website.
Additional information
Funding
Notes on contributors
Guoying Zhou
G Zhou [email protected] contributed to conception and design, development of methodology, acquisition, analysis and interpretation of data, writing, review and revision of the manuscript and obtained funding.
Lisanne Noordam
L Noordam [email protected] contributed to acquisition, analysis and interpretation of data, review and revision of the manuscript.
Dave Sprengers
D Sprengers [email protected] contributed to conception and design, review and revision of the manuscript, material support and study supervision.
Michail Doukas
M Doukas [email protected] contributed to acquisition of data, material support, review and revision of the manuscript.
Patrick P. C. Boor
P Boor [email protected] contributed to acquisition of data and development of methodology.
Adriaan A. van Beek
A van Beek [email protected] contributed to acquisition of data, review and revision of the manuscript.
Remco Erkens
R Erkens [email protected] contributed to acquisition of data.
Shanta Mancham
S Mancham [email protected] contributed to acquisition of data.
Dirk Grünhagen
D Grünhagen [email protected] contributed to material support, review and revision of the manuscript.
Anand G. Menon
A Menon [email protected] contributed to material support, review and revision of the manuscript.
Johan F. Lange
J Lange [email protected] contributed to material support.
Pim J. W. A. Burger
P Burger [email protected] contributed to material support.
Alexandra Brandt
A Brandt [email protected] contributed to material support.
Boris Galjart
B Galjart [email protected] contributed to acquisition of data.
Cornelis Verhoef
C Verhoef [email protected] contributed to material support, review and revision of the manuscript.
Jaap Kwekkeboom
J Kwekkeboom [email protected] contributed to conception and design, interpretation of data, study supervision, writing, review and revision of the manuscript.
Marco J. Bruno
M Bruno [email protected] contributed to review and revision of the manuscript, obtained funding and study supervision.
References
- Torre LA, Bray F, Siegel RL, Ferlay J, Lortet-Tieulent J, Jemal A. Global cancer statistics, 2012. CA Cancer J Clin. 2015;65(2):87–108. doi:10.3322/caac.21262. PMID:25651787.
- Jalili-Nik M, Soltani A, Moussavi S, Ghayour-Mobarhan M, Ferns GA, Hassanian SM, Avan A. Current status and future prospective of Curcumin as a potential therapeutic agent in the treatment of colorectal cancer. J Cell Physiol. 2017. doi:10.1002/jcp.26368. PMID: 29219177.
- Kallini JR, Gabr A, Abouchaleh N, Ali R, Riaz A, Lewandowski RJ, Salem R. new developments in interventional oncology: Liver metastases from colorectal cancer. Cancer J. 2016;22(6):373–80. doi:10.1097/PPO.0000000000000226. PMID:27870679.
- Zarour LR, Anand S, Billingsley KG, Bisson WH, Cercek A, Clarke MF, Coussens LM, Gast CE, Geltzeiler CB, Hansen L. Colorectal cancer liver metastasis: Evolving paradigms and future directions. Cell Mol Gastroenterol Hepatol. 2017;3(2):163–73. doi:10.1016/j.jcmgh.2017.01.006. PMID:28275683.
- Kemeny N. The management of resectable and unresectable liver metastases from colorectal cancer. Curr Opin Oncol. 2010;22(4):364–73. doi:10.1097/CCO.0b013e32833a6c8a. PMID:20520544.
- Fonseca GM, Herman P, Faraj SF, Kruger JAP, Coelho FF, Jeismann VB, Cecconello I, Alves VAF, Pawlik TM, de Mello ES. Pathological factors and prognosis of resected liver metastases of colorectal carcinoma: implications and proposal for a pathological reporting protocol. Histopathology. 2018;72(3):377–90. doi:10.1111/his.13378. PMID:28858385.
- Engstrand J, Nilsson H, Stromberg C, Jonas E, Freedman J. Colorectal cancer liver metastases – a population-based study on incidence, management and survival. BMC Cancer. 2018;18(1):78. doi:10.1186/s12885-017-3925-x. PMID:29334918.
- Bartlett EK, Simmons KD, Wachtel H, Roses RE, Fraker DL, Kelz RR, Karakousis GC. The rise in metastasectomy across cancer types over the past decade. Cancer. 2015;121(5):747–57. doi:10.1002/cncr.29134. PMID:25377689.
- Tomlinson JS, Jarnagin WR, DeMatteo RP, Fong Y, Kornprat P, Gonen M, Kemeny N, Brennan MF, Blumgart LH, D'Angelica M. Actual 10-year survival after resection of colorectal liver metastases defines cure. J Clin Oncol. 2007;25(29):4575–80. doi:10.1200/JCO.2007.11.0833. PMID:17925551.
- Nordlinger B, Sorbye H, Glimelius B, Poston GJ, Schlag PM, Rougier P, Bechstein WO, Primrose JN, Walpole ET, Finch-Jones M. Perioperative FOLFOX4 chemotherapy and surgery versus surgery alone for resectable liver metastases from colorectal cancer (EORTC 40983): long-term results of a randomised, controlled, phase 3 trial. Lancet Oncol. 2013;14(12):1208–15. doi:10.1016/S1470-2045(13)70447-9. PMID:24120480.
- Van Cutsem E, Kohne CH, Hitre E, Zaluski J, Chang Chien CR, Makhson A, et al. Cetuximab and chemotherapy as initial treatment for metastatic colorectal cancer. N Engl J Med. 2009;360(14):1408–17. doi:10.1056/NEJMoa0805019. PMID:19339720.
- Ascierto PA, McArthur GA. Checkpoint inhibitors in melanoma and early phase development in solid tumors: what's the future? J Transl Med. 2017;15(1):173. doi:10.1186/s12967-017-1278-5. PMID:28789707.
- Granier C, De Guillebon E, Blanc C, Roussel H, Badoual C, Colin E, Saldmann A, Gey A, Oudard S, Tartour E. Mechanisms of action and rationale for the use of checkpoint inhibitors in cancer. ESMO Open. 2017;2(2):e000213. doi:10.1136/esmoopen-2017-000213. PMID:28761757.
- Rotte A, Jin JY, Lemaire V. Mechanistic overview of immune checkpoints to support the rational design of their combinations in cancer immunotherapy. Ann Oncol. 2018;29(1):71–83. doi:10.1093/annonc/mdx686. PMID:29069302.
- Anderson AC, Joller N, Kuchroo VK. Lag-3, Tim-3, and TIGIT: Co-inhibitory Receptors with Specialized Functions in Immune Regulation. Immunity. 2016;44(5):989–1004. doi:10.1016/j.immuni.2016.05.001. PMID:27192565.
- Buchbinder EI, Desai A. CTLA-4 and PD-1 Pathways: Similarities, Differences, and Implications of Their Inhibition. Am J Clin Oncol. 2016;39(1):98–106. doi:10.1097/COC.0000000000000239. PMID:26558876.
- Schachter J, Ribas A, Long GV, Arance A, Grob JJ, Mortier L, Daud A, Carlino MS, McNeil C, Lotem M. Pembrolizumab versus ipilimumab for advanced melanoma: final overall survival results of a multicentre, randomised, open-label phase 3 study (KEYNOTE-006). Lancet. 2017;390(10105):1853–62. doi:10.1016/S0140-6736(17)31601-X. PMID:28822576.
- Kang YK, Boku N, Satoh T, Ryu MH, Chao Y, Kato K, Chung HC, Chen JS, Muro K, Kang WK. Nivolumab in patients with advanced gastric or gastro-oesophageal junction cancer refractory to, or intolerant of, at least two previous chemotherapy regimens (ONO-4538-12, ATTRACTION-2): a randomised, double-blind, placebo-controlled, phase 3 trial. Lancet. 2017;390(10111):2461–71. doi:10.1016/S0140-6736(17)31827-5. PMID:28993052.
- Rittmeyer A, Barlesi F, Waterkamp D, Park K, Ciardiello F, von Pawel J, Gadgeel SM, Hida T, Kowalski DM, Dols MC. Atezolizumab versus docetaxel in patients with previously treated non-small-cell lung cancer (OAK): a phase 3, open-label, multicentre randomised controlled trial. Lancet. 2017;389(10066):255–65. doi:10.1016/S0140-6736(16)32517-X. PMID:27979383.
- Bellmunt J, de Wit R, Vaughn DJ, Fradet Y, Lee JL, Fong L, Vogelzang NJ, Climent MA, Petrylak DP, Choueiri TK. Pembrolizumab as Second-Line Therapy for Advanced Urothelial Carcinoma. N Engl J Med. 2017;376(11):1015–26. doi:10.1056/NEJMoa1613683. PMID:28212060.
- Larkin J, Chiarion-Sileni V, Gonzalez R, Grob JJ, Cowey CL, Lao CD, et al. Combined Nivolumab and Ipilimumab or Monotherapy in Untreated Melanoma. N Engl J Med. 2015;373(1):23–34. doi:10.1056/NEJMoa1504030. PMID:26027431.
- El-Khoueiry AB, Sangro B, Yau T, Crocenzi TS, Kudo M, Hsu C, Kim TY, Choo SP, Trojan J, Welling TH Rd. Nivolumab in patients with advanced hepatocellular carcinoma (CheckMate 040): an open-label, non-comparative, phase 1/2 dose escalation and expansion trial. Lancet. 2017;389(10088):2492–502. doi:10.1016/S0140-6736(17)31046-2. PMID:28434648.
- Topalian SL, Hodi FS, Brahmer JR, Gettinger SN, Smith DC, McDermott DF, Powderly JD, Carvajal RD, Sosman JA, Atkins MB. Safety, activity, and immune correlates of anti-PD-1 antibody in cancer. N Engl J Med. 2012;366(26):2443–54. doi:10.1056/NEJMoa1200690. PMID:22658127.
- Brahmer JR, Tykodi SS, Chow LQ, Hwu WJ, Topalian SL, Hwu P, Drake CG, Camacho LH, Kauh J, Odunsi K. Safety and activity of anti-PD-L1 antibody in patients with advanced cancer. N Engl J Med. 2012;366(26):2455–65. doi:10.1056/NEJMoa1200694. PMID:22658128.
- Brahmer JR, Drake CG, Wollner I, Powderly JD, Picus J, Sharfman WH, Stankevich E, Pons A, Salay TM, McMiller TL. Phase I study of single-agent anti-programmed death-1 (MDX-1106) in refractory solid tumors: safety, clinical activity, pharmacodynamics, and immunologic correlates. J Clin Oncol. 2010;28(19):3167–75. doi:10.1200/JCO.2009.26.7609. PMID:20516446.
- O'Neil BH, Wallmark JM, Lorente D, Elez E, Raimbourg J, Gomez-Roca C, Ejadi S, Piha-Paul SA, Stein MN, Abdul Razak AR. Safety and antitumor activity of the anti-PD-1 antibody pembrolizumab in patients with advanced colorectal carcinoma. PLoS One. 2017;12(12):e0189848. doi:10.1371/journal.pone.0189848. PMID:29284010.
- Le DT, Uram JN, Wang H, Bartlett BR, Kemberling H, Eyring AD, Skora AD, Luber BS, Azad NS, Laheru D. PD-1 Blockade in Tumors with Mismatch-Repair Deficiency. N Engl J Med. 2015;372(26):2509–20. doi:10.1056/NEJMoa1500596. PMID:26028255.
- Le DT, Durham JN, Smith KN, Wang H, Bartlett BR, Aulakh LK, Lu S, Kemberling H, Wilt C, Luber BS. Mismatch repair deficiency predicts response of solid tumors to PD-1 blockade. Science. 2017;357(6349):409–13. doi:10.1126/science.aan6733. PMID:28596308.
- Grady WM, Carethers JM. Genomic and epigenetic instability in colorectal cancer pathogenesis. Gastroenterology. 2008;135(4):1079–99. doi:10.1053/j.gastro.2008.07.076. PMID:18773902.
- Mlecnik B, Bindea G, Angell HK, Maby P, Angelova M, Tougeron D, Church SE, Lafontaine L, Fischer M, Fredriksen T. Integrative Analyses of Colorectal Cancer Show Immunoscore Is a Stronger Predictor of Patient Survival Than Microsatellite Instability. Immunity. 2016;44(3):698–711. doi:10.1016/j.immuni.2016.02.025. PMID:26982367.
- Llosa NJ, Cruise M, Tam A, Wicks EC, Hechenbleikner EM, Taube JM, Blosser RL, Fan H, Wang H, Luber BS. The vigorous immune microenvironment of microsatellite instable colon cancer is balanced by multiple counter-inhibitory checkpoints. Cancer Discov. 2015;5(1):43–51. doi:10.1158/2159-8290.CD-14-0863. PMID:25358689.
- Alvarado-Bachmann R, Smith A, Gundara JS, Kuo SC, Gill AJ, Samra JS, Hugh TJ. The incidence of mismatch repair gene defects in colorectal liver metastases. Mol Med Rep. 2014;10(2):1003–6. doi:10.3892/mmr.2014.2257. PMID:24859327.
- Katz SC, Pillarisetty V, Bamboat ZM, Shia J, Hedvat C, Gonen M, Jarnagin W, Fong Y, Blumgart L, D'Angelica M. T cell infiltrate predicts long-term survival following resection of colorectal cancer liver metastases. Ann Surg Oncol. 2009;16(9):2524–30. doi:10.1245/s10434-009-0585-3. PMID:19568816.
- Halama N, Michel S, Kloor M, Zoernig I, Benner A, Spille A, Pommerencke T, von Knebel DM, Folprecht G, Luber B. Localization and density of immune cells in the invasive margin of human colorectal cancer liver metastases are prognostic for response to chemotherapy. Cancer Res. 2011;71(17):5670–7. doi:10.1158/0008-5472.CAN-11-0268. PMID:21846824.
- Halama N, Spille A, Lerchl T, Brand K, Herpel E, Welte S, Keim S, Lahrmann B, Klupp F, Kahlert C. Hepatic metastases of colorectal cancer are rather homogeneous but differ from primary lesions in terms of immune cell infiltration. Oncoimmunology. 2013;2(4):e24116. doi:10.4161/onci.24116. PMID:23734335.
- Crispe IN. Immune tolerance in liver disease. Hepatology. 2014;60(6):2109–17. doi:10.1002/hep.27254. PMID:24913836.
- Kroy DC, Ciuffreda D, Cooperrider JH, Tomlinson M, Hauck GD, Aneja J, Berger C, Wolski D, Carrington M, Wherry EJ. Liver environment and HCV replication affect human T-cell phenotype and expression of inhibitory receptors. Gastroenterology. 2014;146(2):550–61. doi:10.1053/j.gastro.2013.10.022. PMID:24148617.
- Shi XL, Mancham S, Hansen BE, de Knegt RJ, de Jonge J, van der Laan LJ, Rivadeneira F, Metselaar HJ, Kwekkeboom J. Counter-regulation of rejection activity against human liver grafts by donor PD-L1 and recipient PD-1 interaction. J Hepatol. 2016;64(6):1274–82. doi:10.1016/j.jhep.2016.02.034. PMID:26941095.
- Kassel R, Cruise MW, Iezzoni JC, Taylor NA, Pruett TL, Hahn YS. Chronically inflamed livers up-regulate expression of inhibitory B7 family members. Hepatology. 2009;50(5):1625–37. doi:10.1002/hep.23173. PMID:19739236.
- Pedroza-Gonzalez A, Verhoef C, Ijzermans JN, Peppelenbosch MP, Kwekkeboom J, Verheij J, et al. Activated tumor-infiltrating CD4+ regulatory T cells restrain antitumor immunity in patients with primary or metastatic liver cancer. Hepatology. 2013;57(1):183–94. doi:10.1002/hep.26013. PMID:22911397.
- Pedroza-Gonzalez A, Zhou G, Singh SP, Boor PP, Pan Q, Grunhagen D, de Jonge J, Tran TK, Verhoef C, IJzermans JN. GITR engagement in combination with CTLA-4 blockade completely abrogates immunosuppression mediated by human liver tumor-derived regulatory T cells ex vivo. Oncoimmunology. 2015;4(12):e1051297. doi:10.1080/2162402X.2015.1051297. PMID:26587321.
- Katz SC, Bamboat ZM, Maker AV, Shia J, Pillarisetty VG, Yopp AC, Hedvat CV, Gonen M, Jarnagin WR, Fong Y. Regulatory T cell infiltration predicts outcome following resection of colorectal cancer liver metastases. Ann Surg Oncol. 2013;20(3):946–55. doi:10.1245/s10434-012-2668-9. PMID:23010736.
- Zheng Y, Manzotti CN, Burke F, Dussably L, Qureshi O, Walker LS, Sansom DM. Acquisition of suppressive function by activated human CD4+ CD25- T cells is associated with the expression of CTLA-4 not FoxP3. J Immunol. 2008;181(3):1683–91. doi:10.4049/jimmunol.181.3.1683. PMID:18641304.
- Zhou G, Sprengers D, Boor PPC, Doukas M, Schutz H, Mancham S, Pedroza-Gonzalez A, Polak WG, de Jonge J, Gaspersz M. Antibodies Against Immune Checkpoint Molecules Restore Functions of Tumor-infiltrating T cells in Hepatocellular Carcinomas. Gastroenterology. 2017;153(4):1107–19.e10. doi:10.1053/j.gastro.2017.06.017. PMID:28648905.
- Lee SY, Haq F, Kim D, Jun C, Jo HJ, Ahn SM, Lee WS. Comparative genomic analysis of primary and synchronous metastatic colorectal cancers. PLoS One. 2014;9(3):e90459. doi:10.1371/journal.pone.0090459. PMID:24599305.
- Munoz-Bellvis L, Fontanillo C, Gonzalez-Gonzalez M, Garcia E, Iglesias M, Esteban C, Gutierrez ML, Abad MM, Bengoechea O, De Las, Rivas J. Unique genetic profile of sporadic colorectal cancer liver metastasis versus primary tumors as defined by high-density single-nucleotide polymorphism arrays. Mod Pathol. 2012;25(4):590–601. doi:10.1038/modpathol.2011.195. PMID:22222638.
- Kawamata H, Yamashita K, Kojo K, Ushiku H, Ooki A, Watanabe M. Discrepancies between the K-ras mutational status of primary colorectal cancers and corresponding liver metastases are found in codon 13. Genomics. 2015;106(2):71–5. doi:10.1016/j.ygeno.2015.05.007. PMID:26026309.
- Miranda E, Bianchi P, Destro A, Morenghi E, Malesci A, Santoro A, Laghi L, Roncalli M. Genetic and epigenetic alterations in primary colorectal cancers and related lymph node and liver metastases. Cancer. 2013;119(2):266–76. doi:10.1002/cncr.27722. PMID:22786759.
- Wu X, Zhang H, Xing Q, Cui J, Li J, Li Y, Tan Y, Wang S. PD-1(+) CD8(+) T cells are exhausted in tumours and functional in draining lymph nodes of colorectal cancer patients. Br J Cancer. 2014;111(7):1391–9. doi:10.1038/bjc.2014.416. PMID:25093496.
- Xu B, Yuan L, Gao Q, Yuan P, Zhao P, Yuan H, Fan H, Li T, Qin P, Han L. Circulating and tumor-infiltrating Tim-3 in patients with colorectal cancer. Oncotarget. 2015;6(24):20592–603. doi:10.18632/oncotarget.4112. PMID:26008981.
- Kang CW, Dutta A, Chang LY, Mahalingam J, Lin YC, Chiang JM, Hsu CY, Huang CT, Su WT, Chu YY. Apoptosis of tumor infiltrating effector TIM-3+CD8+ T cells in colon cancer. Sci Rep. 2015;5:15659. doi:10.1038/srep15659. PMID:26493689.
- Pedroza-Gonzalez A, Zhou G, Vargas-Mendez E, Boor PP, Mancham S, Verhoef C, Polak WG, Grünhagen D, Pan Q, Janssen H. Tumor-infiltrating plasmacytoid dendritic cells promote immunosuppression by Tr1 cells in human liver tumors. Oncoimmunology. 2015;4(6):e1008355. doi:10.1080/2162402X.2015.1008355. PMID:26155417.
- Franceschini D, Paroli M, Francavilla V, Videtta M, Morrone S, Labbadia G, Cerino A, Mondelli MU, Barnaba V. PD-L1 negatively regulates CD4+CD25+Foxp3+ Tregs by limiting STAT-5 phosphorylation in patients chronically infected with HCV. J Clin Invest. 2009;119(3):551–64. doi:10.1172/JCI36604. PMID:19229109.
- Baitsch L, Legat A, Barba L, Fuertes Marraco SA, Rivals JP, Baumgaertner P, Christiansen-Jucht C, Bouzourene H, Rimoldi D, Pircher H. Extended co-expression of inhibitory receptors by human CD8T-cells depending on differentiation, antigen-specificity and anatomical localization. PLoS One. 2012;7(2):e30852. doi:10.1371/journal.pone.0030852. PMID:22347406.
- Legat A, Speiser DE, Pircher H, Zehn D, Fuertes Marraco SA. Inhibitory Receptor Expression Depends More Dominantly on Differentiation and Activation than “Exhaustion” of Human CD8 T Cells. Front Immunol. 2013;4:455. doi:10.3389/fimmu.2013.00455. PMID:24391639.
- Gros A, Robbins PF, Yao X, Li YF, Turcotte S, Tran E, Wunderlich JR, Mixon A, Farid S. PD-1 identifies the patient-specific CD8(+) tumor-reactive repertoire infiltrating human tumors. J Clin Invest. 2014;124(5):2246–59. doi:10.1172/JCI73639. PMID:24667641.
- Williams JB, Horton BL, Zheng Y, Duan Y, Powell JD, Gajewski TF. The EGR2 targets LAG-3 and 4-1BB describe and regulate dysfunctional antigen-specific CD8+ T cells in the tumor microenvironment. J Exp Med. 2017;214(2):381–400. doi:10.1084/jem.20160485. PMID:28115575.
- Paolo Antonio A, Ignacio M, Shailender B, Petri B, Rachel ES, Evan JL, et al. Initial efficacy of anti-lymphocyte activation gene-3 (anti–LAG-3; BMS-986016) in combination with nivolumab (nivo) in pts with melanoma (MEL) previously treated with anti–PD-1/PD-L1 therapy. Journal of Clinical Oncology. 2017;35(15_suppl):9520.
- Dong H, Strome SE, Salomao DR, Tamura H, Hirano F, Flies DB, Roche PC, Lu J, Zhu G, Tamada K. Tumor-associated B7-H1 promotes T-cell apoptosis: a potential mechanism of immune evasion. Nat Med. 2002;8(8):793–800. doi:10.1038/nm730. PMID:12091876.
- da Silva IP, Gallois A, Jimenez-Baranda S, Khan S, Anderson AC, Kuchroo VK, Osman I, Bhardwaj N. Reversal of NK-cell exhaustion in advanced melanoma by Tim-3 blockade. Cancer Immunol Res. 2014;2(5):410–22. doi:10.1158/2326-6066.CIR-13-0171. PMID:24795354.
- Fourcade J, Sun Z, Benallaoua M, Guillaume P, Luescher IF, Sander C, Kirkwood JM, Kuchroo V, Zarour HM. Upregulation of Tim-3 and PD-1 expression is associated with tumor antigen-specific CD8+ T cell dysfunction in melanoma patients. J Exp Med. 2010;207(10):2175–86. doi:10.1084/jem.20100637. PMID:20819923.
- Matsuzaki J, Gnjatic S, Mhawech-Fauceglia P, Beck A, Miller A, Tsuji T, Eppolito C, Qian F, Lele S, Shrikant P. Tumor-infiltrating NY-ESO-1-specific CD8+ T cells are negatively regulated by LAG-3 and PD-1 in human ovarian cancer. Proc Natl Acad Sci U S A. 2010;107(17):7875–80. doi:10.1073/pnas.1003345107. PMID:20385810.
- Boor PP, Metselaar HJ, Jonge S, Mancham S, van der Laan LJ, Kwekkeboom J. Human plasmacytoid dendritic cells induce CD8(+) LAG-3(+) Foxp3(+) CTLA-4(+) regulatory T cells that suppress allo-reactive memory T cells. Eur J Immunol. 2011;41(6):1663–74. doi:10.1002/eji.201041229. PMID:21469126.