
 ?Mathematical formulae have been encoded as MathML and are displayed in this HTML version using MathJax in order to improve their display. Uncheck the box to turn MathJax off. This feature requires Javascript. Click on a formula to zoom.
ABSTRACT
Activation of immune checkpoint pathways and limited T- cell infiltration result in immunological escape of tumors. Although immune checkpoint inhibitors are currently approved for several types of cancers, the response rate is often limited by the lack of tumor specific T-cells within the malignant tissue. Therefore, new combinatorial strategies are needed to enhance the clinical benefit of immune checkpoint inhibitors.
We have previously developed PeptiCRAd, an oncolytic vaccine platform capable of directing the immune response toward tumor epitopes. In this study, we evaluated whether the platform could be used to increase the response rate to checkpoint inhibitors in both highly immunogenic and poorly immunogenic tumors, such as melanoma and triple negative breast cancer (TNBC).
We report here that anti-PD-L1 therapy in combination with PeptiCRAd significantly reduced the growth of melanomas and increased the response rate to checkpoint inhibition. In fact, we registered a higher rate of complete responses among mice treated with the combination. This approach promoted the presence of non-exhausted antigen-specific T-cells within the tumor in comparison to anti-PD-L1 monotherapy. Furthermore, we found that targeting both MHC-I and II restricted tumor epitopes was necessary to decrease the growth of the poorly immunogenic TNBC model 4T1 and that combination with PD-L1 blockade increased the number of responders to checkpoint inhibition. Finally, the described strategy was validated in a translational in vitro model using HLA matched human PBMCs and tumor cell lines. Consistent to our previous results, improved cytotoxicity was observed with combination of PeptiCRAd and anti-PD-L1.
These results demonstrate that oncolytic virus based cancer vaccine can significantly improve the response rate to checkpoint blocking antibodies in the context of immunogenic and non-immunogenic tumors.
Introduction
The tumor microenvironment (TME) dampens anti-tumor responses by enhancing immunosuppressive circuits. Among these, inhibition of dendritic cells,Citation1 attraction of myeloid derived suppressor cells (MDSCs)Citation2-Citation3 and recruitment of regulatory T cells (Tregs)Citation4 are effective strategies that malignant cells use to evade immune surveillance. In addition, antigen-specific T-cells that infiltrate tumors and recognize tumor antigens are effectively inactivated by immune checkpoint pathways.Citation5-Citation6 These pathways are promoted by ligation of inhibitory receptors (IRs) and are involved in the phenomenon of T-cell exhaustion. Some of these receptors, such as Programmed cell death-1 (PD-1), are upregulated on T-cells after their priming (antigen-experiences T-cells) and serve as a physiological negative feedback to resolve immune responses.Citation7 However, chronic exposure to cognate antigens in combination with sustained signalling via IRs results in T-cell dysfunction and anergy (i.e. exhaustion).Citation8 Interestingly, this mechanism is often exploited by tumor cells to disrupt T-cell responses.Citation6 Therefore, reverting or preventing the exhaustion of anti-tumor T cells by blocking IRs with monoclonal antibodies (i.e. immune checkpoint inhibitors, ICIs) has led to clinical responses in several cancer indications since receiving FDA approval FDA.Citation9-Citation11
Although immune checkpoint blockade has been shown to induce durable responses and long-term remissions, many patients fail to respond or develop resistance over time.Citation9 The absence of tumor specific immunity and/or the poor infiltration of immune cells into the tumor results into unresponsiveness to ICI therapy.Citation12 This represents a strong rationale for the combination of checkpoint inhibition and active immunotherapy in order to turn an immunologically “cold” tumor into a “hot” one.Citation13-Citation14
The natural immunogenicity of viruses combined with their oncolytic activity favours the induction of a pro-inflammatory environment.Citation15 Oncolytic viruses are able to foster a specific anti-tumor immune responseCitation16 and thus represent optimal candidates for combination with ICI therapy. The first approved oncolytic virus T-VEC is currently being evaluated in combination with ipililmumab (anti-CTLA4) in a phase II trial (NCT01740297) and with pembrolizumab (anti-PD-1) in a phase Ib/III trail (NCT02263508) in melanoma patients.Citation17 Traditional oncolytic viruses such as T-VEC might prevent optimal treatment results with ICI by skewing the immune response toward viral antigens rather than tumor antigens, causing the checkpoint blockade to affect mainly anti-viral T cells and thus leading to faster virus clearance from tumors. Instead of traditional oncolytic viruses, we propose to combine Programmed death-ligand 1 (PD-L1) blockade with PeptiCRAd, an improved oncolytic vaccine platform that we have previously described.Citation18 This platform is based on oncolytic viruses coated with tumor-specific peptides using electrostatic interactions (18). We have previously shown that loading major histocompatibility complex I (MHC-I) restricted peptides onto the immunogenic viral capsid can promote tumor-specific immune responses in humanized mice bearing human melanoma tumors (18). In this study, we evaluated the feasibility of PeptiCRAd in context of checkpoint inhibition in vitro using HLA matched human peripheral blood mononuclear cells (PBMCs) with tumor cell lines and in vivo using two different syngeneic mouse tumor models representing two distinct tumor types: highly immunogenic melanoma and poorly immunogenic triple negative breast cancer (TNBC).
Results
The murine B16.OVA tumor model contains PD-1+ TILs, making it a suitable model for checkpoint inhibition studies
Immunotherapy studies require models which are responsive to modulation of tumor microenvironment by using cancer vaccines or checkpoint inhibitors. Therefore, we characterized the syngeneic B16.OVA melanoma model expressing the xeno-antigen ovalbumin, which is a widely used model antigen in immunological studies. By using flow cytometry, we observed that majority of B16.OVA cells express PD-L1 on their surface at steady state in vitro. However, upon exposure to interferon γ (IFNγ), the percentage of PD-L1 positive cells increased from 67% to 79% (, left) and the expression level of PD-L1 on the cells (represented by the geometric mean fluorescence intensity, gMFI) increased as well (, right). Next, we studied the phenotype of tumor-infiltrating lymphocytes (TILs) in B16.OVA tumors engrafted subcutaneously in C57 BL/6 J mice. We found that both CD4+ and CD8+ T-cells expressed PD-1 on their cell surface. However, CD8+ T-cells featured significantly higher levels of PD-1 compared to CD4+ T-cells (, left). Interestingly, we found profound differences in the PD-1 staining on CD8+ T-cells upon analysis of different organs. In fact, CD8+ TILs feature significantly higher levels of PD-1 compared to CD8+ T-cells found in secondary lymphoid organs (spleen or tumor-draining lymph nodes) of tumor bearing mice (, right).
Figure 1. Characterization of the immunological properties of the B16.OVA model and its suitability for immune checkpoint inhibition studies. A) B16.OVA melanoma cells were incubated for 24 hours with or without murine IFNγ. On the following day cells were stained for the presence of PD-L1 and analyzed by flow cytometry. An isotype antibody served as negative control. The percentage of PD-L1+ positive cells (left panel) and the geometrical mean fluorescence intensity (gMFI; right panel) are plotted as the mean ± SEM. B) Analysis of immunological samples collected from C57 BL/6 J female mice engrafted with B16.OVA tumors. The expression of the marker PD-1 on the surface of CD3+CD4+ and CD3+CD8+ tumor infiltrating cells (left panel). PD-1 expression on CD3+CD8+ cells in different organs. Statistics are done by using the Student´s t-test; *** p < 0,001, **** p < 0,0001. C) Activated (Act) (PD-1+TIM3-) or Exhausted (Exh) (PD-1+TIM-3+) lymphocytes were defined within the CD4+ or CD8+ populations by flow cytometry. The Pearson´s coefficient of correlation between all populations was then calculated. A positive coefficient represents a positive correlation, while a negative coefficient represents a negative correlation.
The differences in the phenotypic state of TILs prompted us to evaluate a possible correlation between different T-cell populations within the tumor. In this analysis, we define PD-1+TIM-3- cells as active and antigen experienced (i.e. Act) whereas PD-1+TIM-3+ cells are defined as antigen experienced but exhausted (i.e. Exh). As shown in we report the Pearson´s coefficients for the correlation between different subsets. A positive value indicates a positive correlation, while a negative value suggests a negative one. The presence of Activated CD4+ T-cells within the tumor positively correlates with an increased number of Activated CD8+ T-cells in the very same tumor. Vice versa, we found that the number of Exhausted CD4+ T-cells correlates with an increased number of Exhausted CD8+ T-cells. These finding suggests that there might be an underlying link between activation and exhaustion states of different sub-populations of T-cells.
The response rate to PD-L1 blockade is increased by combination with oncolytic vaccines in vivo
Despite achieving complete responses in some cases, many patients do not benefit from the expensive treatment. Desert tumors (i.e. cold tumors) are less responsive than tumors featuring high presence of TILs (i.e. hot tumors). Therefore, we sought to investigate how to improve the response to checkpoint inhibition by combining active immunotherapy such as an oncolytic vaccine platform (i.e. PeptiCRAd) with anti-PD-L1 therapy.
Mimicking a non-injectable lesion model, we treated B16.OVA-bearing mice with intraperitoneal administration of anti-PD-L1 antibody (aPD-L1) alone or in combination with subcutaneous injections of OVA-targeting PeptiCRAd (i.e. OVA-PeptiCRAd). PD-L1-blocking antibody slowed down the tumor growth compared to mock-treated mice, however, the combination with active immunotherapy (i.e. Combo group) increased the efficacy of the treatment significantly (). The primary tumors featured a significantly slower growth-kinetics as represented by the area under the curve analysis (AUC, ). Interestingly, the combination treatment was able to significantly reduce the growth of secondary tumors in a contralateral model (). This demonstrated that the oncolytic vaccine was able to create a beneficial, systemic immune response that together with the ICI reduced the growth of both primary and secondary tumors. When compared to mock, the overall survival of mice was improved by aPD-L1 therapy (median survival 29 days; ). However, the combination therapy was able to significantly increase the median survival of mice up to 36 days. Most importantly, complete responses were observed in 35.7% of the mice in the combo group versus only 14.2% of mice in the aPD-L1 group. In addition to complete responders, 87.5% of combo-treated mice had a tumor volume lower than 1000 mm3 compared to 42.8% of the cases in the aPD-L1 group (). Taken together these data demonstrates that the combination of immune checkpoint inhibitors with oncolytic vaccines improves the number of responders.
Figure 2. Combination of oncolytic vaccines and PD-L1 blockade increases the response to checkpoint inhibition. B16.OVA bearing female C57 BL/6 J mice (n = 7–8) were treated with saline solution (mock), OVA-PeptiCRAd oncolytic vaccine (day 6, 8 and 10, sub-cutaneously), 100 ug of anti-PD-L1 blocking antibody (aPD-L1) three times per week or a combination of the two monotherapies (Combo). A) Tumor volumes are plotted as the mean ± SEM. B) The area under the curves relative to the tumor growth of mice was calculated and plotted as the mean ± SEM. C) At day 28 long-term survivors were re-challenged on the left flank with B16 melanoma tumor cells (300000 cells/mouse). Volumes of the secondary tumors of long-term survivors are presented as mean ± SEM. E) Survival curve relative to the experiment presented in A. The percentage of tumor-free mice is indicated for aPD-L1 and Combo groups. The median survival of each group is reported in the table below the graph. F) The volumes of the primary tumors at day 35 are reported for each mouse to define the responders VS non-responders. Threshold of 1000 mm3 was set to define the response. The percentage of responders is reported below the x axis. G) C57 BL/6 J mice pre-immunized with the oncolytic adenovirus (PEI-COMBO) or naïve mice (Combo) were engrafted with B16.OVA tumor cells (n = 10). Both groups received the combination of oncolytic vaccine PeptiCRAd and aPD-L1 with standard regiment used previously. Tumor volume is presented as the mean ± SEM. H) Survival of the groups is presented and median survival reported. For tumor growth curves statistic were calculated by Two-Way ANOVA with Tukey´s post-test. The log rank Mantel-Cox analysis was used to calculate the p value of the survival curves. For the bar graphs the Student´s t-test was used. *p < 0.05, **p < 0.005, ***p < 0,001, ****p < 0,0001.
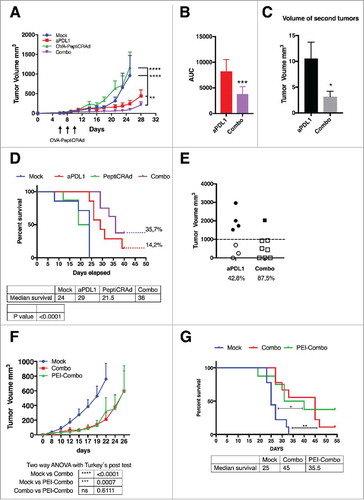
Despite the fact that PeptiCRAd platform is designed to induce anti-tumor immunity, the high prevalence of adenovirus among the human population prompted us to study whether pre-existing immunity (PEI) could affect the efficacy of PeptiCRAd as an active immune therapy in combination with PD-L1 blockade. We pre-immunized a group of mice (n = 10) with subcutaneous injections of the same oncolytic vector used for our in vivo studies (1 injection every week for a total of 3 weeks before the engraftment of the tumors). A neutralizing antibody assay confirmed the presence of anti-viral adaptive immunity to the oncolytic adenovirus (supplementary and ). We found that the efficacy of the combination treatment was largely the same between pre-immunized mice (PEI-Combo group) and naïve mice (Combo) as shown in and that PEI did not reduce the overall survival of treated mice ().
Immunological synergy between PD-L1 blockade and the oncolytic vaccine PeptiCRAd
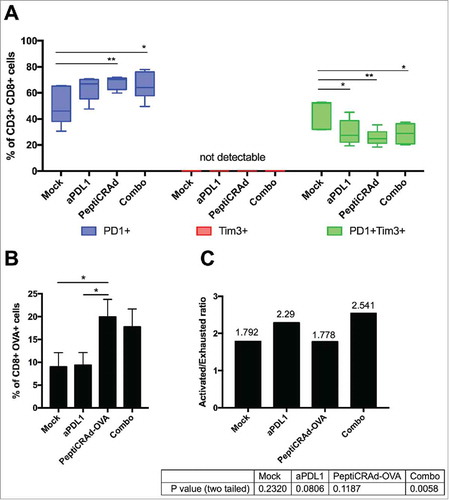
The previously described results in B16.OVA-bearing mice clearly demonstrated a benefit in combining checkpoint inhibitors with active immunotherapy. In order to gain insights into the phenotype of tumor infiltrating CTLs, we performed a series of flow cytometric assays. First, we investigated the activation and exhaustion state of CD3+CD8+ TILs by defining activated T cells as PD-1+TIM-3- and terminally exhausted T cells as PD-1+TIM-3+. Interestingly, TIM-3 single positive cells were not detected in any sample, suggesting that the presence of this marker is linked to the presence of PD-1 (, central red section). All the immunotherapies increased the number of PD-1+ T-cells (, left blue section), with PeptiCRAd and Combo treatment showing significantly more activated TILs than mock. Consistently, the immunotherapy treatments favoured the reduction of exhausted PD-1+TIM-3+ T-cells compared to mock (, right green section). Analysis of T cell specificity revealed that only mice receiving the oncolytic vaccine (i.e. PeptiCRAd and Combo groups) showed a significantly increased presence of OVA-specific CD8+ TILs compared to mock treatment (). As shown in , this tumor-specific population featured an increased ratio of activated and exhausted cells in mice receiving combination treatment (activated/exhausted ratio 2.541; p = 0.0058) compared to other groups. This demonstrates that the aPD-L1 + PeptiCRAd treatment favoured the presence of activated OVA-specific T-cells upon exhausted OVA-specific T-cells.
Figure 3. Induction of antigen specific cells by oncolytic vaccines synergizes with the inhibition of PD-1/PD-L1 interactions reshaping the immunological background. Tumor samples were collected from mice treated with the aPD-L1+OVA-PeptiCRAd combination presented in . CD3+CD8+ tumor infiltrating lymphocytes were evaluated for antigen specificity (SIINFEKL-Pentamers) and their state (PD-1 and TIM-3 expression) by flow cytometry. A) Percentages of single positive PD-1+ (blue) or TIM-3+ (red) or double positive PD-1+TIM-3+ (green) CD8+ TILs are plotted by Tukey box and whiskers for each group of animals. Analysis done by Two-Way ANOVA. B) The percentage of OVA specific CD8+ TILs was assayed by Pentamer Staining and it is plotted as the mean ± SEM. Analysis done by One-way ANOVA C) The ratio between Activated (PD-1+) and Exhausted (PD-1+TIM-3+) OVA-specific CD8+ TILs was calculated for each mouse. The ratio is reported on top of each bar. A statistical test was performed to assess if the ratio was significantly different than 1. The p-values for each group are reported below the graph.
Co-stimulation of CD4+ and CD8+ T-cells response elicits antitumor efficacy in triple negative breast cancer
Triple negative breast cancer (TNBC) lacks common tumor antigens and is considered poorly immunogenic. Nevertheless, we found a sustained expression of MHC-I molecules on both murine (supplementary ) and human (supplementary Fig. 2B) tumor cell lines. To this end, we decided to optimize our oncolytic vaccine platform to target MHC-I and MHC-II restricted tumor antigens simultaneously (available in Material and Methods).
We investigated whether stimulating both CD8+ and CD4+ T cell responses would give any advantage over stimulating only one type of response. To this end, we treated tumor-bearing mice with PeptiCRAds coated either with an MHC-class I epitope (PeptiCRAd-I), with an MHC-class II epitope (PeptiCRAd-II) or with both class I and II peptides (PeptiCRAd I+II). While both single coated PeptiCRAds showed a modest growth inhibition of 4T1 cells engrafted subcutaneously in Balb/c mice, treatment with the PeptiCRAd I+II showed a significant reduction in tumor growth at day 15 when compared to mock (). Nevertheless, the therapeutic vaccination with this approach did not lead to the full control of tumors. Following flow cytometric analysis, 4T1 tumor cells were found to express high levels of PD-L1 both in vitro () and in vivo (). We found the 4T1 tumor model to modulate the expression of PD-L1 in response to IFN in vitro () and this may explain the resistance of tumor cells to the treatment despite the infiltration of tumors with CD8+ and CD4+ T-cells. We further characterized the phenotype of TILs in 4T1 tumors and found that both CD4+ and CD8+ TILs expressed PD-1, while the proportion of PD-1+ cells was higher in the CD8+ subset (). Interestingly, we found statistically significant differences in the PD-1 status on CD8+ T-cells while analysing different organs. In fact, higher proportion of CD8+ T-cells found in tumors were PD-1+ compared to T-cells found in the spleen or draining lymph nodes (, right). This analysis suggests that the strong tumor immunosuppressive environment might limit the efficacy of oncolytic vaccines.
Figure 4. Antitumor activity of different PeptiCRAd formulations and immunological background analysis. (A) Balb/c mice (n = 7) received 3 × 10⁵ 4T1 cells in the right flank. Treatments were initiated on established tumor (9 days after implantation) and the mice were treated three times (on days 9, 11 and 13, black arrow). The average volume is represented in the tumor´s growth curve as mean ± SEM (statistical analysis 2way ANOVA with Tukey´s multiple comparisons test. *p < 0.05). (B) PD-L1 level in 4T1 are reported. The cells were stimulated with INFγ overnight. On the following day, the cells were stained for PD-L1 and analyzed by flow cytometry. The percentage of PD-L1 positive cells (left panel) and the geometrical mean fluorescence intensity (gMFI; right panel) are plotted as the mean ± SEM (statically analysis unpaired t-test. p < 0.05). C) PD-L1 level in tumor from mice bearing 4T1 tumor is described. The percentage of PD-L1+ positive cells (left panel) and the geometrical mean fluorescence intensity (gMFI; right panel) are plotted as the mean ± SEM. D) PD-1+ T cell infiltration in tumors, spleens and lymph nodes from mice bearing 4T1 tumor is shown (statically analysis unpaired t-test. p < 0.05). The flow cytometry analysis was performed in tumor, spleen and lymph node samples collected from mice and frozen. We used anti-mouse PE-PD-1, anti-mouse Percp/Cy5.5 CD3ϵ, anti-mouse FITC-CD8 and anti-mouse APC- CD4. The percentage of PD-1 positive cells is plotted as the mean ± SEM (statically analysis unpaired t-test. p < 0.05).
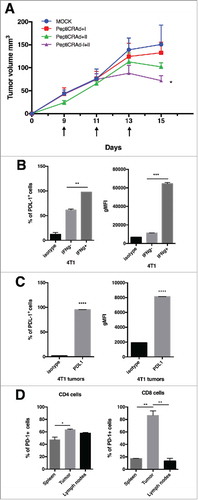
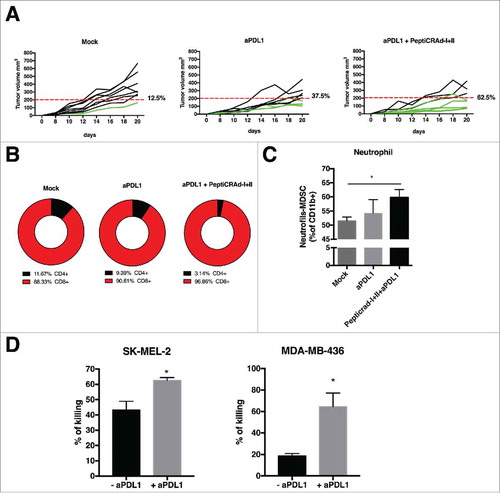
Figure 5. Anti-tumor activity PD-L1 blockade and PeptiCRAd mediated and immune modulation in tumor microenvironment. (A) The single tumor growth curves for single mouse and one graph for each group are reported (n = 10 animals per group). Responders are defined in percentage (displayed next to each graph) as mice that show an absolute volume lower than 200 mm3. (B) Flow cytometry analysis of CD4 and CD8T cells in tumor samples from the animal groups is presented. (C) At the end of the experiment the tumors were collected and analyzed for the PMN-MDSCs infiltration. The analysis was executed considering the intermediate value of Ly6C+ signal, identifying the neutrophil population as as Ly6Ghigh and Ly6C intermediate/high. (D) Human PBMCs HLA matched with tumor cell lines were pulsed with PeptiCRAd-MAGEA1 (for SM-MEL-2) or PeptiCRAd-MAGEA4 (for MDA-MB-436) in presence of human IL2. After 2 days, the PBMCs were added to target tumor cell lines, in presence or not of anti-PD-L1 antibody. After 5 days cell viability was measured and the percentage of killing was calculated. Results are presented as the mean ± SEM. Statistical significance was calculated with the Student´s t-tests; *p < 0,05.
The combination of PD-L1 blockade and PeptiCRAd boosts anti-tumor efficacy against TNBC by modulating the immunosuppressive tumor microenvironment
In order to further investigate the possible benefits of combining aPD-L1 with the oncolytic vaccine, Balb/c mice were engrafted with 4T1 cells and treated with aPD-L1 monoclonal antibody in combination with the PeptiCRAd coated with MHC-I and II epitopes. As shown in , treatment with PD-L1 blockade only resulted in a response rate of 37.5% of the treated mice. In contrast, 62.5% of mice treated with the PeptiCRAd I+II and aPD-L1 responded to therapy.
Tumors were collected and immunological analyses were performed. Compared to aPD-L1 alone, the co-administration of PeptiCRAd I+II increased the percentage of CD8+ TILs while reducing CD4+ TILs ().
Next, we decided to investigate the immunological environment possibly affecting therapeutic outcomes the strong immunosuppressive TME in 4T1 mammary carcinoma model features the presence of myeloid-derived suppressor cells (MDSCs).Citation2,Citation19-Citation20 Hence, we evaluated the infiltration of tumors by the neutrophilic N-MDSC (Ly6Ghigh and Ly6 C intermediate/high) subtype.Citation19 Tumors treated with PeptiCRAd I+II and + aPD-L1 showed statistically higher neutrophil infiltration compared to control groups ().
Finally, to reproduce the findings in a clinically relevant in vitro model, we stimulated human PBMCs from healthy donors with oncolytic vaccines and co-incubated them with target (tumor) cells to evaluate T-cell mediated killing in the presence or absence of aPD-L1 (details about HLA phenotyping and matching of human samples are available in the material and methods section and in ). The PBMCs were pulsed with PeptiCRAd targeting tumor associated antigens from human melanoma (MAGE A1) or TNBC (MAGE A4).Citation21-Citation23 Interestingly, in both cases we observed a statistically significant difference in the killing ability of PBMCs. In particular, the cytotoxic activity of PBMCs was enhanced in presence of anti-PD-L1 antibody ().
Table 1. HLA genotyping analysis in MDA-MB-436.
In conclusion, our data demonstrates that PeptiCRAd can promote antigen-specific T cell responses which are beneficial for checkpoint inhibition therapy, thus providing a strong rationale for a combinatorial approach.
Discussion
Under physiological conditions, immune checkpoint pathways maintain self-tolerance and help in resolving the inflammation after the clearance of pathogens.Citation24 However, cancer cells use these anti-inflammatory receptors to dysregulate CD8+ and CD4+ T-cells.Citation14,Citation24-Citation25 The infiltration of immune cells within the tumor tissue represents a favourable prognostic factor, as it often reflects an undergoing immune response. Immune-infiltrated tumors are defined as “hot”, while poorly infiltrated tumors are defined as “cold”. The distinction between these two scenarios is becoming more and more important to estimate the risk-to-benefit ratio of expensive therapies such as ICIs. In fact, despite the remarkable results that this class of drugs has achieved in many studies in terms of overall survival, the response rates are still limited. For instance, the phase III clinical study that led to the approval of Ipilimumab registered a response rate of only 10.9% and a disease control rate of 28.5%. Similarly, the PD-1 blocking antibody Nivolumab has been tested in a variety of tumors such as non-small cell lung cancer, melanoma and renal cell carcinoma with response rates ranging from 18 to 27%. Another independent study revealed an encouraging response rate of 51% in patients with advanced melanoma, although only 9% of the patients experienced complete responses.Citation9 The need to increase the response rate to checkpoint inhibition prompted us to study their combination with oncolytic vaccines which are suitable candidates because of their natural immunogenicityCitation26; in addition, the lysis of cancer cells might reveal hidden antigens and enhance their immune presentation.Citation16,Citation27 In 2015, the Food and Drug Administration approved the use of an oncolytic herpes simplex virus (HSV)-1 for the treatment of melanoma.Citation28 Similarly, to this virus, we have previously demonstrated that our oncolytic vaccine platform (i.e. PeptiCRAd) is able to induce potent antigen-specific responses and T-cell infiltration.Citation18 Here we demonstrated that oncolytic vaccines increase the response rate of checkpoint inhibition. We propose a mode of action where the oncolytic vaccine fosters the induction of antigen-specific T-cells while the immune checkpoint inhibitor prevents their dysregulation within the TME. In fact, we observed an increased response rate among melanoma bearing-mice as regards the growth of primary and secondary untreated tumors when receiving a combination of anti-PD-L1 antibody and PeptiCRAd. In fact, their tumors were infiltrated with antigen-specific T-cells with the majority being antigen-experienced but non-exhausted. Interestingly, while subcutaneous injections of PeptiCRAd were able to induce an OVA-specific response, the treatment failed to control the growth of the tumor of mice. We speculate that the sub-cutaneous route is characterized by a decreased ability to modify the TME compared to intra-tumoral administration (as we have previously demonstratedCitation18), hence anti-tumor efficacy is limited. For this reason, non-local oncolytic virotherapy greatly benefits from checkpoint inhibition. In fact, we demonstrated that in absence of modification of TME by intra-tumoral virotherapy, OVA-specific TILs can be protected from exhaustion by blockade of PD-L1 signalling, thus combination of sub-cutaneous oncolytic vaccine and immune checkpoint inhibitors still represents a viable therapeutic option.
We showed that PEI against adenovirus does not impair the response to the combinational therapy, which is an important aspect for patients that received previous treatment with oncolytic vaccines or present PEI to other viral platforms. Similar results have been recently described in a clinical study of Pembrolizumab with T-VEC. Although being characterized by a small sample size, this phase Ib study revealed an impressive 62% response rate in patients with metastatic melanoma. Consistently with our results, the tumors of patients showed an increased infiltration of T-cellsCitation29 that might be caused by the viral treatment.
After the clinical success of checkpoint inhibition against melanoma, several studies suggested their use to treat different types of cancer. However, in these cases there is an even stronger need for T-cell infiltration and an underlying immune response.Citation30 A recent study showed how oncolytic virotherapy helps in overcoming PD-1 resistance by inducing neo-antigen specific T-cells following oncolysis of the tumor tissue.Citation31 Therefore, we investigated if our oncolytic vaccine platform in combination with PD-L1 blockade could be effective against a poorly immunogenic tumor model, such as TNBC. First, we were able to demonstrate the benefit of targeting both CD4 and CD8 epitopes at the same time. This correlates with studies where engagement of the T-helper compartment has been shown to increase the efficacy of cancer vaccine strategies.Citation32-Citation33 Aarntzen and colleagues have demonstrated that combining CD4 and CD8 epitopes improves median progression-free survival of patients with stage III and IV melanoma with detectable antigen-specific responses among skin-infiltrating lymphocytes.Citation34 Similar approaches featured the production of longer peptides including both CD4 and CD8 epitopes. The CD4+ T-helper cells support CTLs by production of IL-2 and they increase the efficacy of antigen presentation by licensing DCs through the CD40/CD40 L pathway.Citation35 We have previously demonstrated that the PeptiCRAd platform increased the maturation of DCs; our data supports the hypothesis that including CD4 epitopes improves the control of tumor growth. Combination of this platform with PD-L1 blockade increased the number of mice responding to checkpoint inhibition from 35%, observed with aPD-L1, up to 62% with combination therapy. We could appreciate that combining checkpoint inhibition with oncolytic vaccines could affect the tumor microenvironment. In particular, we observed an increased number of CD8+ TILs and infiltration by tumor associated neutrophils (TANs). The immunological activity of TANs is currently under investigation,Citation36 however, as shown by Zvi G.Fridlender et collegues they could play a role in the anti-tumor immunity.Citation37
The crosstalk between cancer and immune system plays a pivotal role in the tumor regression or progression.Citation13 The lack of appropriate models prompted us to investigate our strategy in a clinically relevant model. To this end, in according to data from literature,Citation38 we have established an in vitro co-culture system for TNBC and melanoma models with HLA-matched PBMCs: we observed an improved killing ability of oncolytic vaccine-pulsed PBMCs in presence of PD-L1 antibody.
Clinical studies are now focusing on turning cold tumors into hot tumors, hence providing the blockade of immune checkpoints with the immunological support they need. In addition, the engagement of T-helper cells should not be overlooked despite the limited availability of shared CD4 epitopes. However, recent progress in whole exome sequencing, RNAseq and ligandome analysis opens new possibilities for neo-antigen identification. For this reason, highly versatile platforms, such as oncolytic vaccines are suitable for multi-targeted approaches, enabling increased response rates to checkpoint inhibitors in cancer patients.
Materials and methods
Cell lines and reagents
The cell line B16-OVA, a mouse melanoma cell line expressing chicken OVA, was kindly provided by Prof. Richard Vile (Mayo Clinic, Rochester, MN, USA). The human malignant melanoma cell line SK-MEL-2 were purchased from the American Type Culture Collection (ATCC; Manassas, VA, USA). Mouse breast cancer cell line (4T1) and human breast cancer cell line (MDA-MB-436) were purchased from the American Type Culture Collection (ATCC; Manassas, VA, USA) All cell lines were cultured according to ATCC recommendations. The cells were cultured in RPMI-1640 high glucose and DMEM low glucose respectively and supplemented with 10% FBS,1% antibiotics and 1% of L-Glutamine. All cells were grown in 37 °C, 5% CO2 in a humidified atmosphere.
PBMC were purchased from Immune Spot (Bonn, Germany) and HLA matched with SK-MEL2 and MDA-MB-436.
Murine and human interferon γ used in the vitro experiment were purchased from Sigma Aldrich and used both at final concentration of 10 ng/mL. The anti-mouse and anti-human PD-L1 (B7-H1) monoclonal antibody was purchased from Bio X Cell.
The following peptides were used through the study: poly-K-SIINFEKL (KKKKKKSIINFEKL), Tmtc2 (KKKKQGVTVLAVSAVYDIFVFHRLKMKQILP), Wdr11(KKKKKKKKKKNDEPDLDPVQELIYDLRSQCDAIRVTK), Zfr (KKAHIRGAKHQKVVTLHTKLGKPIPSTEP), Adamts9 (KKKKKKKDYTAAGFSSFQKLRLDLTSMQIITTD), Pan HLA-DR reactive epitope (PADRE) (KKKKAKFVAAWTLKAAA), Mageb-1/Mageb-2 (KKKKKKAGTSIQHTLKDPI) and MAGE A4 (KKKKKKKKWVQENYLEY) were purchased from Zhejiang Ontores Biotechnologies Co. (Zhejiang, China)
PBMCs killing assay of target tumor cells
All the PBMCs used in this work were cultured with human IL-2 at a final concentration of 3.3 ng/ml per 0.15 × 10⁶ cells and pulsed with PeptiCRAd as described in the experimental procedure for 2 days. The PBMCs were added to the cells at ratio 10:1 and after 5 days the viability was evaluated by MTS assay in according to the manufacturer´s protocol (CellTiter 96 Aqueous One Solution Cell Proliferation Assay; Promega, Nacka, Sweden). Spectrophotometric data were acquired with Varioskan Flash Multimode Reader (Thermo Scientific, Carlsbad, CA, USA).
Animal experiments and ethical permits
All animal experiments were reviewed and approved by the Experimental Animal Committee of the University of Helsinki and the Provincial Government of Southern Finland (license number ESAVI/9817/04.10.07/2016)
Female BALB/cOlaHsd mice 4–6 weeks old were obtained from Envigo (Harlan, USA) and used as a syngeneic mouse tumor model of breast cancer. 3 × 10⁵ 4T1 cells were injected subcutaneously in the right flank. For the melanoma syngeneic model, we used 4–6 weeks old female C57 BL/6 J mice engrafted subcutaneously with 3 × 10⁵ B16.OVA cells. Details about the schedule of the treatment can be found in the Fig. legends. Viral dose was 1 × 10⁹ vp/tumor complexed with 20 µg of the chosen epitope. Checkpoint inhibitors were give intraperitoneally at a dose of 200 µg/mouse.
Flow Cytometry
The antibodies used are the following: TruStain Fc block anti-mouse and anti-human CD16/32 (BioLegend); FITC anti-mouse CD8 (ProImmune); APC anti-mouse CD4 (BioLegend); PE-anti-mouse and anti-human CD279/PD-1 (BioLegend); PE/Cy7 anti-mouse TIM-3 (BioLegend); Percp/Cy5.5 anti-mouse CD3ϵ (BioLegend); APC anti-mouse H2 Kd (BioLegend); APC anti-mouse I/A-I/E (BioLegend); PE-anti-human and mouse CD274 B7-H1 (PD-L1) (BioLegend); PE anti-human HLA-A, B,C (BioLegend); FITC anti-mouse Cd11b (BD Pharmingen); PE anti-mouse Ly6G (BD Pharmingen); APC anti-mouse Ly6 C (BD Pharmingen). The data were acquired using BD Accuri 6 C plus (BD) or Gallios (Beckmann Coulter) flow cytometers. Data analyzed using FlowJo software v10 (Ashland, Oregon, USA).
Antigen specific CD8+ CD19- T-cells are studied by acquiring between 100000 and 500000 events for each sample. Within the lymphocyte gate we exclude the CD19+ cells and proceed to the identification of the CD8+ and Pentamer+ double positive cells.
PeptiCRAd complex formation
Oncolytic adenovirus and polyK epitope (Ontores, Zhejiang, China) were mixed to prepare the PeptiCRAd complex. We mixed polyK epitope with Ad-5-D24-CpG for 15 minutes at room temperature and after that we use this complex to treat the mice. More details about the stability and formation of the complex can be found in our previous study.Citation18
HLA genotyping and PBMCs samples
The DNA extraction was performed according to the manufacturer´s protocol (QIAamp DNA Mini Kit 50 Qiagen); the HLA-A, B and DRB1 was analysed on high resolution (4digit Sanger´s sequencing) by the Finnish Red Cross. The results of the genotypization can be found in .
Cryopreserved PBMCs were purchased from the cryo-bank available at CTL (Cellular Technology Limited) and were used under the license number ESAVI/9817/04.10.07/2016.
Statistical analysis
Statistical analysis was performed using Graphpad Prism 6.0 software (Graphpad Software Inc., La Jolla, CA USA). For animal experiments, 2way ANOVA with Tukey´s multiple comparisons test was used and P < 0.05 was considered statistically significant. All results are expressed as the mean ± standard error of the mean (SEM). Details about the statistical tests for each experiment can be found in the correspondent Fig. legend.
Disclosure of potential conflicts of interest
No potential conflicts of interest were disclosed.
supp_data.zip
Download Zip (579.4 KB)Acknowledgments
This project was funded by the European Research Council under the H2020/ERC Grant Agreement n. [681219]. Moreover, this research was supported by Helsinki Institute of Life Science (HiLIFE) and Jane and Aatos Erkko foundation.
Finally we thank all our colleagues that provided technical and scientific support.
References
- Loskog A, Ninalga C, Totterman TH. Dendritic cells engineered to express CD40 L continuously produce IL12 and resist negative signals from Tr1/Th3 dominated tumors. Cancer Immunol, Immunother: CII. 2006;55(5):588–97. doi:10.1007/s00262-005-0051-4.
- Youn JI, Nagaraj S, Collazo M, Gabrilovich DI. Subsets of myeloid-derived suppressor cells in tumor-bearing mice. J Immunol. 2008;181(8):5791–802. doi:10.4049/jimmunol.181.8.5791. PMID:18832739.
- Kodumudi KN, Woan K, Gilvary DL, Sahakian E, Wei S, Djeu JY. A novel chemoimmunomodulating property of docetaxel: suppression of myeloid-derived suppressor cells in tumor bearers. Clin Cancer Res. 2010;16(18):4583–94. doi:10.1158/1078-0432.CCR-10-0733. PMID:20702612.
- Chaudhary B, Elkord E, Regulatory T. Cells in the tumor microenvironment and cancer progression: role and therapeutic targeting. Vaccines (Basel). 2016;4(3):28. PMID:27509527
- Smahel M. PD-1/PD-L1 blockade therapy for tumors with Downregulated MHC Class I expression. Int J Mol Sci. 2017;18(6):1331. doi:10.3390/ijms18061331. PMID:28635644
- Zhang L, Gajewski TF, Kline J. PD-1/PD-L1 interactions inhibit antitumor immune responses in a murine acute myeloid leukemia model. Blood. 2009;114(8):1545–52. doi:10.1182/blood-2009-03-206672. PMID:19417208.
- Reiser J, Banerjee A. Effector, memory, and dysfunctional CD8(+) T cell fates in the antitumor immune response. J Immunol Res. 2016;2016:8941260. doi:10.1155/2016/8941260. PMID:27314056.
- Fuertes Marraco SA, Neubert NJ, Verdeil G, Speiser DE. Inhibitory receptors beyond T cell exhaustion. Front Immunol. 2015;6:310. doi:10.3389/fimmu.2015.00310. PMID:26167163.
- Callahan MK, Wolchok JD. At the bedside: CTLA-4- and PD-1-blocking antibodies in cancer immunotherapy. J Leukoc Biol. 2013;94(1):41–53. doi:10.1189/jlb.1212631. PMID:23667165.
- Liu J, Zhang S, Hu Y, Yang Z, Li J, Liu X, Deng L, Wang Y, Zhang X, Jiang T, et al. Targeting PD-1 and Tim-3 pathways to reverse CD8 T-cell exhaustion and enhance Ex Vivo T-cell responses to autologous dendritic/tumor vaccines. J Immunother. 2016;39(4):171–80. doi:10.1097/CJI.0000000000000122. PMID:27070448.
- Zitvogel L, Kroemer G. Targeting PD-1/PD-L1 interactions for cancer immunotherapy. Oncoimmunology. 2012;1(8):1223–5. doi:10.4161/onci.21335. PMID:23243584.
- O'Donnell JS, Long GV, Scolyer RA, Teng MW, Smyth MJ. Resistance to PD1/PDL1 checkpoint inhibition. Cancer Treat Rev. 2017;52:71–81. doi:10.1016/j.ctrv.2016.11.007. PMID:27951441.
- Sharma P, Hu-Lieskovan S, Wargo JA, Ribas A. Primary, adaptive, and acquired resistance to cancer immunotherapy. Cell. 2017;168(4):707–23. doi:10.1016/j.cell.2017.01.017. PMID:28187290.
- Sharma P, Allison JP. Immune checkpoint targeting in cancer therapy: toward combination strategies with curative potential. Cell. 2015;161(2):205–14. doi:10.1016/j.cell.2015.03.030. PMID:25860605.
- Alemany R, Cascallo M. Oncolytic viruses from the perspective of the immune system. Future Microbiol. 2009;4(5):527–36. doi:10.2217/fmb.09.28. PMID:19492964.
- Aurelian L. Oncolytic viruses as immunotherapy: progress and remaining challenges. Onco Targets Ther. 2016;9:2627–37. doi:10.2147/OTT.S63049. PMID:27226725.
- Swart M, Verbrugge I, Beltman JB. Combination approaches with immune-checkpoint blockade in cancer therapy. Front Oncol. 2016;6:233. doi:10.3389/fonc.2016.00233. PMID:27847783.
- Capasso C, Hirvinen M, Garofalo M, Romaniuk D, Kuryk L, Sarvela T, Vitale A, Antopolsky M, Magarkar A, Viitala T, et al. Oncolytic adenoviruses coated with MHC-I tumor epitopes increase the antitumor immunity and efficacy against melanoma. Oncoimmunology. 2016;5(4):e1105429. doi:10.1080/2162402X.2015.1105429. PMID:27141389.
- Ali K, Soond DR, Pineiro R, Hagemann T, Pearce W, Lim EL, Bouabe H, Scudamore CL, Hancox T, Maecker H, et al. Inactivation of PI(3)K p110delta breaks regulatory T-cell-mediated immune tolerance to cancer. Nature. 2014;510(7505):407–11. doi:10.1038/nature13444. PMID:24919154.
- Bunt SK, Sinha P, Clements VK, Leips J, Ostrand-Rosenberg S. Inflammation induces myeloid-derived suppressor cells that facilitate tumor progression. J Immunol. 2006;176(1):284–90. doi:10.4049/jimmunol.176.1.284. PMID:16365420.
- Cabezon T, Gromova I, Gromov P, Serizawa R, Timmermans Wielenga V, Kroman N, Celis JE, Moreira JM. Proteomic profiling of triple-negative breast carcinomas in combination with a three-tier orthogonal technology approach identifies Mage-A4 as potential therapeutic target in estrogen receptor negative breast cancer. Mol Cell Proteomics. 2013;12(2):381–94. doi:10.1074/mcp.M112.019786. PMID:23172894.
- Mathe A, Wong-Brown M, Morten B, Forbes JF, Braye SG, Avery-Kiejda KA, Scott RJ. Novel genes associated with lymph node metastasis in triple negative breast cancer. Sci Rep. 2015;5:15832. doi:10.1038/srep15832. PMID:26537449.
- Stagg J, Allard B. Immunotherapeutic approaches in triple-negative breast cancer: latest research and clinical prospects. Ther Adv Med Oncol. 2013;5(3):169–81. doi:10.1177/1758834012475152. PMID:23634195.
- Pardoll DM. The blockade of immune checkpoints in cancer immunotherapy. Nat Rev Cancer. 2012;12(4):252–64. doi:10.1038/nrc3239. PMID:22437870.
- Sharma P, Allison JP. The future of immune checkpoint therapy. Science. 2015;348(6230):56–61. doi:10.1126/science.aaa8172. PMID:25838373.
- Kohlhapp FJ, Kaufman HL, Molecular pathways: mechanism of action for Talimogene Laherparepvec, a new oncolytic virus immunotherapy. Clin Cancer Res. 2016;22(5):1048–54. doi:10.1158/1078-0432.CCR-15-2667. PMID:26719429
- Andtbacka RH, Kaufman HL, Collichio F, Amatruda T, Senzer N, Chesney J, Delman KA, Spitler LE, Puzanov I, Agarwala SS, et al. Talimogene Laherparepvec improves durable response rate in patients with advanced melanoma. J Clin Oncol. 2015;33(25):2780–8. doi:10.1200/JCO.2014.58.3377. PMID:26014293.
- Rehman H, Silk AW, Kane MP, Kaufman HL. Into the clinic: Talimogene laherparepvec (T-VEC), a first-in-class intratumoral oncolytic viral therapy. J Immunother Cancer. 2016;4:53. doi:10.1186/s40425-016-0158-5. PMID:27660707.
- Haanen J. Converting cold into hot tumors by combining immunotherapies. Cell. 2017;170(6):1055–6. doi:10.1016/j.cell.2017.08.031. PMID:28886376.
- Galon J, Fox BA, Bifulco CB, Masucci G, Rau T, Botti G, Marincola FM, Ciliberto G, Pages F, Ascierto PA, et al. Immunoscore and Immunoprofiling in cancer: an update from the melanoma and immunotherapy bridge 2015. J Transl Med. 2016;14:273. doi:10.1186/s12967-016-1029-z. PMID:27650038.
- Woller N, Gurlevik E, Fleischmann-Mundt B, Schumacher A, Knocke S, Kloos AM, Saborowski M, Geffers R, Manns MP, Wirth TC, et al. Viral infection of tumors overcomes resistance to PD-1-Immunotherapy by Broadening Neoantigenome-directed T-cell responses. Mol Ther. 2015;23(10):1630–40. doi:10.1038/mt.2015.115. PMID:26112079.
- Cho HI, Celis E. Design of immunogenic and effective multi-epitope DNA vaccines for melanoma. Cancer Immunol Immunother: CII. 2012;61(3):343–51. doi:10.1007/s00262-011-1110-7.
- Galaine J, Borg C, Godet Y, Adotevi O, Interest of Tumor-specific CD4 T Helper 1 cells for therapeutic anticancer vaccine. Vaccines (Basel). 2015;3(3):490–502. doi:10.3390/vaccines3030490. PMID:26350591.
- Aarntzen EH, De Vries IJ, Lesterhuis WJ, Schuurhuis D, Jacobs JF, Bol K, Schreibelt G, Mus R, De Wilt JH, Haanen JB, et al. Targeting CD4(+) T-helper cells improves the induction of antitumor responses in dendritic cell-based vaccination. Cancer Res. 2013;73(1):19–29. doi:10.1158/0008-5472.CAN-12-1127. PMID:23087058.
- Melief CJ, van der Burg SH. Immunotherapy of established (pre)malignant disease by synthetic long peptide vaccines. Nat Rev Cancer. 2008;8(5):351–60. doi:10.1038/nrc2373. PMID:18418403.
- Mantovani A. The yin-yang of tumor-associated neutrophils. Cancer Cell. 2009;16(3):173–4. doi:10.1016/j.ccr.2009.08.014. PMID:19732714.
- Fridlender ZG, Sun J, Kim S, Kapoor V, Cheng G, Ling L, Worthen GS, Albelda SM. Polarization of tumor-associated neutrophil phenotype by TGF-beta: “N1” versus “N2” TAN. Cancer Cell. 2009;16(3):183–94. doi:10.1016/j.ccr.2009.06.017. PMID:19732719.
- Van Voorhis WC, Coculture of human peripheral blood mononuclear cells with Trypanosoma cruzi leads to proliferation of lymphocytes and cytokine production. J Immunol. 1992;148(1):239–48. PMID:1727869.