
ABSTRACT
Epithelial ovarian cancer (EOC) may cause abnormal blood levels of leukocytes. This paraneoplastic manifestation is associated with a worse response to therapy and shorter survival. To understand the complexity and nature of these leukocytes, we dissected the different populations of myeloid cells and analyzed their relation to clinical outcome. Therefore, baseline blood samples of 36 EOC patients treated either with carboplatin/doxorubucin or with gemcitabine were analyzed for different subsets of monocytes/macrophages, myeloid derived suppressor cells (MDSC) and dendritic cells (DC) using multiparameter flow cytometry as well as functional assays for myeloid cell mediated suppression of antigen-specific T cell reactivity. Healthy donor blood served as control. EOC patients displayed an increase in monocytes/macrophages, monocytic MDSC (mMDSC) and CD33-CD11b+CD14-CD15- double-negative MDSC (CD33- dnMDSC) and a decrease in the frequency of DC, across all EOC subtypes. A low frequency of DC and high frequencies of monocytes/macrophages and mMDSC, but not CD33- dnMDSC, were associated with poor overall survival. Patient's monocytes/macrophages and mMDSC, but not CD33- dnMDSC, were shown to suppress T cell reactivity in vitro. The mMDSC and DC frequencies were not altered upon treatment. Importantly, the mMDSC to DC ratio was the strongest independent, highly sensitive and specific, predictive factor for survival. This was irrespective of the type of chemotherapy or disease stage and outperformed classical parameters as WHO status or time from last chemotherapy. Thus, the baseline blood mMDSC to DC ratio is a robust, independent and easy to analyze predictive factor for EOC survival, and may assist patient selection for immunotherapy.
Introduction
Epithelial ovarian, fallopian tube and primary peritoneal cancer (EOC) has a very dismal prognosis with a 5-year survival rate of only 30 to 35%.Citation1-Citation3 Generally, treatment of high risk EOC is based on surgery and platinum-based chemotherapy.Citation3 Although the initial response to treatment is good, the large majority of patients will develop recurrent disease. Recurrent EOC will become platinum-resistant at one point during treatment, and subsequent therapies then consist of single agent chemotherapy like weekly paclitaxel, gemcitabine or experimental therapies such as immunotherapy. Early results show that only a fraction (about 15%) of treated patients clinically respond to immunotherapy.Citation4,Citation5 However, once an anti-tumor response is activated, this correlates with better survival.Citation6-Citation9 An important part of the battle between tumor cells and the immune system is fought within, but not confined to, the tumor microenvironment. CD8+ T cell infiltration into EOC has a positive effect on chemotherapy response,Citation7,Citation8 while infiltration with suppressive immune cells such as regulatory T cells (Tregs), myeloid derived suppressor cells (MDSC) and M2 macrophages is associated with a lower response to chemotherapy in EOC.Citation10-Citation13 In addition, a strong influx of MDSC in ascites is associated with poor survival.Citation14 Furthermore, EOC causes systemic suppression of CD8+ T cell reactivityCitation15 and abnormal high levels of leukocytes (i.e. leukocytosis) in the blood.Citation16,Citation17 The latter has been associated with worse response to therapy in different types of tumors, including EOC.Citation16-Citation20 These observations sustain the notion that the efficacy of several types of chemotherapy may depend on cells of the immune system,Citation21 many of which are also important for the success of immunotherapy.Citation22
The peripheral blood leukocyte population is a complex mixture of different types of myeloid cells, including several phenotypically distinct subpopulations of monocytes/macrophages, MDSC and DC, which can have opposite effects on the anti-tumor response. Comprehensive analyses of these cells in the peripheral blood allows for the distinction of at least six DC types,Citation23 10 potential MDSC types and over five flavors of monocytes/macrophages.Citation24-Citation26
In order to understand why and which of the circulating myeloid cells in EOC patients are related to survival, we dissected the different populations of circulating myeloid cells by flow cytometry using several sets of fluorescently labeled antibodies to identify monocytes/macrophages, MDSC and DC subsets and analyzed their relation to clinical outcome in two individual cohorts of EOC patients treated with different types of chemotherapy. We found that the ratio between mMDSC and DC was a strong prognostic factor for survival, independent of the stage, WHO performance status and chemotherapy provided, and displayed a sensitivity of 85.7% and a specificity of 87.5% to correctly predict survival.
Results
Increased frequencies of circulating myeloid cells are associated with poor survival after therapy in EOC
To validate the observation that advanced-stage EOC patients exhibit high frequencies of circulating myeloid cells, peripheral blood samples of EOC patients that participated in two different phase I/II chemo-immunotherapy studies were analyzed.Citation24,Citation25 One group received standard carboplatin (CP) + doxorubicin (DOX) in combination with tocilizumab and IFNα-2b, the other received gemcitabin of which some additonally received IFNα-2b and a p53 SLP vaccine. The given experimental immune therapies did not impact the clinical outcome.Citation24,Citation25 Compared to healthy donors, platinum–sensitive and –resistant EOC patients exhibited increased frequencies of circulating myeloid cells (, ). Moreover, the group of patients displaying relatively high frequencies of these circulating myeloid cells demonstrated a reduced overall survival (OS) ( and Suppl. Table III). In vitro depletion of the CD14+ fraction in this population of circulating myeloid cells in the PBMC of two patients, resulted in an increased T cell reactivity to recall antigens, p53 and/or NY-ESO-1 tumor antigens (). Taken together, these data suggest a possible immune suppressive role for part of the myeloid cells.
Figure 1. High levels of circulating myeloid cells are associated with reduced overall survival and suppression of anti-tumor immune responses in EOC. Baseline frequency of myeloid cells was determined in platinum-sensitive and –resistant Epithelial Ovarian Cancer (EOC) patients by flow cytometry. A) Representative dot plot of the forward and sideward scatter of PBMC of an EOC patient. Total myeloid cells were identified on the basis of their FSC-A and SSC-A properties. B) The frequency of total myeloid cells as percentage of total viable cells is depicted for healthy donors, platinum–sensitive and –resistant EOC at baseline. The dotted line marks the median myeloid cell frequency of the total EOC patient group. Differences between healthy donors and patients were analyzed by two-sided Kruskal–Wallis test with a post hoc Dunn's multiple comparison test. C) Kaplan-Meier plot showing the survival of a cohort of 36 EOC patients. Patients were divided into low or high groups according to the median myeloid cell frequency of the total EOC patient population.The solid line depicts patients with frequency of the population above the median (high) and the dotted line depicts patients with frequency below the median (low) of the total EOC group. Statistical significance of the survival distribution was analyzed by log-rank testing. Differences were considered significant when p < 0.05, as indicated with an asterisk (*p < 0.05, **p < 0.01, ***p < 0.001 and ****p < 0.0001). D) To test the influence of high baseline myeloid cells on T cell reactivity towards recall and/or tumor antigens, the PBMC of two EOC patients with high levels (i.e. 38.6 and 41.0%) of circulating myeloid cells were selected and analyzed for recall antigen (Influenza virus and memory response mix (FLU/MRM)), p53 and NY-ESO-1 antigen reactivity. To this end, non-depleted (white bars) and CD14-depleted (black bars) PBMC were stimulated for 11 days with autologous monocytes pulsed with a mix of FLU synthetic long peptides (SLP) and MRM or a pool of p53 or NY-ESO-1 SLP, after which antigen reactivity was determined in a 4-day proliferation assay. The proliferation of T cells upon recognition of tumor or recall antigens is shown as stimulation index (SI). A positive response was defined as a SI of at least 3.
High frequencies of circulating monocytic MDSC and low frequencies of circulating DC are associated with poor outcome in EOC
To get insight into the composition and role of the different myeloid subsets in relation to survival, an in-depth analysis of the circulating myeloid cell compartment was performed by flow cytometry. Compared to the frequencies found in healthy donors, the baseline frequencies of circulating monocytes/macrophages and mMDSC were elevated while that of DC were reduced in both the platinum–sensitive and –resistant EOC cohorts (). Notably, the frequencies of these immune cells, except for the CD33- dnMDSC, were not changed upon chemo-immunotherapy ( and described earlierCitation24,Citation25). Importantly, the presence of high frequencies monocytes/macrophages and mMDSC as well as low frequencies of DC in the blood of EOC patients before therapy were associated with reduced survival ( and Suppl. Table III) after chemo-immunotherapy. Subgroup analysis revealed that the association between high levels of monocytes/macrophages and mMDSC and reduced survival was stronger in the platinum-sensitive than in platinum-resistant EOC. Vice versa, low levels of DC correlated stronger with reduced survival in the platinum-resistant EOC cohort (Suppl. ). The levels of CD33+CD11b+ early-stage MDSC (CD33+ eMDSC) and CD33- dnMDSC were similar between healthy donors and EOC patients, and were not associated with survival ( and ).
Figure 2. High frequencies of circulating monocytic MDSC and low frequencies of circulating DC are associated with poor outcome in EOC. An in-depth analysis of the circulating myeloid cell compartment was performed in EOC at baseline. To this end, PBMC samples of healthy donors and platinum–sensitive and –resistant EOC patients were analyzed by multi-parameter flow cytometry for the presence of CD3-CD19-CD56-HLA-DR+CD14+CD11b+ total monocytes/macrophages, CD3-CD19-CD56-HLA-DR+CD14-CD11 c+ DC, CD3-CD19-CD56-HLA-DR−/lowCD14+CD15- monocytic MDSC (mMDSC), CD3-CD19-CD56-HLA-DR−/lowCD14-CD15- and CD33+CD11b+ early-stage MDSC (CD33+ eMDSC) and CD3-CD19-CD56-HLA-DR−/low and CD14-CD15- double-negative (dn) CD33-CD11b+ MDSC (CD33- dnMDSC). A) The frequencies of total monocytes/macrophages (mon/mac), DC, mMDSC, CD33+ eMDSC and CD33- dnMDSC (from top to bottom) are depicted as percentage of total viable cells for healthy donors (left), platinum–sensitive (middle) and –resistant (right) EOC patients at baseline. The dotted line marks the median frequency of the total EOC patient group. Differences between healthy donors and patients were analyzed by two-sided Kruskal–Wallis test with a post hoc Dunn's multiple comparison test. Differences were considered significant when p < 0.05, as indicated with an asterisk (*p < 0.05, **p < 0.01, *** p < 0.001 and **** p < 0.0001). B) Kaplan-Meier plots showing the survival of a cohort of 36 EOC patients. Patients were divided into low or high groups according to the median frequency of the designated myeloid cell subpopulations for the total EOC patient population. The solid line depicts patients with frequency of the population above the median and the dotted line depicts patients with frequency below the median of the total EOC group. Statistical significance of the survival distribution was analyzed by log-rank testing.
Figure 3. Treatment-induced changes were only observed in CD33- dnMDSC for gemcitabine-treated EOC patients. PBMC samples of EOC patients were analyzed at baseline (before), and during (three cycles of carboplatin/doxorubicin and tocilizumab with or without IFNα-2b for platinum sensitive (left panel) and two cycles of gemcitabin and IFNα-2b with or without p53 synthetic long peptide (SLP) vaccine for platinum-resistant EOC (right panel)) and after (six cycles of therapy) by multi-parameter flow cytometry for the presence of CD3-CD19-CD56-HLA-DR+CD14+CD11b+ total monocytes/macrophages (mon/mac), CD3-CD19-CD56-HLA-DR+CD14-CD11 c+ DC, CD3-CD19-CD56-HLA-DR−/lowCD14+ CD15- monocytic MDSC (mMDSC) and CD3-CD19-CD56-HLA-DR−/lowCD14-CD15- and CD33+CD11b+ early-stage MDSC (CD33+ eMDSC) and CD3-CD19-CD56-HLA-DR−/low and CD14-CD15- double-negative (dn) CD33-CD11b+ MDSC (CD33- dnMDSC). The frequencies of total mon/mac, DC, mMDSC, CD33+ eMDSC and CD33- dnMDSC (from top to bottom) over time are depicted as percentage of total viable cells for platinum–sensitive (left) and –resistant (right) EOC patients. Differences between time points were analyzed by two-sided Kruskal–Wallis test with a post hoc Dunn's multiple comparison test. Differences were considered significant when p < 0.05, as indicated with an asterisk (*p < 0.05, **p < 0.01, *** p < 0.001 and **** p < 0.0001).
Figure 4. Monocytic MDSC and CD33+ eMDSC but not CD33- dnMDSC are capable of suppressing responder T cell proliferation. CD4+CD25+CD127−/low regulatory T cells (Tregs), CD3-CD19-CD56-HLA-DR−/low and CD14+CD15- monocytic MDSC (mMDSC), CD3-CD19-CD56-HLA-DR−/lowCD14-CD15- and CD33+CD11b+ early-stage MDSC (CD33+ eMDSC) and CD3-CD19-CD56-HLA-DR−/low and CD14-CD15- double-negative (dn) CD33-CD11b+ MDSC (CD33- dnMDSC) were isolated from the PBMC of five (three platinum-sensitive and two platinum-resistant) EOC patients by flow sorting and analyzed for their capacity to inhibit autologous responder T cell (Tresp) proliferation in a [3 H]-Thymidine-based ex vivo co-culture suppression assay. A) Proliferation is given in counts per minute (cpm) for un-stimulated and anti-CD3/CD28 bead-stimulated autologous CD4+CD25+/-CD127+ Tresp cells in the presence or absence of isolated suppressor cells at a 1:1 to 32:1 Tresp-to-suppressor ratio for a representative patient. Differences in proliferation were analyzed by two-sided Kruskal–Wallis test with a post hoc Dunn's multiple comparison test. Differences were considered significant when p < 0.05, as indicated with an asterisk (*p < 0.05, **p < 0.01, *** p < 0.001 and **** p < 0.0001). B) Percentage inhibition ± SEM of responder cell proliferation by Tregs (black circles), mMDSC (dark grey squares), CD33+ eMDSC (light grey triangles) and CD33- dnMDSC (white diamonds) at different Tresp-to-suppressor ratios is depicted for five EOC patients.
![Figure 4. Monocytic MDSC and CD33+ eMDSC but not CD33- dnMDSC are capable of suppressing responder T cell proliferation. CD4+CD25+CD127−/low regulatory T cells (Tregs), CD3-CD19-CD56-HLA-DR−/low and CD14+CD15- monocytic MDSC (mMDSC), CD3-CD19-CD56-HLA-DR−/lowCD14-CD15- and CD33+CD11b+ early-stage MDSC (CD33+ eMDSC) and CD3-CD19-CD56-HLA-DR−/low and CD14-CD15- double-negative (dn) CD33-CD11b+ MDSC (CD33- dnMDSC) were isolated from the PBMC of five (three platinum-sensitive and two platinum-resistant) EOC patients by flow sorting and analyzed for their capacity to inhibit autologous responder T cell (Tresp) proliferation in a [3 H]-Thymidine-based ex vivo co-culture suppression assay. A) Proliferation is given in counts per minute (cpm) for un-stimulated and anti-CD3/CD28 bead-stimulated autologous CD4+CD25+/-CD127+ Tresp cells in the presence or absence of isolated suppressor cells at a 1:1 to 32:1 Tresp-to-suppressor ratio for a representative patient. Differences in proliferation were analyzed by two-sided Kruskal–Wallis test with a post hoc Dunn's multiple comparison test. Differences were considered significant when p < 0.05, as indicated with an asterisk (*p < 0.05, **p < 0.01, *** p < 0.001 and **** p < 0.0001). B) Percentage inhibition ± SEM of responder cell proliferation by Tregs (black circles), mMDSC (dark grey squares), CD33+ eMDSC (light grey triangles) and CD33- dnMDSC (white diamonds) at different Tresp-to-suppressor ratios is depicted for five EOC patients.](/cms/asset/71b31fc8-df8e-4759-9ca8-396e28724cbd/koni_a_1465166_f0004_b.gif)
Monocytic MDSC but not CD33- dnMDSC are capable of suppressing T cell proliferation
MDSC represent a heterogenous population of immune cells that can suppress anti-tumor immunity. Due to the absence of a highly specific marker to identify human MDSC, a multitude of MDSC subsets with different phenotypes and (sometimes) unknown suppressive potential have been described in literature.Citation20 To substantiate our findings on the role of mMDSC, CD33+ eMDSC and CD33- dnMDSC in EOC survival, we tested the suppressive function of mMDSC, CD33+ eMDSC and CD33- dnMDSC obtained from five EOC patients in a [3 H]-Thymidine-based ex vivo co-culture suppression assay. As a positive suppressive control, isolated autologous CD25+CD127−/low Tregs were included in this assay.Citation27 These tests revealed that circulating mMDSC were as effective as Tregs in suppressing responder T cell proliferation ( and , Suppl. for all five EOC patients). The suppressive capacity of CD33+ eMDSC was much lower while CD33- dnMDSC did not show the capacity to suppress T cell proliferation in this assay. This indicates that mMDSC and CD33+ eMDSC but not CD33- dnMDSC represent bona fide MDSC.
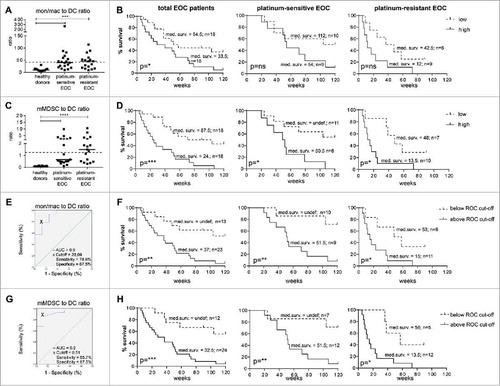
Figure 5. The pre-treatment circulating mMDSC to DC ratio is an independent predictive factor for patient survival that is relevant beyond type of chemotherapy or disease stage. Monocyte/macrophage (mon/mac) to DC (A) and mMDSC to DC (C) was calculated by dividing the mon/mac or mMDSC value by the DC value measured at baseline. A, C) The mon/mac to DC (A) and mMDSC to DC (C) ratios are depicted for healthy donors, and platinum–sensitive and –resistant EOC at baseline. The dotted line marks the median ratio of the total EOC patient group. B, D) Kaplan-Meier plots showing the survival of the total cohort of EOC patients (left), and the individual cohorts of platinum–sensitive (middle) and –resistant (right) EOC patients are given for the mon/mac to DC (B) and mMDSC to DC (D) ratio. Patients were divided into low or high groups according to the median of the total EOC patient population. The solid lines depicts patients with frequency of the population above the median (high) and the dotted line depicts patients with frequency below the median (low) of the total EOC group. E, G) Optimal cut-off point for the mon/mac to DC (E) and mMDSC to DC (G) ratios by ROC curve analysis is depicted. The black cross depicts the optimal cut-off point with respect to sensitivity and specificity. F, H) Kaplan-Meier plots showing the survival of the total cohort of EOC patients (left), and the individual cohorts of platinum–sensitive (middle) and –resistant (right) EOC patients are given for the optimized mon/mac to DC (F) and mMDSC to DC (H) cut-offs. The solid lines depicts patients with frequency of the population above the ROC cut-off and the dotted line depicts patients with frequency below the ROC cut-off. Statistical significance of the survival distributions were analyzed by log-rank testing. The number of patients and the corresponding median survival for each group is given in the plots.
Circulating HLA-DR+CD14-CD11c+ cells represent a collection of conventional DC
DC are profesional antigen presenting cells (APC) that are found in blood, lymph nodes and tissues and play an important role in processing and presenting antigen to T cells and thus regulating innate and adaptive immune responses. In the blood, human DC include lineage-negative (LIN-) HLA-DR+CD14-CD11c-CD123+ plasmacytoid DC and LIN-HLA-DR+CD14-CD11c+ conventional DC subsets, of which the latter can be subdivided into four different DC subsets (DC1 to DC4) based on the additional markers CLEC9A, CD141, CD1c, CD16, CD36, CD32b and CD163.Citation23,Citation28 Blood analysis of six EOC patients and four healthy donors revealed that the HLA-DR+CD14-CD11c+ DC subset was mainly composed of CD141+CLEC9A+ DC1, CD1c+CD32b+ DC2, CD1 c+CD32b-CD36+CD163+ DC3 and CD1c-CD16+ DC4 subsets (Suppl. ) and that there were no overt differences with respect to the frequencies of each subtype within the total population between healthy donors and EOC patients. Our data, thus, confirmed that the LIN-HLA-DR+CD14-CD11c+ DC subset represents a collection of truly circulating blood DC, which is lowered in overall numbers but not altered in complexity in patients with EOC compared to healthy individuals.
The mMDSC to DC ratio is an independent predictive factor for patient survival
While DC generally stimulate tumor immunity, MDSC and some types of monocytes/macrophages can exert suppressive activity and dampen immune responses. To determine whether the balance between these cell types is relevant for survival in these cohorts, we determined their ratios. Compared to ratios found in healthy donors, the baseline monocytes/macrophages to DC and mMDSC to DC ratios were elevated in a number of EOC patients in both cohorts (). Notably, CP/DOX/tocilizumab/IFNα-2b or gemcitabin/IFNα-2b/p53 SLP chemo-immunotherapy did not alter these ratios (Suppl. Fig. 6). Division of the patients on the basis of the median ratio revealed that the group of patients with a low monocytes/macrophages to DC ratio and especially the patients with a low mMDSC to DC ratio (i.e. with suppressing cells << activating cells) displayed a significantly better survival ( and ). Interestingly, EOC patients with detectable T cell reactivity to recall antigens at baseline always displayed a low monocytes/macrophages to DC and mMDSC to DC ratios (Suppl. Fig. 7). Furthermore, the predictive value of the mMDSC to DC ratio was not limited to one of the individual cohorts, suggesting that this ratio is an important predictor of disease outcome relevant beyond type of chemotherapy or disease stage. Indeed, correcting for age, WHO performance status and time from last chemotherapy using multivariate Cox regression analysis revealed that both the monocytes/macrophages to DC and mMDSC to DC ratio were independent factors for EOC survival ().
Table 1. Univariate and multivariate analysis of monocytes/macrophages to DC and mMDSC to DC ratio.
In order to optimize the predictive values of these immune cell ratios for disease outcome, we sought to find an optimal cut-off point with respect to sensitivity and specificity by ROC curve analysis. This not only led to a cut-off point for the monocytes/macrophages to DC ratio associated with much better separation of the survival curves in both the individual patient cohorts ( and ) but also to a highly sensitive (85.7%) and specific (87.5%) cut-off for the mMDSC to DC ratio yielding a very strong correlation with survival for the total population and individual patient cohorts ( and ).
In summary, the pre-treatment circulating mMDSC to DC ratio is a robust, easy to analyze (Suppl. Fig. 8) and independent predictive factor for patient survival beyond the type of chemotherapy.
Discussion
In this study, the composition of circulating myeloid cells and its relation to clinical outcome was analyzed in two cohorts of patients treated for platinum-sensitive and platinum-resistant EOC. In comparison to healthy donors, many of the patients with advanced EOC displayed an increased frequency of myeloid cells, comprising monocytes/macrophages and mMDSC with the capacity to suppress T cell reactivity in vitro. In contrast to these immune suppressive myeloid cells, our in-depth analysis also revealed that the frequency of circulating DC, regardless of subtype, was often lower in patients with EOC than in healthy donors. Importantly, the balance between immune suppressive myeloid cells (monocytes/macrophages and mMDSC) and immune activating cells (DC) was an important parameter for overall survival. Patients with a low monocytes/macrophages to DC or mMDSC to DC ratio displayed a significantly better overall survival. Especially, the ratio between mMDSC and DC not only formed a strong independent prognostic factor for survival, but could also predict survival with very high sensitivity and specificity.
We found that abnormal high levels of circulating myeloid cells is a prognostic sign for poor survival. The exact mechanism behind this hematologic paraneoplastic manifestation is unclear but is most likely caused by tumor-produced hematopoietic cytokines (e.g. GM-CSF, G-CSF, IL-6, PGE2)Citation13,Citation29 that are known to mobilize and expand MDSC and macrophages from the bone marrow.Citation30 In line with our previous studies in lung and cervical cancer,Citation26,Citation31 these myeloid cells are suppressive since in vitro depletion unleashed T cell reactivity to recall antigens and tumor antigens. This may explain why leukocytosis is negatively associated with overall survival in our and other studies.Citation16-Citation20 Recent studies by us and others on the effects of chemotherapy on leukocytes revealed that carboplatin-paclitaxel can transiently normalize these abnormal levels of leukocytes and that this is associated with stronger T cell immunity.Citation25,Citation26,Citation32 In our platinum-sensitive EOC cohort, patients received a combination of carboplatin and doxorubicine, and this did not have a long term effect on the levels of the different leukocytes.Citation24 However, due to the timing of blood sampling we can not exclude that transient effects were present.Citation26 The platinum-resistant EOC cohort had been treated with gemcitabine. This chemotherapeuticum has been shown to eliminate MDSC in mice.Citation33 Recently, we showed that gemcitabine eliminated the phenotypically defined HLA-DR-CD33-CD11b+CD14-CD15- MDSC (CD33- dnMDSC) in patients with advanced EOC.Citation25 Here, we functionally tested three types of phenotypically defined MDSC and showed that mMDSC displayed a high capacity to suppress activated T cells in our in vitro set-up, whereas the putative CD33- dnMDSC in fact did not. This shows the importance of functional assessments of myeloid cell types and explains why deletion of CD33- dnMDSC by gemcitabine did not have an impact on the survival. Interestingly, docetaxel has also been reported to eliminate MDSC in miceCitation34 and the change in mMDSC from baseline to the third treatment cycle was prognostic for survival in metastatic castration-resistant prostate cancer,Citation35 suggesting that docetaxel may eliminate the right MDSC type in patients, albeit that this chemotherapy is not frequently used in patients with EOC.
Despite the increase in myeloid cells, many of the patients with advanced EOC displayed a decreased frequency of DC and this had a negative impact on the prognosis of patients. It is possible that this is a direct consequence of the cancer-mediated altered myelopoiesis but it could also be the outcome of a PGE2-driven redirected differentiation of DC to mMDSC.Citation36 DC are an important component of the EOC microenvironment of patients with better survival,Citation37 hence therapeutic approaches to normalize their levels are warranted. Potentially, targeting PGE2 may be of help.Citation29
An important question is whether a blood biomarker reflects what is going on in the tumor microenvironment. It has been reported that peripheral leukocytosis correlated with higher numbers of intratumoral neutrophils and lower numbers of intratumoral CD8+ T cells, and worse clinical outcome after chemotherapy in anal cancer,Citation38 suggesting that similar findings can be expected for ovarian cancer. Notwithstanding their relation with the tumor microenvironment, the ratio between mMDSC and DC can predict survival with high specificity and sensitivity.
Determination of this ratio might help to assess the potential benefit from current immunotherapies, since MDSC and DC, respectively play important negative and positive roles in immunotherapy,Citation22 including checkpoint therapies.Citation39-Citation42
Materials and methods
Patients
Peripheral blood samples were previously obtained from healthy donors or EOC patients treated within the PITCH and CHIP study after signed informed consent.Citation24,Citation25 The PITCH study is a multicenter phase I/II dose-escalation study to evaluate the safety and feasibility of tocilizumab in combination with carboplatin/doxorubicin (CP/DOX) and interferon-α 2b in patients with recurrent EOC.Citation24 The CHIP study is a phase I/II study to evaluate the feasibility and immunogenicity of the combination of gemcitabine and interferon-α 2b with or without a p53 synthetic long peptide (p53 SLP) vaccine in patients with recurrent platinum-resistant p53-positive EOC.Citation25 Patients that participated in the PITCH and CHIP study are hereafter referred to as platinum-sensitive and platinum-resistant EOC, respectively. Both studies were conducted in accordance with the Declaration of Helsinki and approved by the Medical Ethics Committee Leiden in agreement with the Dutch law for medical research involving humans and registered to the clinical trial register (PITCH study: NCT01637532 and CHIP study: NTC01639885). Patient selection and characteristics, as well as feasibility and safety of the studies, have been described previously.Citation24,Citation25 A summary of the patient characteristics and outcome are given in suppl. .
Isolation of peripheral blood mononuclear cells
PBMC were isolated from venous blood samples by density gradient centrifugation using Ficoll-amidotrizoate (LUMC pharmacy, The Netherlands), cryopreserved in 90% fetal calf serum (FCS; PAA Laboratories, Austria) and 10% DMSO (Sigma-Aldrich, USA), and stored in the vapor phase of liquid nitrogen until further use as described earlier.Citation24,Citation25 Handling, storing and staining of the PBMC were done according to the standard operation procedures (SOP) of the department of Medical Oncology at the LUMC by trained personnel.
Myeloid cell depletion and antigen reactivity testing of PBMC in vitro
To test the association between increased circulating myeloid cells and reduced T cell reactivity towards recall and/or tumor antigens, CD14+ monocytes were depleted from two platinum-sensitive EOC patients with high baseline monocyte counts by CD14-guided magnetic cell sorting (Miltenyi Biotec, Germany) as described earlier.Citation26,Citation31 CD14-depleted and non-depleted PBMC were subsequently cultured for 11 days with autologous monocytes loaded with either a mix of 30 amino acid long and overlapping influenza virus M1 (FLU) synthetic long peptides (SLP) and memory response mix (MRM)Citation43 or a mix of 30 amino acid long and overlapping p53 or NY-ESO-1 SLP in IMDM medium (Lonza, Switzerland) supplemented with 10% human AB serum (Capricorn scientific, Germany), 100 U/ml penicillin, 100 μg/ml streptomycin and 2 mM L-glutamin (all from PAA laboratories, Austria) in the presence of 10% T cell Growth Factor (Zeptometrix, USA) and 5 ng/ml IL-7 and IL-15 (Peprotech, USA). After 11 days, the cells were tested for antigen reactivity in triplicate wells in a 4-day proliferation assay following re-stimulation with either unloaded (control) or pulsed (FLU/MRM, p53 or NY-ESO-1) monocytes. Proliferation was measured by [3 H]-Thymidine incorporation (0.5 µCi/well; Perkin Elmer, USA) during the last 16 hours of the assay and expressed as radioactive counts per minute (cpm). A positive response was defined as a stimulation index (SI; cpm tested wells divided by cmp negative control wells) of at least 3.
Recall antigen reactivity for all EOC patients at baseline was previously tested ex vivo by lymphocyte stimulation test or IFNγ ELISPOT assay.Citation24,Citation25
Phenotyping of PBMC
Immunophenotyping of the PBMC to identify monocytes/macrophages and MDSC by multi-parameter flow cytometry was previously performed.Citation24,Citation25 The monocytes/macrophages set consisted of CD3, CD1a, CD11b, CD11c, CD14, CD16, CD19, CD45, HLA-DR, CD163, CD206 and the live/dead marker yellow amine reactive dye. The MDSC set consisted of the live/dead marker yellow amine reactive dye, CD3, CD19, CD45, HLA-DR, CD11b, CD14, CD15, CD33, CD34 and CD124.
To characterize peripheral blood DC subsets a novel antibody panel was established that could identify four different conventional peripheral blood DC subsets. The latter was based on a publication by Villani and co-workersCitation23 and consisted of the following markers: the live/dead marker yellow amine reactive dye, CD11b-AF488 (clone ICRF44), CD16-PE-CF594 (clone 3G8), CD14-PE-Cy7 (clone M5E2), HLA-DR-V500 (clone L243), CD11c-BV650 (clone B-ly6), CD163-PerCP-Cy5.5 (clone GHI/61), CD123-BV605 (clone 9F5; all from BD), CD141-APC (clone AD5–14H12, Miltenyi Biotec), CLEC9A-PE (clone 8F9), CD36-APC-Cy7 (clone 5–271; both Biolegend), CD1c-BV421 (clone L161, eBioscienes) and CD32b-AF700 (clone #190723, R&D systems).
The cryopreserved PBMC were thawed and stained as described previously.Citation26 In brief, 1 million PBMC were washed in phosphate buffered saline (PBS) and stained with yellow amine reactive dye (1:800) for 20 minutes at room temperature, after which they were washed two times with PBS supplemented with 0.5% bovine serum albumin (BSA, Sigma). Next, cells were blocked for non-specific binding of antibodies by PBS/0.5% BSA/10%FCS for 10 minutes on ice, washed and subsequently incubated for 30 minutes on ice with the abovementioned antibody mixes. Then, the cells were washed twice with PBS/0.5% BSA, resuspended in 1% paraformaldehyde (Pharmacy LUMC), stored at 4°C in the dark and acquired at the flow cytometer (LSR-Fortessa, BD) within 24 hours. The data were (re-) analyzed with DIVA software 8.02. Specific gating strategies of all the different myeloid, monocytes/macrophages, MDSC and DC populations are given in suppl. (monocytes/macrophages and MDSC subsets) and suppl. (peripheral blood DC subsets). Exact subset definitions are given in suppl. Table II.
Ex vivo co-culture suppression assay
The suppressive function of various MDSC subsets was assessed by [3 H]-Thymidine incorporation-based ex vivo co-culture suppression assay.Citation27 This assay was initially described by Tree et al. as a highly efficient (using only 10,000 cells) and sensitive assay for measuring Treg suppressive function. Suitability of this assay for measuring suppressive function of Treg cells was confirmed by us previously for peripheral blood-isolated CD25+CD127−/low Tregs (Santegoets et al, manuscript in preparation). Now, the capacity of mMDSC, CD14-CD15- double-negative (dn) CD33+CD11b+ and CD33-CD11b+ MDSC (hereafter referred to as CD33+ early stage MDSC (eMDSC)Citation44 and CD33- dnMDSC) to inhibit responder T cell proliferation was assessed using this assay. First, mMDSC, CD33+ eMDSC and CD33- dnMDSC and CD3+CD14-CD4+CD25+CD127−/low Tregs (positive control) were isolated from pre-treatment PBMC samples of five EOC patients (two platinum-sensitive and three platinum-resistant patients) by flow cytometric sorting (Aria III cell sorter, BD). To this end, PBMC were stained with antibodies against CD3-V450 (clone UCHT1), CD4-APC (clone RPA-4), CD25-BV605 (clone 2A3), CD127-PE (clone HIL-7R-M21), CD33-PE-Cy7 (clone P67.6), CD11b-AF488, CD14-PerCp-Cy5.5 (clone M5E2), CD15-PE-CF594 (clone W6D3), CD56-APC-Cy7 (clone HCD56) and HLA-DR-V500 (clone L243; all from BD). Single lymphocytes were identified based on FSC and SSC properties, after which the following populations were sorted: CD3+CD14-CD4+CD25int/lowCD127+ responder T cells (Tresp), CD3+CD14-CD4+CD25+CD127−/low Tregs (positive control), CD3-CD56-HLADR−/lowCD14+CD15- mMDSC, CD3-CD56-HLA-DR−/lowCD11b+CD14-CD15- and CD33+ eMDSC or CD33- dnMDSC. The purity of the isolated populations was determined by flow cytometry after each experiment. Foxp3 expression within the isolated Tregs was determined after subsequent staining with PE-CF594-labeled Foxp3 monoclonal antibody (clone 259D/C7, BD) using the BD Pharmingen Transcription Factor Buffer set as described before.Citation45 Gating strategies for FACS sorting, purity check and characteristics of the isolated populations are given in suppl. for a representative patient.
Suppressive potential of the isolated populations was analyzed by culturing 500 Tresp cells in X-VIVO-15 medium supplemented with 10% human AB serum, 100 U/ml penicillin, 100 μg/ml streptomycin and 2 mM L-glutamin in quintuplet wells in sterile 96-wells V-bottom plates (Greiner Bio One) in the presence or absence of the isolated mMDSC, CD33+ eMDSC and CD33- dnMDSC or Tregs at a 1:1 to 32:1 Tresp-to-suppressor cell ratio. Samples were stimulated with anti-CD3/CD28 activator beads at a 1:1 bead: Tresp ratio and incubated for six days at 37°C and 5% CO2. Proliferation was assessed by the addition of [3 H]-Thymidine as described above. Samples displaying proliferation below 3000 cpm were excluded from the analysis. Percentage suppression was calculated using the following equation: % suppression = 100-((cpm in presence of Tregs minus cpm unstimulated Tresp) / (cpm in absence of Tregs minus cpm unstimulated Tresp))*100).
Statistical analysis
Non-parametric Friedman or Kruskal–Wallis with Dunn's multiple comparison test for multiple samples were performed as appropriate. All statistical tests were performed at the 0.05 significance level, confidence intervals (CI) were 95% two-sided intervals. For survival analysis, the EOC patients were grouped into two groups according to the median (i.e., grouped into below (low) or above (high) the median of the total group for each parameter), after which survival was tested using Kaplan–Meier method, and statistical significance of the survival distribution was analyzed by log-rank testing. Variables with significance for survival in the univariate Cox regression analyses were further analyzed using multivariate Cox regression analysis and corrected for age, WHO performance status and time to last chemotherapy to test their independence. Hazard ratios (HR) estimated from the Cox analysis were reported as relative risks with corresponding 95% CI. The best cut-off value for the monocytes/macrophages to DC and mMDSC to DC ratios was determined using receiver operating characteristics (ROC) curve analysis. The monocytes/macrophages to DC and mMDSC to DC values with the best accuracy (i.e. with greatest sensitivity and specificity) were selected as the most optimal cut-off value and used for subsequent survival analysis. Statistical analyses were performed using SPSS for Windows version 20.0 (IBM, USA) and Graph- Pad Prism 7.1 (San Diego, USA).
Disclosure of potential conflicts of interest
No potential conflicts of interest were disclosed.
Financial support
This study was sponsored by the Bontius Foundation and the department of Medical Oncology of the Leiden University Medical Center. SJAMS and MJPW were financially supported by a grant from the Dutch Cancer Society 2014–6696.
Author contributions
Conception and design: S.J.A.M. Santegoets, J.R. Kroep and S.H. van der Burg designed the study. S.J.A.M. Santegoets, A.F. de Groot, E.M. Dijkgraaf, V.E. van der Noord, J.J. van Ham and A.M. Carnaz Simões performed the experiments. S.J.A.M. Santegoets, A.F. de Groot, M.J.P. Welters, and S.H. van der Burg analyzed and interpreted the data. S.J.A.M. Santegoets, A.F. de Groot and S.H. van der Burg conducted the statistical analysis. S.J.A.M. Santegoets and S.H. van der Burg wrote the manuscript. All authors approved the final manuscript.
Suppl_materrial.zip
Download Zip (3.3 MB)Acknowledgments
We thank the patients for participating in our studies. We also thank Merel van Diepen from the department of Clinical Epidemiology from the LUMC in Leiden for her help with statistical analysis.
Additional information
Funding
References
- Vasey PA, Jayson GC, Gordon A, Gabra H, Coleman R, Atkinson R, Parkin D, Paul J, Hay A, Kaye SB. Phase III randomized trial of docetaxel-carboplatin versus paclitaxel-carboplatin as first-line chemotherapy for ovarian carcinoma. J Natl Cancer Inst. 2004;96(22):1682–91. doi:10.1093/jnci/djh323. PMID:15547181.
- Agarwal R, Kaye SB. Ovarian cancer: strategies for overcoming resistance to chemotherapy. Nat Rev Cancer. 2003;3(7):502–16. doi:10.1038/nrc1123. PMID:12835670.
- PDQ Adult Treatment Editorial Board. Ovarian epithelial, fallopian tube, and primary peritoneal cancer treatment (PDQ(R)): health professional version. PDQ cancer information summaries. Natl Cancer Inst (US) Bethesda (MD) 2017;2002. Available at: https://www.cancer.gov/types/ovarian/hp/ovarian-epithelial-treatment-pdq. PMID:26389443.
- Mellman I, Coukos G, Dranoff G. Cancer immunotherapy comes of age. Nature. 2011;480(7378):480–9. doi:10.1038/nature10673. PMID:22193102.
- Khalil DN, Smith EL, Brentjens RJ, Wolchok JD. The future of cancer treatment: immunomodulation, CARs and combination immunotherapy. Nat Rev Clin Oncol. 2016;13(5):273–90. doi:10.1038/nrclinonc.2016.25. PMID:26977780.
- Lavoue V, Thedrez A, Leveque J, Foucher F, Henno S, Jauffret V, Belaud-Rotureau MA, Catros V and Cabillic F. Immunity of human epithelial ovarian carcinoma: the paradigm of immune suppression in cancer. J Transl Med. 2013;11:147. doi:10.1186/1479-5876-11-147. PMID:23763830.
- Zhang L, Conejo-Garcia JR, Katsaros D, Gimotty PA, Massobrio M, Regnani G, Makrigiannakis A, Gray H, Schlienger K, Liebman MN, et al. Intratumoral T cells, recurrence, and survival in epithelial ovarian cancer. N Engl J Med. 2003;348(3):203–13. doi:10.1056/NEJMoa020177. PMID:12529460
- Sato E, Olson SH, Ahn J, Bundy B, Nishikawa H, Qian F, Jungbluth AA, Frosina D, Gnjatic S, Ambrosone C, et al. Intraepithelial CD8+ tumor-infiltrating lymphocytes and a high CD8+/regulatory T cell ratio are associated with favorable prognosis in ovarian cancer. Proc Natl Acad Sci U S A. 2005;102(51):18538–43. doi:10.1073/pnas.0509182102. PMID:16344461.
- Hamanishi J, Mandai M, Iwasaki M, Okazaki T, Tanaka Y, Yamaguchi K, Higuchi T, Yagi H, Takakura K, Minato N, et al. Programmed cell death 1 ligand 1 and tumor-infiltrating CD8+ T lymphocytes are prognostic factors of human ovarian cancer. Proc Natl Acad Sci U S A. 2007;104(9):3360–5. doi:10.1073/pnas.0611533104. PMID:17360651.
- Kryczek I, Zou L, Rodriguez P, Zhu G, Wei S, Mottram P, Brumlik M, Cheng P, Curiel T, Myers L, et al. B7-H4 expression identifies a novel suppressive macrophage population in human ovarian carcinoma. J Exp Med. 2006;203(4):871–81. doi:10.1084/jem.20050930. PMID:16606666.
- Curiel TJ, Coukos G, Zou L, Alvarez X, Cheng P, Mottram P, Evdemon-Hogan M, Conejo-Garcia JR, Zhang L, Burow M, et al. Specific recruitment of regulatory T cells in ovarian carcinoma fosters immune privilege and predicts reduced survival. Nat Med. 2004;10(9):942–9. doi:10.1038/nm1093. PMID:15322536.
- Cui TX, Kryczek I, Zhao L, Zhao E, Kuick R, Roh MH, Vatan L, Szeliga W, Mao Y, Thomas DG, et al. Myeloid-derived suppressor cells enhance stemness of cancer cells by inducing microRNA101 and suppressing the corepressor CtBP2. Immunity. 2013;39(3):611–21. doi:10.1016/j.immuni.2013.08.025. PMID:24012420.
- Wouters M, Dijkgraaf EM, Kuijjer ML, Jordanova ES, Hollema H, Welters M, van der Hoeven J, Daemen T, Kroep JR, Nijman HW, et al. Interleukin-6 receptor and its ligand interleukin-6 are opposite markers for survival and infiltration with mature myeloid cells in ovarian cancer. Oncoimmunology. 2014;3(12):e962397. doi:10.4161/21624011.2014.962397. PMID:25964862
- Wu L, Deng Z, Peng Y, Han L, Liu J, Wang L, Li B, Zhao J, Jiao S, Wei H. Ascites-derived IL-6 and IL-10 synergistically expand CD14(+)HLA-DR(−/low) myeloid-derived suppressor cells in ovarian cancer patients. Oncotarget. 2017;8(44):76843–56. doi:10.18632/oncotarget.20164. PMID:29100353
- Coleman S, Clayton A, Mason MD, Jasani B, Adams M, Tabi Z. Recovery of CD8+ T-cell function during systemic chemotherapy in advanced ovarian cancer. Cancer Res. 2005;65(15):7000–6. doi:10.1158/0008-5472.can-04-3792. PMID:16061686
- So KA, Hong JH, Jin HM, Kim JW, Song JY, Lee JK, Lee NW. The prognostic significance of preoperative leukocytosis in epithelial ovarian carcinoma: a retrospective cohort study. Gynecol Oncol. 2014;132(3):551–5. doi:10.1016/j.ygyno.2014.01.010. PMID:24440470.
- Chen Y, Zhang L, Liu WX, Liu XY. Prognostic significance of preoperative anemia, leukocytosis and thrombocytosis in chinese women with epithelial ovarian cancer. Asian Pac J Cancer Prev. 2015;16(3):933–9. PMID:25735385.
- Mabuchi S, Matsumoto Y, Isohashi F, Yoshioka Y, Ohashi H, Morii E, Hamasaki T, Aozasa K, Mutch DG and Kimura T. Pretreatment leukocytosis is an indicator of poor prognosis in patients with cervical cancer. Gynecol Oncol. 2011;122(1):25–32. doi:10.1016/j.ygyno.2011.03.037. PMID:21514632
- Worley MJ Jr., Nitschmann CC, Shoni M, Vitonis AF, Rauh-Hain JA, Feltmate CM. The significance of preoperative leukocytosis in endometrial carcinoma. Gynecol Oncol. 2012;125(3):561–5. doi:10.1016/j.ygyno.2012.03.043. PMID:22465698
- Santegoets SJ, Welters MJ, van der Burg SH. Monitoring of the immune dysfunction in cancer patients. Vaccines (Basel). 2016;4(3):29. doi:10.3390/vaccines4030029. PMID:27598210.
- Galluzzi L, Zitvogel L, Kroemer G. Immunological mechanisms underneath the efficacy of cancer therapy. Cancer Immunol Res. 2016;4(11):895–902. doi:10.1158/2326-6066.cir-16-0197. PMID:27803050
- van der Burg SH, Arens R, Ossendorp F, van Hall T, Melief CJ. Vaccines for established cancer: overcoming the challenges posed by immune evasion. Nat Rev Cancer. 2016;16(4):219–33. doi:10.1038/nrc.2016.16. PMID:26965076.
- Villani AC, Satija R, Reynolds G, Sarkizova S, Shekhar K, Fletcher J, Griesbeck M, Butler A, Zheng S, Lazo S, et al. Single-cell RNA-seq reveals new types of human blood dendritic cells, monocytes, and progenitors. Science. 2017;356(6335):eaah4573. doi:10.1126/science.aah4573. PMID:28428369.
- Dijkgraaf EM, Santegoets SJ, Reyners AK, Goedemans R, Wouters MC, Kenter GG, van Erkel AR, van Poelgeest MI, Nijman HW, van der Hoeven JJ, et al. A phase I trial combining carboplatin/doxorubicin with tocilizumab, an anti-IL-6R monoclonal antibody, and interferon-alpha2b in patients with recurrent epithelial ovarian cancer. Ann Oncol. 2015;26(10):2141–9. doi:10.1093/annonc/mdv309. PMID:26216383
- Dijkgraaf EM, Santegoets SJ, Reyners AK, Goedemans R, Nijman HW, van Poelgeest MI, van Erkel AR, Smit VT, Daemen TA, van der Hoeven JJ, et al. A phase 1/2 study combining gemcitabine, Pegintron and p53 SLP vaccine in patients with platinum-resistant ovarian cancer. Oncotarget. 2015;6(31):32228–43. doi:10.18632/oncotarget.4772. PMID:26334096
- Welters MJ, van der Sluis TC, van Meir H, Loof NM, van Ham VJ, van Duikeren S, Santegoets SJ, Arens R, de Kam ML, Cohen AF, et al. Vaccination during myeloid cell depletion by cancer chemotherapy fosters robust T cell responses. Sci Transl Med. 2016;8(334):334ra52. doi:10.1126/scitranslmed.aad8307. PMID:27075626.
- Yang JH, Cutler AJ, Ferreira RC, Reading JL, Cooper NJ, Wallace C, Clarke P, Smyth DJ, Boyce CS, Gao GJ, et al. Natural variation in interleukin-2 sensitivity influences regulatory T-Cell frequency and function in individuals with long-standing type 1 diabetes. Diabetes. 2015;64(11):3891–902. doi:10.2337/db15-0516. PMID:26224887.
- Merad M, Sathe P, Helft J, Miller J, Mortha A. The dendritic cell lineage: ontogeny and function of dendritic cells and their subsets in the steady state and the inflamed setting. Annu Rev Immunol. 2013;31:563–604. doi:10.1146/annurev-immunol-020711-074950. PMID:23516985.
- Dijkgraaf EM, Heusinkveld M, Tummers B, Vogelpoel LT, Goedemans R, Jha V, Nortier JW, Welters MJ, Kroep JR, van der Burg SH. Chemotherapy alters monocyte differentiation to favor generation of cancer-supporting M2 macrophages in the tumor microenvironment. Cancer Res. 2013;73(8):2480–92. doi:10.1158/0008-5472.can-12-3542. PMID:23436796.
- Gabrilovich DI, Ostrand-Rosenberg S, Bronte V. Coordinated regulation of myeloid cells by tumours. Nat Rev Immunol. 2012;12(4):253–68. doi:10.1038/nri3175. PMID:22437938.
- Talebian Yazdi M, Loof NM, Franken KL, Taube C, Oostendorp J, Hiemstra PS, Welters MJ and van der Burg SH. Local and systemic XAGE-1b-specific immunity in patients with lung adenocarcinoma. Cancer Immunol Immunother. 2015;64(9):1109–21. doi:10.1007/s00262-015-1716-2. PMID:26025564.
- Wu X, Feng QM, Wang Y, Shi J, Ge HL, Di W. The immunologic aspects in advanced ovarian cancer patients treated with paclitaxel and carboplatin chemotherapy. Cancer Immunol Immunother. 2010;59(2):279–91. doi:10.1007/s00262-009-0749-9. PMID:19727719.
- Suzuki E, Kapoor V, Jassar AS, Kaiser LR, Albelda SM. Gemcitabine selectively eliminates splenic Gr-1+/CD11b+ myeloid suppressor cells in tumor-bearing animals and enhances antitumor immune activity. Clin Cancer Res. 2005;11(18):6713–21. doi:10.1158/1078-0432.ccr-05-0883. PMID:16166452.
- Kodumudi KN, Woan K, Gilvary DL, Sahakian E, Wei S, Djeu JY. A novel chemoimmunomodulating property of docetaxel: suppression of myeloid-derived suppressor cells in tumor bearers. Clin Cancer Res. 2010;16(18):4583–94. doi:10.1158/1078-0432.ccr-10-0733. PMID:20702612.
- Kongsted P, Borch TH, Ellebaek E, Iversen TZ, Andersen R, Met O, Hansen M, Lindberg H, Sengelov L and Svane IM. Dendritic cell vaccination in combination with docetaxel for patients with metastatic castration-resistant prostate cancer: a randomized phase II study. Cytotherapy. 2017;19(4):500–13. doi:10.1016/j.jcyt.2017.01.007. PMID:28215654.
- Obermajer N, Muthuswamy R, Lesnock J, Edwards RP, Kalinski P. Positive feedback between PGE2 and COX2 redirects the differentiation of human dendritic cells toward stable myeloid-derived suppressor cells. Blood. 2011;118(20):5498–505. doi:10.1182/blood-2011-07-365825. PMID:21972293
- Zhang Z, Huang J, Zhang C, Yang H, Qiu H, Li J, Liu Y, Qin L, Wang L, Hao S, et al. Infiltration of dendritic cells and T lymphocytes predicts favorable outcome in epithelial ovarian cancer. Cancer Gene Ther. 2015;22(4):198–206. doi:10.1038/cgt.2015.7. PMID:25721210.
- Martin D, Rodel F, Winkelmann R, Balermpas P, Rodel C, Fokas E. Peripheral leukocytosis is inversely correlated with intratumoral CD8+ T-Cell infiltration and associated with worse outcome after chemoradiotherapy in anal cancer. Front Immunol. 2017;8:1225. doi:10.3389/fimmu.2017.01225. PMID:29085358
- Weber J, Gibney G, Kudchadkar R, Yu B, Cheng P, Martinez AJ, Kroeger J, Richards A, McCormick L, Moberg V, et al. Phase I/II study of metastatic melanoma patients treated with nivolumab who had progressed after ipilimumab. Cancer Immunol Res. 2016;4(4):345–53. doi:10.1158/2326-6066.cir-15-0193. PMID:26873574.
- Martens A, Wistuba-Hamprecht K, Geukes Foppen M, Yuan J, Postow MA, Wong P, Romano E, Khammari A, Dreno B, Capone M, et al. Baseline peripheral blood biomarkers associated with clinical outcome of advanced melanoma patients treated with ipilimumab. Clin Cancer Res. 2016;22(12):2908–18. doi:10.1158/1078-0432.ccr-15-2412. PMID:26787752.
- Santegoets SJ, Stam AG, Lougheed SM, Gall H, Jooss K, Sacks N, Hege K, Lowy I, Scheper RJ, Gerritsen WR, et al. Myeloid derived suppressor and dendritic cell subsets are related to clinical outcome in prostate cancer patients treated with prostate GVAX and ipilimumab. J Immunother Cancer. 2014;2:31. doi:10.1186/s40425-014-0031-3. PMID:26196012.
- Krieg C, Nowicka M, Guglietta S, Schindler S, Hartmann FJ, Weber LM, Dummer R, Robinson MD, Levesque MP, Becher B. High-dimensional single-cell analysis predicts response to anti-PD-1 immunotherapy. Nat Med. 2018;24(2):144–53. doi:10.1038/nm.4466. PMID:29309059.
- Welters MJ, Kenter GG, de Vos van Steenwijk PJ, Lowik MJ, Berends-van der Meer DM, Essahsah F, Stynenbosch LF, Vloon AP, Ramwadhdoebe TH, Piersma SJ, et al. Success or failure of vaccination for HPV16-positive vulvar lesions correlates with kinetics and phenotype of induced T-cell responses. Proc Natl Acad Sci U S A. 2010;107(26):11895–9. doi:10.1073/pnas.1006500107. PMID:20547850.
- Bronte V, Brandau S, Chen SH, Colombo MP, Frey AB, Greten TF, Mandruzzato S, Murray PJ, Ochoa A, Ostrand-Rosenberg S, et al. Recommendations for myeloid-derived suppressor cell nomenclature and characterization standards. Nat Commun. 2016;7:12150. doi:10.1038/ncomms12150. PMID:27381735.
- Santegoets SJ, Dijkgraaf EM, Battaglia A, Beckhove P, Britten CM, Gallimore A, Godkin A, Gouttefangeas C, de Gruijl TD, Koenen HJ, et al. Monitoring regulatory T cells in clinical samples: consensus on an essential marker set and gating strategy for regulatory T cell analysis by flow cytometry. Cancer Immunol Immunother. 2015;64(10):1271–86. doi:10.1007/s00262-015-1729-x. PMID:26122357.