
ABSTRACT
The use of inhibitory checkpoint blockade in the management of glioblastoma has been studied in both preclinical and clinical settings. TIGIT is a novel checkpoint inhibitor recently discovered to play a role in cancer immunity. In this study, we sought to determine the effect of anti-PD-1 and anti-TIGIT combination therapy on survival in a murine glioblastoma (GBM) model, and to elucidate the underlying immune mechanisms. Using mice with intracranial GL261-luc+ tumors, we found that TIGIT expression was upregulated on CD8+ and regulatory T cells (Tregs) in the brain compared to draining cervical lymph nodes (CLN) and spleen. We then demonstrated that treatment using anti-PD-1 and anti-TIGIT dual therapy significantly improved survival compared to control and monotherapy groups. The therapeutic effect was correlated with both increased effector T cell function and downregulation of suppressive Tregs and tumor-infiltrating dendritic cells (TIDCs). Clinically, TIGIT expression on tumor-infiltrating lymphocytes was shown to be elevated in patient GBM samples, suggesting that the TIGIT pathway may be a valuable therapeutic target. Expression of the TIGIT ligand, PVR, further portended a poor survival outcome in patients with low-grade glioma. We conclude that anti-TIGIT is an effective treatment strategy against murine GBM when used in combination with anti-PD-1, improving overall survival via modifications of both the T cell and myeloid compartments. Given evidence of PVR expression on human GBM cells, TIGIT presents as a promising immune therapeutic target in the management of these patients.
Introduction
Glioblastoma (GBM) is an aggressive disease associated with high rates of morbidity and mortality. With the current standard of care, which includes maximal surgical resection plus adjuvant chemotherapy and radiation, median survival is still less than two years.Citation1-Citation3 Thus, efforts are currently underway to identify novel therapies for the treatment of GBM. One therapeutic approach, immunotherapy, modulates the host immune response to cancer to eradicate tumors. One class of immunotherapeutic agents extensively studied are immune checkpoint inhibitors.Citation4
The immune system recognizes antigens, such as those expressed on cancer cells, resulting in eradication of pathogens or tumor elimination in order to maintain homeostasis. However, some cancers evade immune surveillance by overexpressing immune checkpoint ligands, thereby activating negative regulatory pathways that downregulate T cell activation and effector function. To combat this phenomenon, various monoclonal antibodies targeting immune checkpoints have been developed to block this interaction.Citation4-Citation7 For example, blockade of the well-studied checkpoint, programmed cell death protein 1 (PD-1), has been FDA approved for the treatment of multiple advanced cancers, such as melanoma and non-small cell lung cancer (NSCLC).Citation8-Citation10 However, anti-PD-1 monotherapy has only demonstrated limited benefit in GBM. In an effort to augment the therapeutic effects of anti-PD-1 treatment, many groups have examined the effect of combination immune checkpoint blockade. Studies of anti-PD-1 treatment with other checkpoint inhibitors, such as anti-cytotoxic T-lymphocyte-associated protein 4 (CTLA-4) and anti-T cell immunoglobulin and mucin domain 3 (TIM-3), have demonstrated promising results in a murine GBM model, and various combinations are currently being tested in clinical trials.Citation11,Citation12
T cell immunoreceptor with Ig and ITIM domains (TIGIT) is a novel checkpoint inhibitory molecule that has recently gained attention in cancer immunotherapy.Citation13-Citation15 It is expressed on a variety of immune cells, including T cells, regulatory T cells (Tregs), and natural killer (NK) cells.Citation16 TIGIT competes with CD226, its co-stimulatory counterpart, to bind to the poliovirus receptor (PVR, also known as CD155) with higher affinity.Citation17,Citation18 Elevated TIGIT expression on CD8+ T cells and Tregs has been shown to confer an overall suppressive phenotype, correlating with reduced cytokine production and poor survival in multiple cancer models.Citation19-Citation22 Moreover, this effect was further suggested to be mediated by dendritic cells (DCs), which can regulate the TIGIT pathway via the expression of CD155.Citation16 In the clinical setting, prior studies have demonstrated an elevated expression of CD155 on human GBM cells and increased TIGIT expression on patient CD8+ tumor-infiltrating lymphocytes (TILs), rendering this pathway as a potential therapeutic target.Citation23,Citation24 However, the effect of TIGIT blockade as a treatment strategy remains unknown.
Single checkpoint blockade has been associated with upregulation of other inhibitory checkpoints and development of treatment resistance.Citation25 Therefore, this study examines the efficacy and mechanism of dual anti-PD-1 and anti-TIGIT checkpoint blockade in a murine glioma model. We hypothesized that combination therapy leads to a significant increase in survival via modulations of both the T cell and myeloid compartments of the immune system.
Results
High PD-1 and TIGIT expression in brain tumor-infiltrating lymphocytes of glioma patients
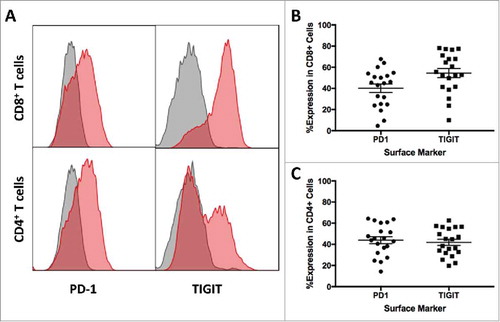
Elevated expressions of various inhibitory checkpoints have been suggested as a mechanism of immune evasion in multiple cancers. To determine the expression of PD-1 and TIGIT in tumor-infiltrating lymphocytes (TILs) in patients with glioma, tissue samples were collected during surgical resection and processed immediately afterwards. Single cell suspensions were further analyzed using flow cytometry. A total of 20 patient samples were included in this study, with a median age of 54.5 (Range: 29 – 76). PD-1 and TIGIT expressions on CD8+ T cells were 40.19% ± 4.01 and 54.48% ± 4.30 respectively ( and ). Similar expression levels were found on CD4+ T cells at 43.92% ± 3.27 and 41.78% ± 2.91 for PD-1 and TIGIT respectively ( and ).
Figure 1. High PD-1 and TIGIT Expression in Patient Brain TILs. A. Representative histograms of PD-1 and TIGIT expression on tumor-infiltrating CD3+CD8+ and CD3+CD4+ T cells. Gray histograms represent isotype control, and red histograms represent the staining of PD-1 and TIGIT surface markers. B. PD-1 (40.19% ± 4.01) and TIGIT (54.48% ± 4.30) expressions on CD8+ T cells were elevated in patients with glioma. C. High expressions of PD-1 (43.92% ± 3.27) and TIGIT (41.78% ± 2.91) were found in tumor-infiltrating CD4+ T cells.
Brain tumor-infiltrating lymphocytes upregulate PD-1 and TIGIT expression
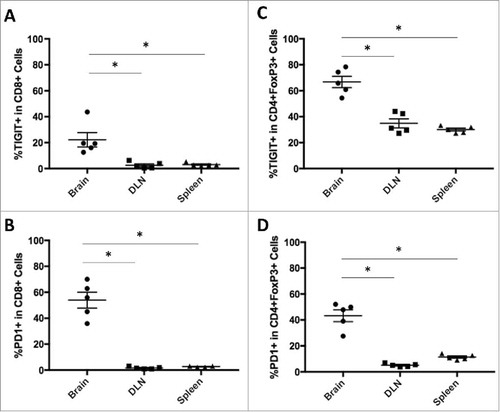
While elevated TIGIT expression has been demonstrated in human GBM and glioma tissue samples, the therapeutic effects from targeting this pathway are poorly understood. To investigate potential survival benefits, we selected the GL261 murine GBM model for further experimentation. We first sought to determine whether PD-1 and TIGIT expressions on TILs are elevated in tumor-bearing mice. Untreated mice were sacrificed on day 20 after tumor implantation, and brains, CLN, and spleens were harvested. Immune cells were isolated, and flow cytometry was used to identify CD8+ T cell and CD4+ T cell populations. TIGIT and PD-1 expression was significantly increased on CD8+ T cells in the brain in comparison to both the CLN and spleen (p = 0.0015 and 0.0001 respectively; and ). Regulatory T cells (Tregs) were further identified from the CD4+ T cell population by FoxP3co-expression. Expression of both TIGIT and PD-1 was significantly higher on Tregs in the brain than in the CLN and spleen (p < 0.0001 for both; and ).
Figure 2. TIGIT and PD-1 expression is upregulated in brain tumor infiltrating lymphocytes. A. Brain CD8+ cells had significantly higher expression of TIGIT (p = 0.0015) and B. PD-1 (p = 0.0001) compared to CD8+ cells in the CLN and spleen. C. CD4+FoxP3+ cells in the brain had similarly elevated expression of TIGIT (p < 0.0001) and D. PD-1 (p < 0.0001) compared to those in the CLN and spleen.
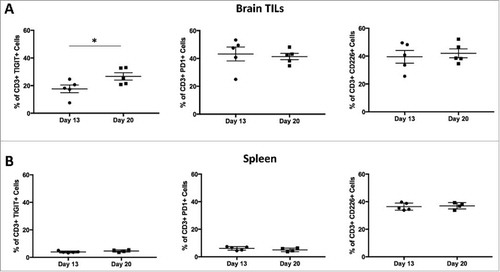
To determine the change in the expression of various inhibitory checkpoint markers over time, untreated mice brains and spleens were harvested on days 13 (n = 5) and 20 (n = 5) post-tumor implantation. The organs were processed into single cell suspensions and stained for surface markers including TIGIT, PD-1, and CD226. Results demonstrated that TIGIT expression on CD3+ T cells in the brains of untreated tumor-bearing mice was higher on day 20 than on day 13 (p = 0.0490), while there was no significant difference in PD-1 and CD226 expression (p = 0.7432 and 0.6690, respectively; ). In the spleen, there was no difference in TIGIT, PD-1, or CD226 expression on days 13 and 20 (p = 0.1846, 0.2879, and 0.7560, respectively; ).
Figure 3. TIGIT expression is upregulated at later time-points in a tissue specific pattern. Flow analysis was performed on days 13 and 20 for brain TILs and spleens. A. TIGIT expression on CD3+ cells in the brain was significantly higher on day 20 than 13 (p = 0.0490). There was no significance between the two time-points for PD-1 or CD226 expression on brain CD3+ cells (p = 0.7432 and 0.6690 respectively). B. Expression of TIGIT, PD-1, and CD226 on spleen CD3+ cells remained the same across the two time-points (p = 0.1846, 0.2879, and 0.7560 respectively).
Late expression of TIGIT allows for delayed treatment efficacy and addition of anti-PD-1 confers increased survival benefit
The use of multiple immune checkpoint inhibitors have been shown to improve survival in murine GBM models.Citation12,Citation26 Based on these findings, we hypothesized that anti-PD-1 and anti-TIGIT dual therapy would be more effective than either monotherapy alone. However, there has been no established anti-TIGIT treatment schedule for GBM. To determine the most effective and clinically applicable treatment course, we investigated the effect of various anti-TIGIT dosing schedules on overall survival. The mice were randomized into ten treatment arms (N = 70): control (no treatment), anti-PD-1 monotherapy (days 10, 12, 14), anti-TIGIT monotherapy group A (days 8, 10, 12, 14, 16), anti-TIGIT monotherapy group B (days 10, 12, 14, 16, 18), anti-TIGIT monotherapy group C (days 12, 14, 16, 18, 20), anti-TIGIT monotherapy group D (days 14, 16, 18, 20, 22), and combination therapy groups A-D (anti-PD-1 treatment on days 10, 12, 14 with corresponding anti-TIGIT treatment schedule as described above; ).
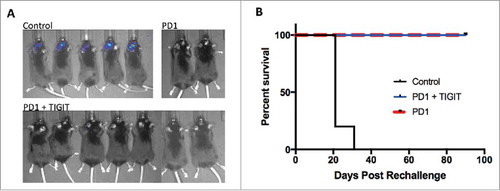
Figure 4. Anti-PD-1 and anti-TIGIT combination therapy improves long-term survival following both early and late treatment courses. A. Diagram depicting experiment set up including treatment schedules. Day 0, 130,000 GL261-luc+ cells were injected stereotactically into the right stratum of female C57 BL/6 J mice (N = 70). IVIS was used to confirm tumor presence on day 7, and the animals were randomized into 10 groups. Anti-PD-1 treatment was administered on days 10, 12, and 14 via i.p. injection at a dose of 200μg/animal. Anti-TIGIT treatment was also given via i.p. injections, 200μg/animal, every other day for a total of 5 doses starting on either day 8 (Group A), 10 (Group B), 12 (Group C), or 14 (Group D). Survival was monitored. B. Kaplan meier survival curve depicts the primary endpoint for each treatment group. Anti-PD-1 treatment alone resulted in 14.3% long-term survivors, compared to 0% in the control group (p = 0.0086). Anti-TIGIT monotherapy led to 0%, 57.1%, 14.3%, and 0% long-term survival using treatment schedules A, B, C, and D respectively (p = 0.1960, 0.0006, 0.0101, and 0.1032 respectively). All combination regimens led to significant improvements in survival compared to control, including 57.1%, 85.7%, 42.9% and 57.1% long-term survivors for Groups A-D respectively (p = 0.002, 0.0002, 0.0006, and 0.0032). Combination B was also significant compared to anti-PD-1 monotherapy (p = 0.0082), while combinations A and D also trended towards significance (p = 0.0982 and 0.0929 respectively). C. Survival curve demonstrating therapeutic effect in each of the four arms following repeat survival experiment using Group D anti-TIGIT antibody treatment course (N = 54). Anti-PD-1 monotherapy resulted in 16.7% long-term survival and a median survival of 28.5 days, compared to 0% long-term survival and 24.5 days median survival in the control group (p = 0.0175). Anti-TIGIT monotherapy was not significantly different from control, with 0% long-term survivors and 25.5 days median survival (p = 0.9062). Combination treatment conferred a median survival of 44 days, including 48.0% long-term survivors (p < 0.0001). Dual checkpoint blockade was led to a significant improvement in survival compared to both anti-PD-1 and anti-TIGIT monotherapy groups (p = 0.0366 and <0.0001 respectively).
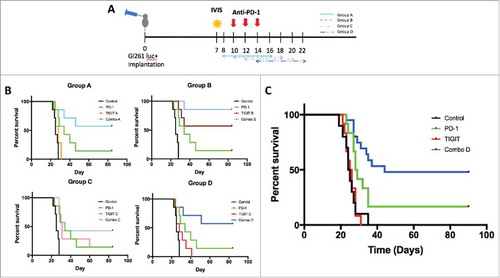
Mice in the control group had the lowest median survival of 25 days with no mice reaching long-term survival. Compared to untreated mice, those in the anti-PD-1 monotherapy group fared significantly better with a median survival of 34 days, including 14.3% long-term survivors (p = 0.0086). Anti-TIGIT monotherapy significantly increased survival in treatment groups B and C in comparison to control mice, with 57.1% and 14.3% (median survival: 31 days) of mice attaining long-term survival, respectively (p = 0.0006 and 0.0101 respectively). However, anti-TIGIT monotherapy groups A and D were not significantly better than the control group, with a median survival of 28 days for both groups and no long-term survivors (p > 0.05). All combination groups (anti-PD-1 + anti-TIGIT A-D) had significantly longer survival compared to the control group, including 57.1%, 85.7%, 42.9% and 57.1% of mice reaching long-term survival (p = 0.002, 0.0002, 0.0006, and 0.0032, respectively). Furthermore, combination group B also had significantly longer survival than anti-PD-1 monotherapy group (p = 0.0082), whereas combination groups A and D also demonstrated a trend towards increase in survival when compared to the anti-PD-1 monotherapy mice (p = 0.0982 and 0.0929 respectively). Statistical analysis using ANOVA with multiple comparisons no significant differences in survival across the four combinatorial groups (p = 0.3484; ). Overall, while differences in treatment course affected the efficacy of anti-TIGIT monotherapy, they did not change the survival benefit when anti-PD-1 was added.
To better model late stage clinical glioma, the survival experiment was repeated using the delayed (group D) anti-TIGIT treatment schedule (N = 54). Treatment with anti-PD-1 monotherapy resulted in a median survival of 28.5 days, compared to 24.5 days in the control group (p = 0.0175), whereas the median survival of anti-TIGIT alone was 25.5 days (p = 0.9062). Combination anti-PD-1 and anti-TIGIT further improved median survival to 44 days (p < 0.0001), which was significantly improved relative to anti-PD-1 monotherapy (p = 0.0366) and anti-TIGIT monotherapy (p < 0.0001). In the anti-PD-1 monotherapy group, long-term survival was achieved by 16.7% of the group, as compared to 0% for both the control and anti-TIGIT monotherapy groups. Treatment with both anti-PD-1 and anti-TIGIT further increased long term survival to 48.0% ().
Immune memory is established in long-term survivors
Next, we sought to assess whether immunologic memory is established following anti-PD-1 and anti-TIGIT antibody treatment. Tumor-free animals that achieved long-term survival were re-challenged with GL261-luc cells in the contralateral brain to test for presence of immune memory. Naïve mice were implanted as controls, and survival was compared. IVIS imaging demonstrated that while all naïve mice established tumors one week following implantation, none of the previously treated mice had tumor development (). Median survival was 21 days for the control group with 100% death rate by 31 days after implantation. Comparatively, treated mice achieved a 100% survival by post-implantation day 90 (p = 0.0005; ). This demonstrates the establishment of anti-tumor immunologic memory responses against GL261-luc cells.
Figure 5. Anti-PD-1 monotherapy and combination treatment confers immunologic memory in long-term survivors. A. Representative IVIS images showing tumor presence in the control group with naïve wildtype mice, compared to absence of tumor in long-term survivors following anti-PD-1 or combination treatment on day 7 after rechallenge with GL261-luc+ cells. B. Kaplan meier survival curve demonstrating 100% long-term survival after tumor rechallenge of responding mice previously treated with anti-PD-1 or anti-TIGIT and anti-PD-1 dual therapy, versus 0% long-term survival of naïve mice without prior treatment (p = 0.0005).
Combination therapy increases immune cell tumor-infiltration and cytokine production
After demonstrating an improvement in survival following combination therapy, we sought to investigate the underlying mechanism by examining the effects of anti-PD-1 and anti-TIGIT treatment on immune cell populations in the brain. Mice were treated via group D treatment schedule, and harvest was performed on day 20 post tumor implantation.
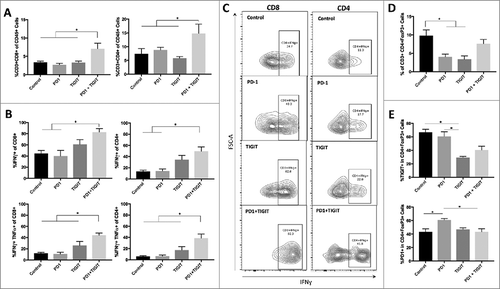
Mice that received combination therapy had significant increases in both CD8+ and CD4+ T cells compared to control, anti-PD-1 monotherapy, and anti-TIGIT monotherapy groups (p = 0.0059 and 0.0230 respectively; ). Cytokine production was assessed to further elucidate the effector function of infiltrating immune cells. Combination therapy with anti-PD-1 and anti-TIGIT significantly increased IFNγ producing CD8+ T cells relative to both untreated mice and those treated with anti-PD-1 alone (p = 0.0225 and 0.0068 respectively). Likewise, a similar trend was observed in IFNγ producing CD4+ T cells (p = 0.0037 and 0.0027 respectively). However, IFNγ production in the combination group was not significantly greater when compared to the anti-TIGIT monotherapy group for either CD4+ or CD8+ T cell populations (p = 0.2644 and 0.3194, respectively). Next, we examined the frequency of IFNγ and TNFα dual producing CD4+ and CD8+ T cells. PD-1 and TIGIT co-blockade was found to significantly increase the population of IFNγ and TNFα producing CD8+ T cells to 44.14% ± 4.10 when compared to control (12.0% ± 1.72) and both anti-PD-1 (10.69% ± 3.20) and anti-TIGIT (25.8% ± 7.30) monotherapy groups (p = 0.0008, 0.0003, and 0.0477 respectively). Comparably, this relationship was also seen for IFNγ and TNFα dual producing CD4+ T cells ( and ).
Figure 6. Combination treatment restores T cell effector function and anti-TIGIT therapy downregulates Treg suppressor phenotype. A. Frequency of brain infiltrating CD8+ cells and CD4+ cells were significantly elevated in the combination group relative to control, anti-PD-1 monotherapy, and anti-TIGIT monotherapy groups (p = 0.0059 and 0.0230 respectively). B. Combination treatment was correlated with significantly greater IFNγ expressing CD8+ and CD4+ cells (p = 0.0066 and 0.0014 respectively). IFNγ and TNFα dual-expressing CD8+ and CD4+ cells were also significantly higher in the combinatorial group (p = 0.0002 and 0.0008 respectively). C. Sample flow contour plots demonstrating shift in IFNγ expression in CD4+ and CD8+ cells across treatment arms. D. An overall significant difference was noted in the frequency of brain infiltrating CD4+FoxP3+ regulatory T cells (Tregs) in the four treatment arms (p = 0.0080). The percentage of Tregs was significantly reduced by anti-PD-1 and anti-TIGIT monotherapies (p = 0.0496 and 0.0209 respectively), but not significantly changed with combination treatment when compared to untreated, PD-1 monotherapy, and TIGIT monotherapy groups (p > 0.9999, 0.4824, and 0.2645 respectively). E. The expressions of TIGIT and PD-1 on Tregs were significantly different in the overall comparisons of all four treatment arms (p = 0.0042 and 0.0098 respectively). TIGIT expression on Tregs was significantly reduced in the anti-TIGIT monotherapy group only relative to control arm (p = 0.0082). PD-1 expression on Tregs demonstrated a significant increase in the anti-PD-1 group compared to control (p = 0.0145).
In addition to effector functions of immune cells, immune suppressor function was determined after treatment with anti-PD-1 and anti-TIGIT antibodies. Tregs have been evidenced to be elevated in various tumors and has been correlated with a suppressive immune environment.Citation27-Citation29 We also found that anti-PD-1 and anti-TIGIT monotherapies both reduced the percentage of tumor-infiltrating Tregs (6.4% and 5.4% respectively) when compared to control mice (p = 0.0496 and 0.0209, respectively). Interestingly, while there was a decrease in the frequency of Tregs in the combination group (13.0%) when compared to control group (15.8%), the difference was not significant (). Likewise, the increase in Tregs in the combination group relative to both anti-PD-1 and anti-TIGIT monotherapy groups was not statistically significant (p = 0.4824, and 0.2645 respectively). Furthermore, TIGIT expressing Tregs have been suggested to signify a suppressive phenotype.Citation20 Upon further examination of Tregs in our study, we observed that TIGIT blockade reduced the expression of TIGIT on Tregs (p = 0.0082). In contrast, PD-1 blockade increased the expression of PD-1 on Tregs relative to untreated mice (p = 0.0145; ).
Anti-PD-1 and Anti-TIGIT Co-blockade reduces tumor infiltrating dendritic cells
Studies have previously suggested that tumor-infiltrating dendritic cells (TIDCs) may promote a suppressive microenvironment by inhibiting T cell immunity.Citation30,Citation31 Therefore, we next investigated the effect of dual PD-1 and TIGIT blockade on the myeloid compartment of brain TILs. Mice in the control arm were found to have significantly higher infiltration of DCs (CD11b+CD11 c+ cells) compared to the combination arm (p = 0.0169), whereas neither anti-PD-1 nor anti-TIGIT alone exerted a similar effect relative to control (). A prior study has shown that TIDCs with high MHCII expression (CD11b+CD11 c+MHCIIhi) may inhibit CD8+ T cell function in the setting of murine mammary carcinoma.Citation32 In our study, brains of untreated mice had a significantly greater percentage (10.64% ± 2.23) of tumor-infiltrating CD11b+CD11 c+MHCIIhi cells than brains of mice receiving anti-PD-1 antibody alone (1.984% ± 0.48; p = 0.0054), anti-TIGIT antibody alone (4.148% ± 2.04; p = 0.0399), or both checkpoint inhibitors (0.908% ± 0.35; p = 0.0020). No significant difference was observed across the three treatment groups ( and ).
Figure 7. Tumor infiltrating dendritic cells are reduced following anti-TIGIT and anti-PD-1 combination treatment. A. A significant overall difference in CD11b+CD11 c+ tumor infiltrating dendritic cells (TIDCs) was found in ANOVA analysis of the four treatment arms (p = 0.0069). Addition of anti-TIGIT to anti-PD-1 therapy significantly decreases the frequency of CD11b+CD11 c+ TIDCs relative to untreated group (p = 0.0169), while neither monotherapy groups were significantly different from control (p > 0.05). B. The expression of MHCII was significantly different in the overall comparison of all groups (p = 0.0018). Frequency of CD11b+CD11 c+ TIDCs with high MHCII expression (CD11b+CD11 c+MHCIIhi) is significantly lower in all treated groups relative to control (p = 0.0018). C. Representative flow contour plots showing relative MHCII expression on CD11b+CD11 c+ cells in the four treatment arms. D. Sample flow plots depicting populations of Ly6G+ and Ly6 C+ myeloid derived suppressor cells (MDSCs) across treatment groups.
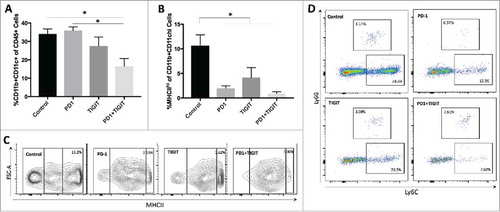
Many recent studies have also explored the effect myeloid-derived suppressor cells (MDSCs) exert on cancer immunity.Citation33-Citation35 To characterize MDSCs, we used Ly6G and Ly6 C to identify MDSCs as granulocytic MDSCs (G-MDSCs) or monocytic MDSCs (M-MDSCs), respectively. We observed a trend towards decreased M-MDSCs and increased G-MDSCs in the tumor microenvironment after combination treatment compared to control and monotherapy groups (p = 0.1032 and 0.0886; ).
CD155 expression in patients with low grade glioma correlates with decreased overall survival
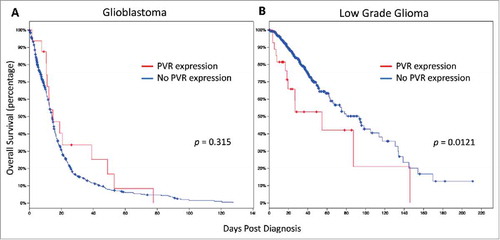
Lastly, we wanted to determine whether there are any outcome correlations in patients with GBM or low-grade glioma (LGG). Specifically, we sought to evaluate whether expression of the TIGIT ligand, CD155 (PVR), had a significant effect on survival. Using the TCGA database via cBioPortal, we compared the overall survival of patients with and without PVR expression. In the setting of GBM, no significant difference in overall survival was found in a total of 584 patients (p = 0.315; ). However, those patients with LGG (n = 513), expressing CD155 demonstrated an overall survival significantly lower than those without (p = 0.0121; ).
Figure 8. PVR expression confers poor overall survival in patients with low grade glioma. A Expression of PVR did not significantly affect survival in patients with glioblastoma (N = 584; p = 0.315). B. PVR expression was correlated with a significantly poorer survival for patients with low grade glioma (N = 513; p = 0.0121).
Discussion
Overexpression of inhibitory checkpoint molecules and their ligands has been demonstrated in multiple cancers as a means to escape immune surveillance.Citation36-Citation42 Furthermore, single and combinatorial checkpoint blockade have also shown promise in both preclinical and clinical settings.Citation10,Citation12,Citation43-Citation48 In our study, we identify a significant survival benefit with the use of combination PD-1 and TIGIT blockade in the murine GBM model through modulations of both the T cell and myeloid compartments. Our data suggests that anti-TIGIT therapy may be a valuable addition to the management of GBM.
Existing studies have demonstrated elevated expressions of TIGIT and its ligand, CD155 (PVR), in patients with GBM.Citation23,Citation24 Likewise, we found high levels of TIGIT expression on CD8+ and CD4+ TILs from patient tumor samples. Moreover, the level of PD-1 expression in these samples was similarly elevated, supporting the notion of cancer immune evasion via the upregulation of inhibitory molecules. These findings further render the TIGIT pathway as a potential candidate for drug therapy. Unfortunately, the therapeutic value of targeting this pathway, such as through checkpoint blockade, is still poorly understood. To explore the efficacy of anti-TIGIT therapy in the setting of GBM, we employed a preclinical murine model to assess for survival benefit and underlying immune mechanisms.
Anti-TIGIT therapy has been previously studied in other cancers, but to our knowledge there are no established treatment schedules for the GL261 murine model. To design the treatment course, we first evaluated the expression of TIGIT, PD-1, and CD226 at different time-points. Results showed that TIGIT expression was significantly higher at 20 days post tumor implantation than 13 days, whereas there was no change in the expressions of PD-1 and CD226. Only one mouse in the flow experiment survived until day 25, and it showed a continued trend of TIGIT upregulation. The elevated TIGIT expression late into tumor progression may allow for therapeutic efficacy even when anti-TIGIT treatment is delayed. In comparison to the CLN and spleen, brain TILs had significantly greater upregulation of TIGIT on both CD8+ and CD4+ T cells. Likewise, TIGIT expression on TILs has been shown to be upregulated in other solid cancers such as melanoma, colon cancer, and NSCLC in both mice and humans.Citation19-Citation21 Moreover, it has been suggested that TIGIT expression may indicate dysfunction of CD8+ TILs and reduced effector function.Citation19,Citation20,Citation22 These results support the notion of using anti-TIGIT antibody in cancer treatment.
One potential pitfall of many preclinical studies is the early initiation of treatment after tumor implantation, thereby resulting in falsely promising results of therapeutic efficacy. Comparatively, in the clinical setting, the majority of patients are not diagnosed and managed until later during disease progression.Citation49 Given the upregulation of TIGIT expression over time, we sought to assess the effectiveness of TIGIT blockade when given at later time-points, in addition to earlier treatment courses. Our results demonstrated that anti-TIGIT therapy alone had no significant effect on survival at early and late time-points. These findings were consistent with a prior study in murine CT26 colorectal cancer, during which anti-TIGIT treatment was initiated two weeks following tumor implantation.Citation21 Interestingly, an increase in survival was observed in the setting of B16-F10 melanoma using TIGIT deficient mice.Citation20 The differences in these findings may be explained by the degree of TIGIT depletion using anti-TIGIT antibodies versus germline deletion. Unlike anti-TIGIT monotherapy, we found that anti-PD-1 alone led to a significant increase in survival compared to control mice. The treatment effect of anti-PD-1 has been previously described in multiple murine GBM studies.Citation12,Citation43 Combination therapy using anti-TIGIT and anti-PD-1 antibodies further conferred a greater survival benefit in all anti-TIGIT treatment schedules, implying a synergistic mechanism following interruption of the two inhibitory checkpoints. This improvement in therapeutic efficacy following dual blockade of the TIGIT and PD-1 pathways has been demonstrated in the murine colorectal model.Citation21 In the clinical setting, the survival benefit we observed following delayed anti-TIGIT antibody administration may be promising for achieving disease control for patients with late diagnosis. We also investigated the presence of immunologic memory following treatment by re-challenging long-term survivors with tumor cell injection in the contralateral hemisphere. Lack of tumor growth suggested formation of anti-tumor immune memory.
The presence of TILs has been positively correlated with survival in patients with glioma.Citation50-Citation52 In our study, both tumor-infiltrating CD4+ and CD8+ T cells were significantly elevated in the combination group than in the control or either monotherapy groups. To investigate effector function, we detected expression of pro-inflammatory cytokines including IFNγ and TNFα. Elevated inflammatory cytokine production is a marker of activated T cells, and the production of multiple cytokines signifies polyfunctional, robust immune activity in the cancer setting.Citation53,Citation54 TNFα mediates an anti-tumor effect both by inhibiting angiogenesis and by directly inducing cancer cell death.Citation55,Citation56 Likewise, IFNγ has also been suggested to prevent tumor angiogenesis. In a rat glioma model, retroviral delivery of IFNγ was further shown to improve survival.Citation57-Citation59 Our findings demonstrated significantly higher frequencies of IFNγ and TNFα dual-expressing CD8+ and CD4+ T cells after anti-PD-1 and anti-TIGIT combination therapy, when compared to both monotherapy groups and the control group. Similarly, Johnston et al (2014) also revealed higher IFNγ production following PD-1 and TIGIT dual-blockade.Citation21 In light of the survival benefit following TIGIT and PD-1 dual blockade, the elevated expression of pro-inflammatory cytokines may contribute to the mechanism(s) underlying the therapeutic efficacy.
Regulatory T cells (Tregs) play a crucial role in the downregulation of the immune system and are essential in controlling inflammatory processes.Citation60 In those with GBM, elevated Treg tumor infiltration has often been associated with worse prognoses, likely secondary to subdued anti-tumor immune response.Citation61,Citation62 Contrary to existing studies, although both anti-PD-1 and anti-TIGIT monotherapies led to a reduction in Tregs, combination therapy did not amount to a significant decrease, despite the survival benefit conferred. One possible explanation may be that flow analysis was performed after the immune system had mounted a robust anti-tumor inflammatory response, and the presence of Tregs may represent the anti-inflammatory response associated with resolution of an inflammatory event. TIGIT expression on Tregs has also been proposed to indicate a suppressive phenotype.Citation20 In our study, anti-TIGIT therapy alone resulted in a significant reduction in TIGIT expression, while combination treatment trended towards lower TIGIT expression without reaching significance. Likewise, this observation could also be attributed to the timing of when flow analysis was performed. Overall, we described a highly activated phenotype of CD8+ T cells following dual checkpoint blockade, despite lack of significant decrease in the frequency of Tregs and TIGIT expression on Tregs. These findings suggest that the treatment effect on Tregs may precede the effect on CD8+ T cells. Kurtulus et al (2015) had previously proposed that TIGIT expression on Tregs are essential in damping the effector function of CD8+ T cells.Citation20 Given these findings, our results may further add a temporal element to the overall picture.
TIDCs with a mature phenotype promote anti-tumor immune activity and predict better prognosis. However, recent studies suggest TIDCs exhibit unique phenotypes related to tumor progression and the tumor microenvironment.Citation63-Citation65 For instance, Norian et al (2009) showed an accumulation of CD11b+CD11 c+MHCIIhi TIDCs in murine mammillary tumors following tumor progression and further demonstrated a suppressive effect on CD8+ T cell function. The authors also distinguished this population of DCs from myeloid derived suppressor cells (MDSCs), a distinctive cell population known for its immune suppressive activity in cancer models.Citation32 In our study, we found that combinatorial therapy correlated with a significantly lower frequency of CD11b+CD11 c+ TIDCs. Further gating on MHCII expression revealed a significant reduction in CD11b+CD11 c+MHCIIhi TIDCs in all treated groups relative to control. Consistent with the literature, we saw a negative correlation between the frequency of CD11b+CD11 c+MHCIIhi TIDCs and pro-inflammatory cytokine production by CD8+ T cells, suggesting that reduction in suppressive TIDCs may contribute to the restoration of effector T cells function. Activation of the TIGIT pathway has been found to increase IL-10 and reduce IL-12 production by DCs, rendering a suppressive phenotype.Citation16 TIGIT blockade, therefore, could mitigate this effect and reduce IL-10 activation of effector T cells. Interestingly, TIGIT has not been found to change DC maturation (characterized by expression of CD80, CD86, CD83, and HLA-DR) in the in vitro setting, though it remains unclear how this observation may change in an in vivo model. Overall, our findings suggest that the therapeutic effect of anti-TIGIT and anti-PD-1 combination treatment is also mediated by their effect on the myeloid compartment, specifically TIDCs.
While TIGIT and its ligand, CD155 (PVR), have been shown to be highly expressed in patients with GBM, it is unclear whether this is also correlated with survival outcomes. We used the TCGA database to generate survival curves for patients with PVR expression on cancer cells. Despite our finding of high TIGIT expression on CD8+ and CD4+ TILs in GBM patients, PVR expression did not portend worsened survival outcomes in those with GBM. Interestingly, we found that the expression of PVR was correlated with poor overall survival in patients with low grade glioma (LGG). Given that our study was based on a murine GBM model, further preclinical studies are necessary to better evaluate the effect of anti-TIGIT treatment in a LGG model. Based on our study showing the efficacy of TIGIT blockade, it would be interesting to determine whether the level of PVR expression may also be predictive of response to anti-TIGIT therapy. Future studies are necessary to assess the efficacy of this treatment in the clinical setting.
Checkpoint blockade has garnered significant attention in the treatment of various cancers, including GBM. In this study, we evaluated the efficacy of the blockade of a novel inhibitor checkpoint molecule, TIGIT, when used in combination with anti-PD-1 in a murine GBM model. Results demonstrated a positive effect on survival mediated by upregulation of effector T cell functions and reduction of suppressive regulatory T cells and TIDCs. Furthermore, we demonstrated high levels of TIGIT expression on TILs in patients with GBM, rendering the TIGIT pathway as a valuable therapeutic target. Further investigation is necessary to elucidate the interplay of various pathways in painting an overall pro-inflammatory picture following TIGIT blockade, and additional clinical studies are needed to determine the effect of anti-TIGIT treatment in GBM patients. Nevertheless, these results suggest that TIGIT could be a promising target in the management of GBM.
Materials and methods
Patient sample analysis
Fresh tumor tissues were obtained from 20 patients undergoing surgical resection of glioma in accordance with the institutional review board approval at Seoul National University Hospital. Histological diagnosis consisted of 10 glioblastomas, 4 anaplastic oligodendrogliomas, 3 anaplastic astrocytomas, 1 diffuse midline glioma, 1 anaplastic ganglioglioma, and 1 oligodendroglioma. Tumor specimens were collected in RPMI media at room temperature immediately after surgical resection. MACS brain tumor dissociation kit and gentleMACS™ Dissociators (Miltenyi Biotec) were used to dissociate tissue samples within 2 hours following collection, and debris were removed using MACS Debris Removal Solution (Miltenyi Biotec) according to the manufacturer protocol.
Immune cells were stained for surface markers using fluorescence-conjugated monoclonal antibodies including CD45 (clone HI30, BD Biosciences), CD3 (clone UCHT1, BD Biosciences), CD4 (clone L200, BD Biosciences), CD8 (clone SK1, BD Biosciences), PD1 (clone EH12.1, BD Biosciences), and TIGIT (clone 741182, R&D Systems). Flow cytometry was performed using FACS LSR Fortessa™ (BD Biosciences), and data was analyzed using FlowJo software (Treestar).
Mice
Six- to eight-week-old C57 BL/6 J female mice were purchased from the Jackson Laboratory and housed in a pathogen-free animal facility of the Koch Cancer Research Building II at Johns Hopkins University. Animals were kept in the facility for at least a week prior to performing any procedures to minimize stress response. All experiments were conducted under protocols approved by the Johns Hopkins Institutional Animal Care and Use Committee (IACUC).
Cell lines
GL261-luciferase positive (GL261-luc, Caliper Life Sciences) cells were cultured in Dulbecco's Modified Eagle Medium (DMEM, Gibco), 10% fetal bovine serum (FBS, Sigma-Aldrich), 1% penicillin-streptomycin (Sigma-Aldrich), and 100 μg/mL G418 selection agent (Corning). All cell lines were kept in a 37°C humidified incubator with 5% CO2. Cells were passaged to maintain 70% confluency. All cells used for experiments were passaged for less than one month.
For tumor implantation, cells were trypsinized using 0.05% trypsin-EDTA (Gibco) and washed in Dulbecco's phosphate buffered saline (dPBS, Gibco). Viability and quantity were assessed via 0.4% Trypan Blue (Gibco) staining. Cells were resuspended at a final concentration of 130,000 cells/1μL PBS for implantation.
Intracranial tumor model and antibodies treatment
Mice were anesthetized via intraperitoneal (i.p.) injection of ketamine-xylazine solution. The surgical area was sanitized and surface of the skull exposed via a small midline incision. A right-sided burr hole was drilled at the following coordinates: 2 mm anterior and 2 mm lateral to lambda. GL261-luc cells (130,000) in 1μL dPBS were stereotactically implanted into the left striatum, 3 mm deep to the cortical surface. Detailed methodology has been previously described.Citation43 Seven days post-tumor implantation, luciferin was injected intraperitoneally and tumor presence was confirmed using an In Vitro Imaging System (IVIS, PerkinElmer). Mice were randomized to ensure equal tumor radiance amongst the treatment groups.
Anti-PD-1 (4 H2) and anti-TIGIT (clone 4B1 mIgG2 a, depleting isotype) therapeutic antibodies were generously provided by Bristol-Myers Squibb (BMS). Stock concentrations were diluted to 100 mg/mL in dPBS and stored at 4°C. Both antibodies were dosed at 200μg per animal and were administered via i.p. injection. This treatment protocol was used for both survival and flow studies. All survival experiments were repeated in duplicates with at least 7 animals per arm. Animals were euthanized when they demonstrated morbidity signs including hunched posture, lethargy, difficulty ambulating, and weight loss. Long-term survival was defined as 90 days post-tumor implantation.
Tumor rechallenge
All animals that have reached long-term survival were re-challenged with GL261-luc cells (260,000) in 2μL dPBS injected into the contralateral hemisphere, 2 mm anterior and 2 mm lateral to lambda. Five naïve mice were used as controls. Tumor burden was assessed using IVIS imaging on day 7 after implantation. Animals were euthanized when they demonstrated morbidity signs including hunched posture, lethargy, difficulty ambulating, and weight loss. After 90 days post-rechallenge implantation, all remaining mice were euthanized.
Immune cell isolation
Animals were sacrificed on days 13, 20, and 25 using i.p. injection of ketamine-xylazine solution and perfused with dPBS. Spleens, brains, and draining cervical lymph nodes (CLN) were carefully dissected from surrounding tissues and processed for flow cytometry analysis.
Spleens were mechanically homogenized in harvest media consisting of Roswell Park Memorial Institute (RPMI-1640) medium, 10% FBS, and 1% penicillin-streptomycin. The homogenized solution was passed through 70μm filters (BD Falcon). Red blood cells were lysed using 2 mL ammonium-chloride-potassium (ACK) lysing buffer (Quality Biological) for 3 minutes. Splenocytes were washed with dPBS and resuspended in 5 mL harvest media. Lymph nodes were mechanically homogenized into harvest media. The solution was centrifuged at 200 g for 5 minutes, after which the pellet was resuspended in 200 uL harvest media.
Brains were homogenized in DNase I (Sigma-Aldrich) and collagenase IV (20 mg/mL, Worthington Biochemical) enzyme mix. Samples were further mechanically dissociated using a gentleMACS Dissociator (Milltenyi Biotec). The cell suspensions were filtered through 70 μm strainers and resuspended in 10 mL of 30% Percoll. A 1 mL layer of 70% Percoll solution was placed beneath the cell suspension. Samples were carefully centrifuged at 850 g for 30 minutes without break so as to not disturb the gradient. Cells at the 30%/70% interface were collected and washed with dPBS.
Flow cytometry
Isolated immune cells were plated for staining. Samples of the T cell panel were stimulated in 200μL RPMI containing ionomycin (1:2000, Sigma-Aldrich), phorbol 12-myristate 13-acetate (PMA, 1:2000, Sigma-Aldrich), and Golgi Stop (1:500, BD Biosciences) for 4 hours at 37°C and was washed after in dPBS. Live/Dead Aqua AmCyan (Thermo Fisher Scientific) was used to assess for live and dead cells. Lymphocytes were stained for extracellular markers including CD45 APC/Cy7 (clone 30-F11, BioLegend), CD3 PerCP/Cy5.5 or BV421 (clone 17A2, BioLegend), CD4 Pacific Blue or FITC (clone RM4-4, eBioscience), CD8 BV605 (clone 53–6.7, BioLegend), PD1 PeCy7 (clone J43, eBioscience), TIGIT PE (clone 1G9, BioLegend), and/or CD226 APC (clone 10E5, BioLegend). Samples were fixed in 1:3 fixation/permeabilization buffer (eBioscience) overnight. Cells were subsequently stained for IFNγ PeCy7 (clone XMG1.2, eBioscience), TNFα (clone MP6-XT22, eBioscience), and/or FoxP3-AF700 (FJK-16 s, eBioscience) in intracellular permeabilization buffer. For the myeloid panel, cells were stained for CD45 APC/Cy7 (clone 30-F11, BioLegend), Ly6G BV421 (clone 1A8, BioLegend), Ly6 C BV605 (clone HK1.6, BioLegend), CD11 c FITC (clone N418, BioLegend), CD11b AF700 (clone M1/70, BioLegend), F4/80 PeCy7 (clone BM8, BioLegend), and IA/IE PerCP/Cy5.5 (clone M5/114.15.2, BioLegend).
Samples were processed using LSR II flow cytometer (BD Biosciences). Data was analyzed using FlowJo v10.2 (FlowJo, LLC). Lymphocytes were gated to exclude doublets and dead cells, and distinct cell populations were further identified (Figs. S1A and S2). Fluorescence Minus One (FMO) controls were used to interpret populations including TIGIT, PD-1, CD226, IFNγ, TNFα, FoxP3, and IA/IE. After setting the initial gating based on FMO controls, each sample was visually inspected to ensure appropriate gating. For samples with distinct cell populations and deviations from the initial gating, the gating was adjusted to appropriately reflect this observation.
Survival analysis in patients
The Cancer Genome Atlas (TCGA) database was used to assess survival of patients with GBM or low-grade glioma (LGG) in setting of PVR (CD155) expression on tumor cells. Survival analysis was performed through the cBioPortal platform as previously described.Citation66,Citation67 Kaplan-Meier survival curves were used to represent overall survival.
Statistical analysis
Survival was represented via Kaplan-Meier survival curves and compared using log-rank Mantel Cox test. One-way analysis of variance (ANOVA) with Tukey's multiple comparisons test was used to compare across multiple groups. Grubbs test was used to assess for outliers. All values were reported as mean ± standard error of the mean (SEM). Statistical significance was defined as p < 0.05. All analyses were performed using GraphPad Prism 7.
Disclosures
This research was partly supported by Bristol-Myers-Squibb, who kindly provided the therapeutic anti-TIGIT and anti-PD-1 antibodies, and by the Bloomberg-Kimmel Institute for Cancer Immunotherapy and CCSG Core Grant (Dr. Nelson, PI).
Additional information
Funding
Notes on contributors
Henry Brem
Henry Brem, MD: Arbor Pharmaceuticals, Bristol-Myers Squibb, and Accurexa, Consultant for AsclepiX Therapeutics, Celsion-EGEN, Perosphere Inc., StemGen, Accelerating Combination Therapies, Camden Partners, LikeMinds, Inc, Acuity Bio Corp
Drew M. Pardoll
Drew Pardoll, MD, PhD: Grants from Bristol-Myers-Squibb and Melanoma Research Alliance; personal fees from Five Prime Therapeutics, Aduro, Compugen, GlaxoSmithKline, Medimmune/AstraZeneca, Merck, Potenza Therapeutics, Sanofi, Tizona, DNatrix, Amgen, Rock Springs Capital, Immunomic Therapeutics, Janssen, Astellas, WindMill Therapeutics, Bayer. Patent for biomarkers useful for determining response to PD-1 blockade pending, patent for cancer therapy via combination of epigenetic modulation and immune modulation pending, patent for method of preventing organ transplant rejections using agonists to PD-1 checkpoint pathway pending, patent for cancer immunotherapy pending, patent for compositions and methods for targeting activin signaling to treat cancer pending, patent for combinatorial therapy of cancer and infectious diseases with anti-B7-H1 antibodies pending, patent for combination of immunotherapy with local chemotherapy for the treatment of malignancies pending, patent for inhibition of YAP for breaking tumor immune tolerance pending, patent for compositions and methods for cancer immunotherapy licensed to Aduro Biotech, and a patent for T cell regulation licensed to Bristol- Myers-Squibb.
Michael Lim
Michael Lim, MD: Research support: Arbor, Aegenus, Altor, BMS, Immunocellular, Celldex, Accuray. Consultant: Aegenus, BMS, Regeneron, Oncorus, Boston Biomedical. Non-research: Consultant of Stryker, Baxter
References
- Stupp R, Hegi ME, Mason WP, van den Bent MJ, Taphoorn MJB, Janzer RC, Ludwin SK, Allgeier A, Fisher B, Belanger K, et al. Effects of radiotherapy with concomitant and adjuvant temozolomide versus radiotherapy alone on survival in glioblastoma in a randomised phase III study: 5-year analysis of the EORTC-NCIC trial. Lancet Oncol. 2009;10:459–66. doi:10.1016/S1470-2045(09)70025-7. PMID:19269895.
- Delgado-López PD, Corrales-García EM. Survival in glioblastoma: a review on the impact of treatment modalities. Clin Transl Oncol. 2016;18:1062–71. doi:10.1007/s12094-016-1497-x. PMID:26960561.
- Feng E, Sui C, Wang T, Sun G. Temozolomide with or without radiotherapy in patients with newly diagnosed glioblastoma multiforme: A Meta-Analysis. Eur Neurol. 2017;77:201–10. doi:10.1159/000455842. PMID:28192785.
- Pardoll DM. The blockade of immune checkpoints in cancer immunotherapy. Nat Rev Cancer 2012;12:252–64. doi:10.1038/nrc3239. PMID:22437870.
- Zou W, Chen L. Inhibitory B7-family molecules in the tumour microenvironment. Nat Rev Immunol. 2008;8:467–77. doi:10.1038/nri2326. PMID:18500231.
- Vesely MD, Kershaw MH, Schreiber RD, Smyth MJ. Natural innate and adaptive immunity to cancer. Annu Rev Immunol. 2011;29:235–71. doi:10.1146/annurev-immunol-031210-101324. PMID:21219185.
- Hung AL, Garzon-Muvdi T, Lim M. Biomarkers and Immunotherapeutic Targets in Glioblastoma. World Neurosurg. 2017;102:494–506. doi:10.1016/j.wneu.2017.03.011. PMID:28300714.
- Brahmer JR, Drake CG, Wollner I, Powderly JD, Picus J, Sharfman WH, Stankevich E, Pons A, Salay TM, McMiller TL, et al. Phase I study of single-agent anti-programmed death-1 (MDX-1106) in refractory solid tumors: safety, clinical activity, pharmacodynamics, and immunologic correlates. J Clin Oncol. 2010;28:3167–75. doi:10.1200/JCO.2009.26.7609. PMID:20516446.
- Hamid O, Robert C, Daud A, Hodi FS, Hwu W-J, Kefford R, Wolchok JD, Hersey P, Joseph RW, Weber JS, et al. Safety and tumor responses with lambrolizumab (anti-PD-1) in melanoma. N Engl J Med. 2013;369:134–44. doi:10.1056/NEJMoa1305133. PMID:23724846.
- Rizvi NA, Mazières J, Planchard D, Stinchcombe TE, Dy GK, Antonia SJ, Horn L, Lena H, Minenza E, Mennecier B, et al. Activity and safety of nivolumab, an anti-PD-1 immune checkpoint inhibitor, for patients with advanced, refractory squamous non-small-cell lung cancer (CheckMate 063): a phase 2, single-arm trial. Lancet Oncol. 2015;16:257–65. doi:10.1016/S1470-2045(15)70054-9. PMID:25704439.
- Wainwright DA, Chang AL, Dey M, Balyasnikova IV, Kim CK, Tobias A, Cheng YY, Kim JW, Qiao J, Zhang L, et al. Durable therapeutic efficacy utilizing combinatorial blockade against IDO, CTLA-4, and PD-L1 in mice with brain tumors. Clin Cancer Res. 2014;20:5290–301. doi:10.1158/1078-0432.CCR-14-0514. PMID:24691018.
- Kim JE, Patel MA, Mangraviti A, Kim ES, Theodros D, Velarde E, Liu A, Sankey E, Tam A, Xu H, et al. Combination therapy with anti-PD-1, anti-TIM-3, and focal radiation results in regression of murine gliomas. Clin Cancer Res. 2016;23:124–36. doi:10.1158/1078-0432.CCR-15-1535. PMID:27358487.
- Dougall WC, Kurtulus S, Smyth MJ, Anderson AC. TIGIT and CD96: new checkpoint receptor targets for cancer immunotherapy. Immunol Rev. 2017;276:112–20. doi:10.1111/imr.12518. PMID:28258695.
- Manieri NA, Chiang EY, Grogan JL. TIGIT: A Key Inhibitor of the Cancer Immunity Cycle. Trends Immunol. 2017;38:20–8. doi:10.1016/j.it.2016.10.002. PMID:27793572.
- Liu X, Hou M, Liu Y. TIGIT, a novel therapeutic target for tumor immunotherapy. Immunol Invest. 2017;46:172–82. doi:10.1080/08820139.2016.1237524. PMID:27819527.
- Yu X, Harden K, C Gonzalez L, Francesco M, Chiang E, Irving B, Tom I, Ivelja S, Refino CJ, Clark H, et al. The surface protein TIGIT suppresses T cell activation by promoting the generation of mature immunoregulatory dendritic cells. Nat Immunol. 2009;10:48–57. doi:10.1038/ni.1674. PMID:19011627.
- Lozano E, Dominguez-Villar M, Kuchroo V, Hafler DA. The TIGIT/CD226 axis regulates human T cell function. J Immunol. 2012;188:3869–75. doi:10.4049/jimmunol.1103627. PMID:22427644.
- Stanietsky N, Rovis TL, Glasner A, Seidel E, Tsukerman P, Yamin R, Enk J, Jonjic S, Mandelboim O. Mouse TIGIT inhibits NK-cell cytotoxicity upon interaction with PVR. Eur J Immunol. 2013;43:2138–50. doi:10.1002/eji.201243072. PMID:23677581.
- Chauvin J-M, Pagliano O, Fourcade J, Sun Z, Wang H, Sander C, Kirkwood JM, Chen TT, Maurer M, Korman AJ, et al. TIGIT and PD-1 impair tumor antigen-specific CD8+ T cells in melanoma patients. J Clin Invest. 2015;125:2046–58. doi:10.1172/JCI80445. PMID:25866972.
- Kurtulus S, Sakuishi K, Ngiow S-F, Joller N, Tan DJ, Teng MWL, Smyth MJ, Kuchroo VK, Anderson AC. TIGIT predominantly regulates the immune response via regulatory T cells. J Clin Invest. 2015;125:4053–62. doi:10.1172/JCI81187. PMID:26413872.
- Johnston RJ, Comps-Agrar L, Hackney J, Yu X, Huseni M, Yang Y, Park S, Javinal V, Chiu H, Irving B, et al. The immunoreceptor TIGIT regulates antitumor and antiviral CD8 + T cell effector function. Cancer Cell. 2014;26:923–37. doi:10.1016/j.ccell.2014.10.018. PMID:25465800.
- Kong Y, Zhu L, Schell TD, Zhang J, Claxton DF, Ehmann WC, Rybka WB, George MR, Zeng H, Zheng H. T-Cell Immunoglobulin and ITIM Domain (TIGIT) Associates with CD8+ T-Cell exhaustion and poor clinical outcome in AML patients. Clin Cancer Res. 2016;22:3057–66. doi:10.1158/1078-0432.CCR-15-2626. PMID:26763253.
- Sloan KE, Eustace BK, Stewart JK, Zehetmeier C, Torella C, Simeone M, Roy JE, Unger C, Louis DN, Ilag LL, et al. CD155/PVR plays a key role in cell motility during tumor cell invasion and migration. BMC Cancer 2004;4:73. doi:10.1186/1471-2407-4-73. PMID:15471548.
- Woroniecka K, Chongsathidkiet P, Rhodin KE, Kemeny HR, Dechant CA, Farber SH, Elsamadicy AA, Cui X, Koyama S, Jackson CC, et al. T Cell exhaustion signatures vary with tumor type and are severe in glioblastoma. Clin Cancer Res. 2018; clincanres.1846.2017. doi:10.1158/1078-0432.CCR-17-1846. PMID:29437767. [ahead of print].
- Koyama S, Akbay EA, Li YY, Herter-Sprie GS, Buczkowski KA, Richards WG, Gandhi L, Redig AJ, Rodig SJ, Asahina H, et al. Adaptive resistance to therapeutic PD-1 blockade is associated with upregulation of alternative immune checkpoints. Nat Commun. 2016;7:10501. doi:10.1038/ncomms10501. PMID:26883990.
- Belcaid Z, Phallen JA, Zeng J, See AP, Mathios D, Gottschalk C, Nicholas S, Kellett M, Ruzevick J, Jackson C, et al. Focal radiation therapy combined with 4-1BB activation and CTLA-4 blockade yields long-term survival and a protective antigen-specific memory response in a murine glioma model. PLoS One 2014;9:e101764. doi:10.1371/journal.pone.0101764. PMID:25013914.
- Chaudhary B, Elkord E. Regulatory T Cells in the tumor microenvironment and cancer progression: Role and therapeutic targeting. Vaccines 2016;4. doi:10.3390/vaccines4030028. PMID:27509527.
- Facciabene A, Motz GT, Coukos G. T-regulatory cells: key players in tumor immune escape and angiogenesis. Cancer Res. 2012;72:2162–71. doi:10.1158/0008-5472.CAN-11-3687. PMID:22549946.
- Takeuchi Y, Nishikawa H. Roles of regulatory T cells in cancer immunity. Int Immunol. 2016;28:401–9. doi:10.1093/intimm/dxw025. PMID:27160722.
- Curiel TJ, Wei S, Dong H, Alvarez X, Cheng P, Mottram P, Krzysiek R, Knutson KL, Daniel B, Zimmermann MC, et al. Blockade of B7-H1 improves myeloid dendritic cell-mediated antitumor immunity. Nat Med. 2003;9:562–7. doi:10.1038/nm863. PMID:12704383.
- Aspord C, Pedroza-Gonzalez A, Gallegos M, Tindle S, Burton EC, Su D, Marches F, Banchereau J, Palucka AK. Breast cancer instructs dendritic cells to prime interleukin 13–secreting CD4 + T cells that facilitate tumor development. J Exp Med. 2007;204:1037–47. doi:10.1084/jem.20061120. PMID:17438063.
- Norian LA, Rodriguez PC, O'Mara LA, Zabaleta J, Ochoa AC, Cella M, Allen PM. Tumor-infiltrating regulatory dendritic cells inhibit CD8+ T cell function via L-arginine metabolism. Cancer Res. 2009;69:3086–94. doi:10.1158/0008-5472.CAN-08-2826. PMID:19293186.
- Kumar R, de Mooij T, Peterson TE, Kaptzan T, Johnson AJ, Daniels DJ, Parney IF. Modulating glioma-mediated myeloid-derived suppressor cell development with sulforaphane. PLoS One 2017;12:e0179012. doi:10.1371/journal.pone.0179012. PMID:28666020.
- Chae M, Peterson TE, Balgeman A, Chen S, Zhang L, Renner DN, Johnson AJ, Parney IF. Increasing glioma-associated monocytes leads to increased intratumoral and systemic myeloid-derived suppressor cells in a murine model. Neuro Oncol. 2015;17:978–91. doi:10.1093/neuonc/nou343. PMID:25537019.
- Raychaudhuri B, Rayman P, Huang P, Grabowski M, Hambardzumyan D, Finke JH, Vogelbaum MA. Myeloid derived suppressor cell infiltration of murine and human gliomas is associated with reduction of tumor infiltrating lymphocytes. J Neurooncol. 2015;122:293–301. doi:10.1007/s11060-015-1720-6. PMID:25579983.
- Leite KRM, Reis ST, Junior JP, Zerati M, Gomes D de O, Camara-Lopes LH, Srougi M. PD-L1 expression in renal cell carcinoma clear cell type is related to unfavorable prognosis. Diagn Pathol. 2015;10:189. doi:10.1186/s13000-015-0414-x. PMID:26470780.
- Qin T, Zeng Y, Qin G, Xu F, Lu J, Fang W, Xue C, Zhan J, Zhang X, Zheng Q, et al. High PD-L1 expression was associated with poor prognosis in 870 Chinese patients with breast cancer. Oncotarget. 2015;6:33972–81. doi:10.18632/oncotarget.5583. PMID:26378017.
- Zhu H, Qin H, Huang Z, Li S, Zhu X, He J, Yang J, Yu X, Yi X. Clinical significance of programmed death ligand-1 (PD-L1) in colorectal serrated adenocarcinoma. Int J Clin Exp Pathol. 2015;8:9351–9. PMID:26464688.
- Nduom EK, Wei J, Yaghi NK, Huang N, Kong L-Y, Gabrusiewicz K, Ling X, Zhou S, Ivan C, Chen JQ, et al. PD-L1 expression and prognostic impact in glioblastoma. Neuro Oncol. 2016;18:195–205. doi:10.1093/neuonc/nov172. PMID:26323609.
- Gao X, Zhu Y, Li G, Huang H, Zhang G, Wang F, Sun J, Yang Q, Zhang X, Lu B, et al. TIM-3 Expression Characterizes Regulatory T Cells in Tumor Tissues and Is Associated with Lung Cancer Progression. PLoS One 2012;7:e30676. doi:10.1371/journal.pone.0030676. PMID:22363469.
- Li F-J, Zhang Y, Jin G-X, Yao L, Wu D-Q. Expression of LAG-3 is coincident with the impaired effector function of HBV-specific CD8+ T cell in HCC patients. Immunol Lett. 2013;150:116–22. doi:10.1016/j.imlet.2012.12.004. PMID:23261718.
- Salvi S, Fontana V, Boccardo S, Merlo DF, Margallo E, Laurent S, Morabito A, Rijavec E, Dal Bello MG, Mora M, et al. Evaluation of CTLA-4 expression and relevance as a novel prognostic factor in patients with non-small cell lung cancer. Cancer Immunol Immunother 2012;61:1463–72. doi:10.1007/s00262-012-1211-y. PMID:22318401.
- Zeng J, See AP, Phallen J, Jackson CM, Belcaid Z, Ruzevick J, Durham N, Meyer C, Harris TJ, Albesiano E, et al. Anti-PD-1 blockade and stereotactic radiation produce long-term survival in mice with intracranial gliomas. Int J Radiat Oncol Biol Phys. 2013;86:343–9. doi:10.1016/j.ijrobp.2012.12.025. PMID:23462419.
- Topalian SL, Hodi FS, Brahmer JR, Gettinger SN, Smith DC, McDermott DF, Powderly JD, Carvajal RD, Sosman JA, Atkins MB, et al. Safety, activity, and immune correlates of anti-PD-1 antibody in cancer. N Engl J Med. 2012;366:2443–54. doi:10.1056/NEJMoa1200690. PMID:22658127.
- Leach DR, Krummel MF, Allison JP. Enhancement of antitumor immunity by CTLA-4 blockade. Science 1996;271:1734–6. doi:10.1126/science.271.5256.1734. PMID:8596936.
- Camacho LH, Antonia S, Sosman J, Kirkwood JM, Gajewski TF, Redman B, Pavlov D, Bulanhagui C, Bozon VA, Gomez-Navarro J, et al. Phase I/II trial of tremelimumab in patients with metastatic melanoma. J Clin Oncol. 2009;27:1075–81. doi:10.1200/JCO.2008.19.2435. PMID:19139427.
- Fecci PE, Ochiai H, Mitchell DA, Grossi PM, Sweeney AE, Archer GE, Cummings T, Allison JP, Bigner DD, Sampson JH. Systemic CTLA-4 blockade ameliorates glioma-induced changes to the CD4+ T cell compartment without affecting regulatory T-cell function. Clin Cancer Res. 2007;13:2158–67. doi:10.1158/1078-0432.CCR-06-2070. PMID:17404100.
- Sakuishi K, Apetoh L, Sullivan JM, Blazar BR, Kuchroo VK, Anderson AC. Targeting Tim-3 and PD-1 pathways to reverse T cell exhaustion and restore anti-tumor immunity. J Exp Med. 2010;207:2187–94. doi:10.1084/jem.20100643. PMID:20819927.
- Lieberman F.. Glioblastoma update: molecular biology, diagnosis, treatment, response assessment, and translational clinical trials. F1000Research 2017;6:1892. doi:10.12688/f1000research.11493.1. PMID:29263783.
- Böker DK, Kalff R, Gullotta F, Weekes-Seifert S, Möhrer U. Mononuclear infiltrates in human intracranial tumors as a prognostic factor. Influence of preoperative steroid treatment. I. Glioblastoma. Clin Neuropathol 1984;3:143–7. PMID:6478676.
- Brooks WH, Markesbery WR, Gupta GD, Roszman TL. Relationship of lymphocyte invasion and survival of brain tumor patients. Ann Neurol. 1978;4:219–24. doi:10.1002/ana.410040305. PMID:718133.
- Palma L, Di Lorenzo N, Guidetti B. Lymphocytic infiltrates in primary glioblastomas and recidivous gliomas. J Neurosurg. 1978;49:854–61. doi:10.3171/jns.1978.49.6.0854. PMID:731302.
- Slifka MK, Whitton JL. Phenotypic Markers Distinguished by Their Cytokine Profiles and T Cells Can Be + Activated and Memory CD8 Activated and Memory CD8 □ T Cells Can Be Distinguished by Their Cytokine Profiles and Phenotypic Markers. J Immunol by guest January 2000;164:208–16. doi:10.4049/jimmunol.164.1.208.
- Ding Z-C, Huang L, Blazar BR, Yagita H, Mellor AL, Munn DH, Zhou G. Polyfunctional CD4+ T cells are essential for eradicating advanced B-cell lymphoma after chemotherapy. Blood 2012;120:2229–39. doi:10.1182/blood-2011-12-398321. PMID:22859605.
- Carswell EA, Old LJ, Kassel RL, Green S, Fiore N, Williamson B. An endotoxin-induced serum factor that causes necrosis of tumors. Proc Natl Acad Sci U S A 1975;72:3666–70. doi:10.1073/pnas.72.9.3666. PMID:1103152.
- Sato N, Fukuda K, Nariuchi H, Sagara N. Tumor necrosis factor inhibiting angiogenesis in vitro. J Natl Cancer Inst. 1987;79:1383–91. PMID:2447319.
- Sidky YA, Borden EC. Inhibition of angiogenesis by interferons: effects on tumor- and lymphocyte-induced vascular responses. Cancer Res. 1987;47:5155–61. PMID:2441862.
- Saiki I, Sato K, Yoo YC, Murata J, Yoneda J, Kiso M, Hasegawa A, Azuma I. Inhibition of tumor-induced angiogenesis by the administration of recombinant interferon-gamma followed by a synthetic lipid-A subunit analogue (GLA-60). Int J cancer. 1992;51:641–5. doi:10.1002/ijc.2910510422. PMID:1376302.
- Saleh M, Jonas NK, Wiegmans A, Stylli SS. The treatment of established intracranial tumors by in situ retroviral IFN-γ transfer. Gene Ther. 2000;7:1715–24. doi:10.1038/sj.gt.3301273. PMID:11083492.
- Beissert S, Schwarz A, Schwarz T. Regulatory T cells. J Invest Dermatol. 2006;126:15–24. doi:10.1038/sj.jid.5700004. PMID:16417213.
- Jacobs JFM, Idema AJ, Bol KF, Nierkens S, Grauer OM, Wesseling P, Grotenhuis JA, Hoogerbrugge PM, de Vries IJM, Adema GJ. Regulatory T cells and the PD-L1/PD-1 pathway mediate immune suppression in malignant human brain tumors. Neuro Oncol. 2009;11:394–402. doi:10.1215/15228517-2008-104. PMID:19028999.
- Sonabend AM, Rolle CE, Lesniak MS. The role of regulatory T cells in malignant glioma. Anticancer Res. 28:1143–50. PMID:18505050.
- Okita Y, Tanaka H, Ohira M, Muguruma K, Kubo N, Watanabe M, Fukushima W, Hirakawa K. Role of tumor-infiltrating CD11b+ antigen-presenting cells in the progression of gastric cancer. J Surg Res. 2014;186:192–200. doi:10.1016/j.jss.2013.08.024. PMID:24120241.
- Lin A, Schildknecht A, Nguyen LT, Ohashi PS. Dendritic cells integrate signals from the tumor microenvironment to modulate immunity and tumor growth. Immunol Lett. 2010;127:77–84. doi:10.1016/j.imlet.2009.09.003. PMID:19778555.
- Nakahara T, Oba J, Shimomura C, Kido-Nakahara M, Furue M. Early Tumor-Infiltrating Dendritic Cells Change their Characteristics Drastically in Association with Murine Melanoma Progression. J Invest Dermatol. 2016;136:146–53. doi:10.1038/JID.2015.359. PMID:26763434.
- Gao J, Aksoy BA, Dogrusoz U, Dresdner G, Gross B, Sumer SO, Sun Y, Jacobsen A, Sinha R, Larsson E, et al. Integrative analysis of complex cancer genomics and clinical profiles using the cBioPortal. Sci Signal. 2013;6:pl1-. doi:10.1126/scisignal.2004088. PMID:23550210.
- Cerami E, Gao J, Dogrusoz U, Gross BE, Sumer SO, Aksoy BA, Jacobsen A, Byrne CJ, Heuer ML, Larsson E, et al. The cBio cancer genomics portal: an open platform for exploring multidimensional cancer genomics data. Cancer Discov. 2012;2:401–4. doi:10.1158/2159-8290.CD-12-0095. PMID:22588877.