
ABSTRACT
Immune evasion is an important driver of disease progression in the plasma cell malignancy multiple myeloma. Recent work highlights the potential of epigenetic modulating agents as tool to enhance anti-tumor immunity. The immune modulating effects of the combination of a DNA methyltransferase inhibitor and a histone deacetylase inhibitor in multiple myeloma is insufficiently characterized. Therefore, we used the murine immunocompetent 5T33MM model to investigate hallmarks of immunogenic cell death as well as alterations in the immune cell constitution in the bone marrow of diseased mice in response to the DNA methyltransferase inhibitor decitabine and the histone deacetylase inhibitor quisinostat. Vaccination of mice with 5T33 cells treated with epigenetic compounds delayed tumor development upon a subsequent tumor challenge. In vitro, epigenetic treatment induced ecto-calreticulin and CD47, as well as a type I interferon response. Moreover, treated 5T33vt cells triggered dendritic cell maturation. The combination of decitabine and quisinostat in vivo resulted in combinatory anti-myeloma effects. In vivo, epigenetic treatment increased tumoral ecto-calreticulin and decreased CD47 and PD-L1 expression, increased dendritic cell maturation and reduced CD11b positive cells. Moreover, epigenetic treatment induced a temporal increase in presence of CD8-positive and CD4-positive T cells with naive and memory-like phenotypes based on CD62L and CD44 expression levels, and reduced expression of exhaustion markers PD-1 and TIM3. In conclusion, a combination of a DNA methyltransferase inhibitor and a histone deacetylase inhibitor increased the immunogenicity of myeloma cells and altered the immune cell constitution in the bone marrow of myeloma-bearing mice.
Introduction
A major hallmark of cancer is immune evasion which can occur at different levels of the immune response cycle.Citation1,Citation2 This includes the improper stimulation of dendritic cells (DCs) during tolerogenic cell death, the inefficient priming of naive T cells, absence or dysfunctionality of effector immune cells, improper antigen presentation by tumor cells and an immunosuppressive tumor microenvironment.Citation3,Citation4 In multiple myeloma (MM), the immune system is compromised at multiple levels. MM cells express immunosuppressive cytokines and molecules such as IL6, IL10, TGFβ, PD-L1, CD28, CD200 and ICOS-L which negatively influence DC and T cell function. Moreover, regulatory T cells, and (immature) myeloid cells inhibit effector anti-MM responses.Citation5,Citation6 Strategies are being developed to circumvent these immune escape mechanisms and include checkpoint inhibition, vaccination, adoptive T cell transfer and targeting of immunosuppressive populations.Citation7
Epigenetic modulating agents (EMAs) including DNA methyltransferase inhibitors (DNMTi) and histone deacetylase inhibitors (HDACi) have been shown to modulate anti-tumor immune responses in various cancer models.Citation8–Citation10 In MM patients, combining lenalidomide and the DNMTi azacytidine stimulated an adaptive immune response by inducing the expression of antigens.Citation11 DNMTi and HDACi induced MAGE-A3 expression in primary MM cells, thereby stimulating recognition by MAGE-A3 cytotoxic T lymphocytes (CTLs).Citation12 The HDACi valproic acid induced natural killer (NK) ligands in MM cells and potentiated NK cell-mediated lysis.Citation13 We demonstrated that in vivo treatment of 5T33MM diseased mice with the HDACi quisinostat (Quis) and the DNMTi decitabine (DAC) results in the upregulation of genes involved in immune regulation.Citation14 Mechanistically, it Chiappinelli et al. demonstrated that DNMTi induce a type I interferon (IFN) response due to viral mimicry.Citation15 Moreover, enhanced anti-tumor immunity by combining DNMTi with HDACi involves type I IFN, MYC depletion and profound alterations in the tumor microenvironment.Citation9,Citation10
To our knowledge, pre-clinical work on the immune modulating effects of combining DNMTi and HDACi in MM is limited. In this study, we report on the immunomodulatory effects mediated by DNMTi and HDACi in the 5T33MM immunocompetent murine model for MM. Here, we studied hallmarks of immunogenic cell death (ICD) in addition to the immune cell constitution in the bone marrow (BM) microenvironment. ICD is a regulated form of cell death that is correlated with exposure and release of danger-associated molecular patterns (DAMPs) including cell-surface calreticulin, HMGB1, type I IFN, ANXA1 and ATP which are known to stimulate adaptive immune responses.Citation16 Therefore, the presence of DAMPs and associated components of an anti-myeloma immune response are interesting to study in the context of DNMTi and HDACi.
Results
Cell death is induced by low doses of decitabine and quisinostat
To study the hallmarks of ICD, it is needed to understand the timing and dosing at which cells die upon treatment. To optimize dosing for the combination of DAC and Quis for the 5T33vt cells, we monitored cell death and the molecular targets of the respective drugs using nanomolar concentrations of both drugs. DAC dose-dependently reduced DNMT1 expression after 1 day which was most pronounced with 100 nM. DNMT1 expression quickly recovered in the next two days. Cell death was increased dose-dependently and reached up to 30% of Annexin-V positive cells on day 3 (Supplementary Figure S1A, B). Quis induced acetylation of histone H3 and induced up to 30% of Annexin-V positivity on day 3 with 10 nM (Supplementary Figure S1C, D). We next determined cell death in a 1-day and 4-day combination setup. Therefore, we first treated cells with DAC for 3 days. For the 1-day or 4-day combination, Quis was added on day 6 or day 3, respectively. (Supplementary Figure S1E). The 4-day combination of 50 nM DAC and 5 nM Quis showed a significant induction of Annexin-V positivity on day 7 compared to single agents (Supplementary Figure S1F). In the combination setup, the levels of acetylated histone H3 were increased and DNMT1 expression was decreased confirming the on-target effects of the combination (Figure S1G). We have previously shown in human myeloma cell lines that this combination represses MYC transcriptional responses.Citation17 Similarly, MYC expression was downregulated in the murine 5T33vt cells upon treatment confirming the MYC-targeting effects of combining DNMTi and HDACi in MM (Supplementary Figure S1H). The combination effects were also observed with 100 nM DAC and 10 nM Quis which in the 4-day combination setup resulted in 70% Annexin-V positivity at day 6 and 80% at day 7 (Supplementary Figure S1I). As a comparison, the minimal single agent dose to reach these levels of cell death levels was 300 nM DAC and 20 nM of Quis. To be able to compare the ICD inducing effects of EMAs to chemotherapy, we treated 5T33vt cells with bortezomib (Bz), melphalan (Mel) and the known ICD-inducer mitoxantrone (Mtx). These compounds dose- and time-dependently induced cell death in the 5T33vt cells (Supplementary Figure S1J, K). To conclude, we determined the timing and dosages of EMAs and chemotherapy for the investigation of ICD hallmarks.
Vaccination with treated myeloma cells delays tumor progression
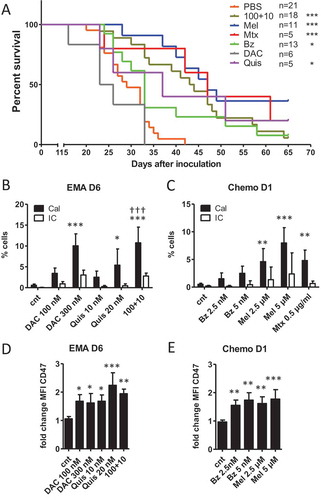
We investigated whether treated myeloma cells undergo bona fide ICD in response to EMAs, hence inducing a protective effect against tumor growth in a vaccination assay. The gold-standard approach to evaluate the ability of a specific stimulus to cause bona fide ICD relies on vaccination.Citation18 For vaccination, at least 80% of apoptotic cells is warranted. As such, we used the dosages as illustrated in Supplementary Figure S1I, K and used the treated 5T33vt cells as a vaccine in C57Bl/KaLwRij mice. Eight days later, mice were re-challenged with living 5T33vt cells. All vaccinations but DAC 300 nM resulted in a statistical significant delay in tumor progression as measured by time to reach 1500 mm3 tumor volume (). PBS-vaccinated mice had a median survival time of 29 day. Mice vaccinated with Mtx (0.5 µg/ml), Mel (5 µM) or Bz (5 nM)-treated cells reached a median survival of 47, 47 and 33 days, respectively. Vaccination with cells treated with Quis (20 nM), DAC (300 nM) or the combination (100+10) resulted in a median survival of 37, 24.5 and 43.5, respectively. For DAC, all mice developed tumor on the vaccine site making it impossible to follow-up tumor at the re-challenge site (Supplementary Table 3). For Bz, this was 5 out of 13 mice and for Quis, 1 out of 5 (Supplementary Table 3). In terms of protection, vaccination with Mel-treated cells reached 36% of tumor free mice at day 65. Mtx and Quis conferred 20% protection while the combination of DAC and Quis and Bz resulted in less than 10% of tumor free mice. To conclude, vaccination with treated 5T33vt cells delayed tumor progression upon challenge with living tumor cells. Protection against tumor formation was most evident in Mel, Mtx or Quis conditions.
Figure 1. Vaccination with treated 5T33vt cells induces a delay in tumor progression.
A: Murine 5T33vt myeloma cells were treated for 7 days with EMAs (DAC 300 nM, Quis 20 nM, combination 100+10) and 2 days with chemotherapy (Mel 5 µM, Bz 5 nM, Mtx 0.5 µg/ml) (Supplementary Figure S1E, I, K). Next, treated/dying cells were pelleted, dissolved in PBS and subcutaneously injected into naive C57Bl/KaLwRij mice in one flank as vaccine (n = 5–21). Each mouse received the content of 1 well dissolved in 200 µL PBS (starting amount of 5 x 10^5 cells). Eight days later, mice were injected subcutaneously on the contralateral side with 2 x 10^5 untreated 5T33vt cells in 200 µL PBS (tumor inoculation) and followed-up for tumor development. The graph represents Kaplan-Meier and statistics were done using log-rank test. B-E: 5T33vt cells were treated with indicated doses (n ≥ 4). For EMA treatment, we analyzed cells after 6 days of treatment. For chemotherapeutics, we analyzed cells after 1 day of treatment. B, C: Within 7AAD negative cells with normal FSC and SSC, we determined the percentage of calreticulin positive cells using flow cytometry.D, E: MFI of CD47 within 7AAD negative events. Bars and error bars represent mean and standard deviation. Statistics were done using One-Way-Anova. *, **, *** indicates p < 0.05, p < 0.001, p < 0.0001, respectively compared to control condition. †† indicates p < 0.001 compared to single agent treatments. (EMA = epigenetic modulating agents, Chemo = chemotherapy, Cal = calreticulin, IC = isotype control, Dx = day x, MFI = mean fluorescence intensity, cnt = control, DAC = decitabine, Quis = Quisinostat, Bz = Bortezomib, Mel = Melphalan, Mtx = Mitoxanthrone).
Ecto-calreticulin and increased CD47 positivity was observed in treated 5T33vt cells
The limited degree of protection observed with the vaccination assay questions whether ICD was induced. To gain better understanding in the molecular changes associated with ICD, we investigated which hallmarks of ICD are induced upon treatment with the different compounds. We evaluated the translocation of the “eat me signal” calreticulin to the cell membrane using flow cytometry. For this, we analyzed events with normal FSC and SSC (based on control conditions) and excluded permeabilized events based on 7AAD positivity because these can stain positive for intracellular calreticulin (Supplementary Figure S2). We observed a significant increase in the percentage of calreticulin positive/7AAD negative 5T33vt cells treated with DAC and the combination as well as Mel and Mtx (,). When we included what appears as 7AAD-negative events regardless of FSC/SSC properties, we identified a calreticulin-positive, FSC-low population for all compounds (Supplementary Figure S3A-E). This population size in percentage strongly correlated with the percentage of Annexin-V positive/7AAD negative events (Supplementary Figure S3F, G). We FACS-sorted this population to verify the morphology and identified that the majority are small dead cells without clear nucleus, explaining their negativity for 7AAD (Supplementary Figure S3H). Yet, a minority of the sorted cells contains a nucleus and probably represents the calreticulin positive population with normal FSC/SSC as observed in , D. We also analyzed the presence of the “don‘t eat me” signal CD47 which can negatively affect immune cell priming. We observed a significant increase in membrane expression (based on fold change of MFI which was corrected for isotype staining) of CD47 during treatment within the 7AAD negative population as shown for day 6 for epigenetic treatment and day 1 for chemotherapy (, ). Overlays for indicated conditions are shown in Supplementary Figure S4. To conclude, during cell death, we observed a low percentage of pre-apoptotic, ecto-calreticulin positive cells upon treatment. Alongside, we observed a more general increase in the tolerogenic signals phosphatidylserine and CD47.
Extracellular HMBG1 was not different upon treatment of 5T33vt cells
We next evaluated the release of HMGB1 in the culture supernatant upon treatment using ELISA and western blot. Using western blot, we detected a basal presence of mouse HMGB1 in control conditions, which was not altered upon treatment with either EMAs or chemotherapy (Supplementary Figure S5A, B). The concentration of HMGB1 was between 10 and 20 ng/ml as determined using ELISA (Supplementary Figure S5C). To conclude, the treatments did not result in higher HMGB1 release compared to untreated control conditions.
A type I interferon response was induced by EMAs and chemotherapy
Type I IFN contributes to ICD and can be elicited by several mechanisms. During chemotherapy, tumor cells undergo an endogenous type I IFN response due to the release of RNA during cell death which contributes to ICD.Citation19 DNA damaging agents also induce type I IFN due to dsDNA in the cytoplasm.Citation20 Epigenetic treatment induces a type I IFN response due to induction of endogenous retroviruses (ERVs).Citation9,Citation10,Citation15 We evaluated the expression of three ERVs (ERV-3, MuMLV and Syncytin-a) upon EMA treatment. Syncytin-a was significantly upregulated by the combination of DAC and Quis (Supplementary Figure S6A), while the other tested ERVs remained undetected (data not shown). We next analyzed the expression of Ifnb and interferon stimulated genes Mx1, Ifi27, Oasl2 and Cxcl10 using qRT-PCR. We treated 5T33vt cells with EMAs, Mel and Bz with a less toxic dose compared to the experiments for the vaccination to increase the possibility to capture this transcriptional response. For DAC and Quis, we used 50 nM and 5 nM respectively and treated cells up to 7 days with single agents, or a 1-day and 4-day combination treatment (Supplementary Figure S1F). The expression of the tested genes Ifnb, Mx1, Oasl2 and Ifi27 was significantly higher in the 4-day combination treatment compared to single agents. In case of Cxcl10, single or combination treatment induced similar levels of expression (). ELISA confirmed the induction of IFN-β protein in the DAC and combination treatment (Supplementary Figure S6B). Mel (2.5 µM), and to a lesser extent Bz (2.5 nM), also induced the expression of Ifnb and Mx1, Ifi27, Oasl2 and Cxcl10 (, ). Taken together, EMA and chemotherapy treatment can induce a type I IFN response in murine 5T33vt myeloma cells.
Figure 2. Type I interferon gene expression is induced upon treatment of 5T33vt cells.
Murine 5T33vt myeloma cells were treated with indicated doses of EMAs for 7 days (A), Mel for 1 day (B) or Bz up to two days (C). Next, RNA was isolated and subjected to qRT-PCR to analyze the expression of a panel of type I IFN genes (n ≥ 4). Bars and error bars represent mean and standard deviation. Statistics were done using One-Way-Anova for multiple group comparisons (A) and Mann-Whitney test for two groups (B, C). *, **, *** indicates p < 0.05, p < 0.001, p < 0.0001. (cnt = control, DAC = decitabine, Quis = Quisinostat, Bz = Bortezomib, Mel = Melphalan, Mtx = Mitoxanthrone, Dx = day x).
Epigenetic treated cells induced dendritic cell maturation
Evaluation of hallmarks of ICD shows that treatment of 5T33vt cells with EMAs and chemotherapy does not seem to initiate full blown ICD, therefore prompting the question whether the treated 5T33vt cells could activate DCs, a critical first step in the induction of anti-tumor immune responses. We analyzed the expression of maturation markers on DCs co-cultured with treated 5T33vt cells. Our antibody panels were designed to detect double positivity for MCHI and CD40 or CD80 and for MHCII and CD86. Upon co-culture of DCs with dying tumor cells, we observed that EMA-treated cells induced maturation markers in DCs, namely double positivity for MHCI and CD40 and CD80 and for MHC-II and CD86 (). The effect was most pronounced with the combination of DAC and Quis but did not reach statistical significance compared to single agent treatment. Mel- and Mtx-treated 5T33vt cells induced significant changes in MHC-I and CD40 double positivity while there was only a trend for Bz-treated cells. Of interest, conditioned medium of combination- and Mtx-treated 5T33vt cells also induced double positivity for MHCII and CD86. To conclude, DCs that were co-cultured with 5T33vt cells treated with EMAs and to a lesser extent Mel or Mtx show signs of activation.
Figure 3. Maturation markers are upregulated on dendritic cells upon co-culture with EMA treated 5T33vt cells.
Murine 5T33vt myeloma cells were treated with indicated doses for 7 days with EMAs and 2 days with chemotherapy (Supplementary Figure S1I, K). Next, treated 5T33vt cells from 1 well or supernatant of treated cells was used for co-culture with primary murine DCs. One day later, DCs were analyzed for the presence of maturation markers within CD11c (+), F/40 (-), CD19 (-), CD3 (-) 7AAD (-) events. LPS was used a positive control for DC maturation.Left: Double positive for CD80/MHC-I. Middle: Double positive for CD40/MHC-I.Right: Double positive for CD86/MHC-II. Bars and error bars represent mean and standard deviation. Statistics were done using One-Way-Anova. *, **, *** indicates p < 0.05, p < 0.001, p < 0.0001, respectively. (DC = dendritic cell, cnt = control, DAC = decitabine, Quis = Quisinostat, Bz = Bortezomib, Mel = Melphalan, Mtx = Mitoxanthrone, LPS = lipopolysaccharide).
In vivo treatment with DAC and Quis increased tumor calreticulin and MHCII expression while CD47 and PDL1 was reduced
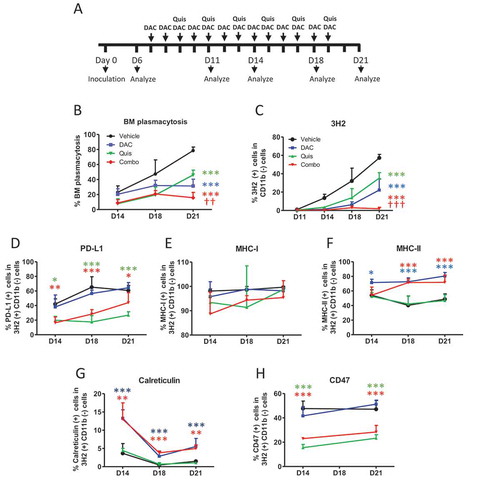
So far, we have shown that EMA-treated 5T33vt cells are able to induce DC maturation. Of the investigated ICD hallmarks, ecto-calreticulin positive cells could be detected and a type I IFN response can be induced. We next investigated whether in vivo DAC and Quis can induce changes in the 5T33MM model which could enhance the immunogenicity. From day 6 after inoculation, we treated mice for three days with DAC. At this point, we started the combination treatment which was repeated every two days (). Both manual counting of the BM plasmacytosis and staining of the 5T33 idiotype (3H2) confirmed the superior effects of the combination treatment at day 21 (, ). Phenotypically, the tumor cells of untreated mice displayed increasing amounts of PDL1 over time while this was not the case in Quis and the combination treated mice (). MHCI expression remained high and unchanged in all conditions (), while MHCII expression was higher upon DAC or combination treatment (). Of interest, ecto-calreticulin expression was higher in the DAC or the combination and CD47 levels were decreased in the Quis and combination conditions (, H). Overall, the combination treatment has the most favorable effects on the tumor in terms of immunogenicity, namely reduced PDL1 and CD47 expression, increased ecto-calreticulin and presence of both MHC-I and MHC-II.
Figure 4. Effect of in vivo treatment on tumor development and phenotype.
A: In vivo treatment schedule. Mice were treated from day 7 onwards with DAC (0.2 mg/kg daily intraperitoneally). Starting at day 9, mice received Quis (1.5 mg/kg, every other day subcutaneously). At indicated timepoints, mice were euthanized and BM was isolated from the hind legs for FACS analysis and to make cytospins. B: Results of BM plasmacytosis were obtained by manual counting of May-Grünwald-Giemsa stained cytospins.C: Results of anti-idiotype (3H2) staining obtained by flow cytometry. First, debris was excluded using FSC/SSC. Next, living cells were selected based on negative near-IR Live/Dead staining. Anti-idiotype (3H2) positive, CD11b (-) events were selected to determine tumor load.D-I: Percentages of PD-L1 (D), MHC-I (E), MHC-II (F), calreticulin (G), CD47 (I) within 3H2(+)/CD11b(-) events. Dots and error bars represent mean and standard deviation (n = 5–6 per group). Statistics were done using One-Way-Anova. ** and *** indicates p < 0.001 and p < 0.0001, respectively compared to control condition. †† and ††† indicates p < 0.001 and p < 0.0001 compared to single agent treatments. (DAC = decitabine, Quis = Quisinostat, BM = bone marrow).
In vivo treatment with DAC and Quis altered the immune cell constitution of 5T33MM mice
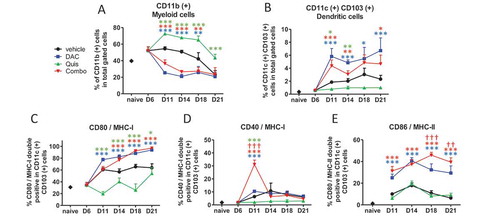
In a next step, we used the 5T33MM model to analyze changes in number or phenotype of DCs, T cells and myeloid (CD11b) cells in the BM during treatment. Vehicle-treated mice retained a stable number of CD11b-positive cells until day 18 at which tumor load increased. DAC and the combination reduced the number of CD11b-positive cells early after treatment (). Overall, the number of CD11c- and CD103-positive cells (DCs) increased over time in vehicle-treated mice. The combination treatment and DAC induced DC cell number while Quis decreased DC number compared to vehicle (). Regarding maturation markers, DAC-treated and combination-treated mice showed higher percentages of CD80 and MHC-I double positivity within CD11c-positive events from day 14 onwards compared to vehicle- and Quis-treated mice (). Double positivity for CD40 and MHC-I peaked on day 11 and dropped again to baseline levels in combination-treated mice (). Double positivity for CD86 and MHC-II was highest in combination-treated mice compared to all other conditions on day 18 and 21 (). Overall, mainly DAC drives a decrease in CD11b-positive cells and an increase in mature CD11c- and CD103-positive cells in vivo.
Figure 5. Effect of in vivo EMA treatment on myeloid and dendritic cells in the bone marrow.
Mice were treated from day 7 onwards with DAC (0.2 mg/kg daily intraperitoneally). Starting at day 9, mice received Quis (1.5 mg/kg, every other day subcutaneously). At indicated timepoints, mice were euthanized and BM was isolated from the hind legs for FACS analysis. First, debris was excluded using FSC/SSC. Next, living cells were selected based on negative near-IR Live/Dead staining (represents total gated cells). Next, CD11b and CD11c/CD103-positive events were selected.A: Percentages of CD11b(+) cells in the bone marrow of treated miceB: Percentages of CD11c(+)/CD103(+) cells in the bone marrow of treated mice.C-E: percentages of CD80/MHC-I (C), CD40/MHC-I (D), CD86/MHC-II (E) double positive cells within CD11c(+) cells. Dots and error bars represent mean and standard deviation (n = 3 for naive mice, n = 5–8 per group). *, ** and *** indicates p < 0.05, p < 0.001 and p < 0.0001, respectively compared to control condition. †† and ††† indicates p < 0.001 and p < 0.0001 compared to respective single agent treatments. (DAC = decitabine, Quis = Quisinostat).
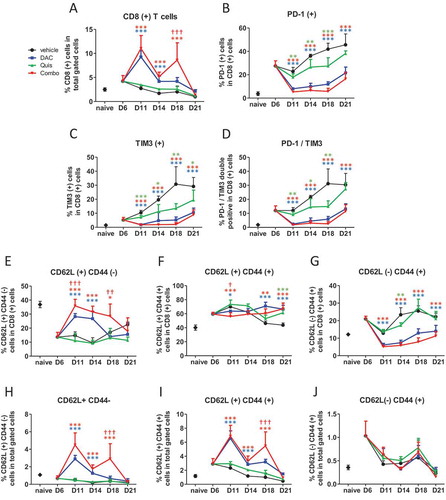
Regarding CD8 positive T cells, at day 6 after inoculation, we observed a higher number of Tcrb- and CD8-positive T cells in the BM compared to naive mice. While this number decreased over time in vehicle- and Quis-treated mice, DAC- and combination- treated mice showed higher numbers of CD8-positive T cells over the course of treatment (). Phenotypically, the T cells of vehicle-treated mice displayed increasing percentages of PD-L1- and TIM3-positive cells while this was significantly lower in Quis-, DAC- or combination-treated mice at all analyzed timepoints (-). The proportion of naive (CD44-negative and CD62L-positive) CD8-positive T cells was significantly increased in the combination treatment on day 11 and day 18 (Figure 6E). Six days after inoculation, the proportion of memory (CD44- and CD62L-positive) and effector (CD44-positive and CD62L-negative) CD8-positive T cells was higher compared to naive mice (Figure 6F, G). In vehicle-treated mice, the proportion of memory CD8-positive T cells returned to naive levels at day 21 while these remained higher in EMA treated-mice (F). The percentage of CD8 positive effector T cells was reduced in DAC- and combination-treated mice compared to vehicle- and Quis-treated mice and reached naive levels by day 21 (). By analyzing the percentages in total gated cells, the increased number of total CD8-positive T cells in combination- and DAC-treated mice was found to result from relative higher proportions of naive and memory CD8-positive T cells (, I) while the number of effector T cells remained the same in all conditions (). In conclusion, mainly DAC drives an increased amount of CD8-positive T cells which relative to vehicle-treated mice consisted of more naive and memory, and equal amounts of effector CD8-positive T cells. Overall, CD8+T cells displayed a less exhausted character, as evidenced by lower expression of PD-1 and TIM3.
Figure 6. Effect of in vivo EMA treatment on CD8-positive T cells in the bone marrow.
Mice were treated from day 7 onwards with DAC (0.2 mg/kg daily intraperitoneally). Starting at day 9, mice received Quis (1.5 mg/kg, every other day subcutaneously). At indicated timepoints, mice were euthanized and BM was isolated from the hind legs for FACS analysis. First, debris was excluded using FSC/SSC. Next, cells were selected based on negative staining for near-IR Live/Dead, CD11b, Nk1.1 and B220 (represents total gated cells). Next, TCRb(+)/CD8(+) cells were selected.A: Percentage of TCRb(+)/CD8(+) T cells in the BM of treated mice.B-D: Percentages of PD-1(+) (B), TIM3(+) (C) and PD-1/TIM3 double positive cells (D) within CD8(+) cells of treated mice.E-G: Percentages of CD62L(+)/CD44(-) (E), CD62L(+)/CD44(+) (F) and CD62L(-)/CD44(+) cells (G) within CD8(+) T cells. H-J: Percentages of CD62L(+)/CD44(-) (H), CD62L(+)/CD44(+) (I) and CD62L(-)/CD44(+) cells (J) within total gated cells. Dots and error bars represent mean and standard deviation (n = 3 for naive, n = 5–8 per group). Statistics were done using One-Way-Anova. *, ** and *** indicates p < 0.05, p < 0.001 and p < 0.0001, respectively compared to control condition. †, †† and ††† indicates p < 0.05, p < 0.001 and p < 0.0001 compared to respective single agent treatments. (DAC = decitabine, Quis = Quisinostat).
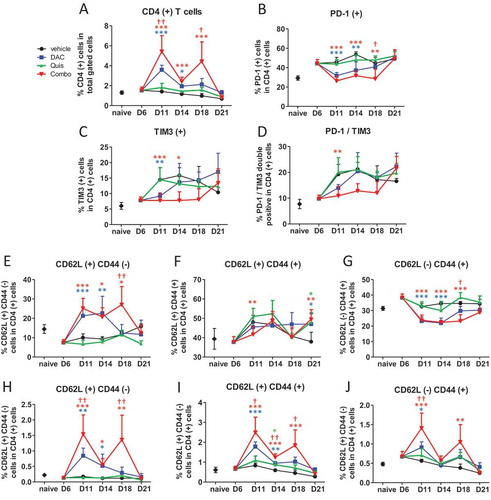
Regarding CD4-positive T cells, combination- and DAC-treated mice displayed more CD4-positive T cells in the BM which was significantly higher in the combination at day 11 and day 14 (). The percentage of PD-1-positive, TIM3-positive and PD-1/TIM3 double positive cells was lower in DAC- treated and combination-treated mice compared to vehicle- and Quis-treated mice, mainly at early timepoints (-). Within the CD4-positive T cells, the percentage of CD62L-positive and CD44 negative naive T cells were higher at day 11, 14 and 18 in DAC- and combination-treated mice with a significant combination effect at day 18 (). The proportion of CD44- and CD62L-positive memory CD4-positive T cells fluctuated between 40 and 50% with more memory cells at day 21 in all EMA-treated conditions (). The percentage CD44-positive and CD62L negative effector CD4-positive T cells was reduced in DAC- and combination-treated mice at day 11, 14 and 18 (). When we compared these phenotypes as percentage of total gated cells, the combination-treated mice contained relatively more CD4 positive naive, memory and effector T cells at days 11 and 18 compared to all other conditions. In summary, the combination treatment contained more CD4-positive T cells with a naive, memory and effector phenotype. The exhaustion markers PD1 and TIM3 increased towards day 21.
Figure 7. Effect of in vivo EMA treatment on CD4-positive T cells in the bone marrow.
Mice were treated from day 6 onwards with DAC (0.2 mg/kg daily intraperitoneally). Starting at day 9, mice received Quis (1.5 mg/kg, every other day subcutaneously). At indicated timepoints, mice were euthanized and BM was isolated from the hind legs for FACS analysis. First, debris was excluded using FSC/SSC. Next, cells were selected based on negative staining for near-IR Live/Dead, CD11b, Nk1.1 and B220 (represents total gated cells). Next, TCRb(+)/CD4(+) cells were selected.A: Percentage of TCRb(+)/CD4(+) T cells in the bone marrow of treated mice. B-D: Percentages of PD-1(+) (B), TIM3(+) (C) and PD-1/TIM3 double positive cells (D) within CD4(+) gated cells of treated mice.E-G: Percentages of CD62L(+)/CD44(-) (E), CD62L(+)/CD44(+) (F) and CD62L(-)/CD44(+) cells (G) within CD4(+) T cells.H-J: Percentages of CD62L(+)/CD44(-) (H), CD62L(+)/CD44(+) (I) and CD62L(-)/CD44(+) cells (J) within total gated cells. Dots and error bars represent mean and standard deviation (n = 3 for naive, n = 5–8 per group). Statistics were done using One-Way-Anova. *, ** and *** indicates p < 0.05, p < 0.001 and p < 0.0001, respectively compared to control condition. †, †† and ††† indicates p < 0.05, p < 0.001 and p < 0.0001 compared to respective single agent treatments. (DAC = decitabine, Quis = Quisinostat).
Discussion
To our knowledge, we report for the first time on the tumor intrinsic and extrinsic immunomodulatory effects of the DNMTi DAC and the HDACi Quis in a pre-clinical mouse model for MM. Recent pre-clinical work on the combination of the DNMTi azacytidine and several HDACi identified Givinostat, through targeting of HDAC1, 2 and 3, as a very potent combination option in terms of anti-proliferative effects and in addition, MYC depletion.Citation9 We used the DNMTi DAC in combination with the pan-HDACi Quis, which has a high potency against class I HDACs (HDAC1, 2) but also activity against HDAC classes II and IV.Citation21 Our results show that the 5T33vt cells are relatively sensitive to DAC as even low nM doses induce cytotoxicity. In line with the above studies, we observed significant cytotoxic activity and MYC depletion of the combination of DAC and Quis in the murine MM cells in this study and in previous published studies in HMCLs.Citation17,Citation22
We focused on ICD as a major determinant of immune stimulation and this in comparison to conventional anti-MM agents and the positive control Mtx. Proof for the presence of ICD hallmarks and subsequent immune response upon treatment with standard-of-care agents in MM is scarce and mainly done in vitro. Upon treatment of U266 cells and primary MM samples with Bz, an increased in vitro immunogenicity has been linked to the induction of HSP90.Citation23,Citation24 Carfilzomib and Bz have been shown to induce ecto-calreticulin in unpermeabilized MM.1S and U266 cells in vitro, an effect that was potentiated with the autophagy inhibitor chloroquine.Citation25 Concerning alkylating agents, to our knowledge, no reports on ICD hallmarks in MM have been published. A study on CT26 (coloncarcinoma) and A20 (lymphoma) showed that melphalan induced ecto-calreticulin and HMGB1 secretion and could induce CD8-positive T cell activation, showing that Mel can elicit danger signals and immune responses.Citation26 Another study showed that docosahexanoic acid could induce ecto-calreticulin, HSP90 and HMGB1 release in RPMI-8226 and OPM-2 cells.Citation27 Of the tested ICD hallmarks, we observed a low percentage of ecto-calreticulin positive 5T33vt cells treated with EMAs and chemotherapy. The HMGB1 levels in the supernatant remained unchanged after both epigenetic treatment and chemotherapy in comparison to control. This is in contrast to recently published data showing that DAC and the HDACi vorinostat induces HMGB1 release in osteosarcoma and fibrosarcoma cells.Citation28 This discrepancy indicates cell line dependent effects or may be related to the difference in dose used in our study (nanomolar dose) and the dose used in the study by Liu et al. (micromolar dose).Citation28 The significant induction of the type I IFN response upon treatment with DAC and/or Quis, and with Mel, was the most convincing ICD hallmark observed in our study. In line with our results, the combination of givinostat augmented the effect of Aza on the type I IFN response.Citation9 In addition, evidence that a type I IFN response is linked to anti-MM immunity has been observed with the use of the dual cIAP1/2 inhibitor LC161.Citation29 In that study, no evidence for ecto-calreticulin was found indicating an ICD-independent mechanism for anti-MM immunity induced by LC161. Our in vivo vaccination assay showed, despite a delay in tumor development, a low level of protection with all the tested compounds, including the positive control Mtx. This is in contrast with results in solid tumor such as CT26 coloncarcinoma cells, where Mtx shows protection of 90% of the mice in a similar vaccination assay.Citation30 This result may be attributed to sub-optimal vaccination conditions, the occurrence of immunosuppressive mechanisms or a limited capacity of the 5T33vt cells to induce bona fide ICD. With respect to ICD markers, the emergence of strong anti-tumor responses in vivo upon vaccination may be compromised by the low number of pre-apoptotic ecto-calreticulin positive cells and the absence of HMGB1 release above baseline. Moreover, tolerogenic signals including phosphatidylserine and CD47 are induced in vitro. These observations therefore suggest that the 5T33MM cells have a limited capacity to undergo ICD resulting in insufficient anti-tumor immune responses in our vaccination setting. Nevertheless, the phenotypic analysis of DCs upon co-culture with treated 5T33vt cells showed signs of DC stimulation indicative of increased immunogenicity of the treated 5T33vt cells. This appeared the strongest for DAC and Quis, and to a lesser extent with chemotherapy. Previous studies also demonstrated that bortezomib treated or irradiated MM cells can prime DCs.Citation24,Citation31 Taken together, our present study and those from others show that ICD hallmarks can be found upon treatment of human and murine MM cells. However, we show that vaccination does not yield complete protection in a murine model for MM. The process of ICD therefore requires further investigation and validation in human MM cells. This is important as failure to induce ICD blunts therapy-induced immune priming and anti-tumor immune responses resulting in worse outcome for cancer patients.Citation16 In case a therapy induces anti-tumor immunity, it would be expected that a positive correlation exists between mutational load and clinical outcome, like this is the case for melanoma and lung cancer.Citation32,Citation33 This is however not the case in MM, as previously reported, indeed suggesting that standard-of-care agents do not evoke strong anti-MM responses.Citation34 This may be related to an inadequate induction of ICD in MM cells which may be an underexplored mechanism for immune escape that warrants further investigation.
The in vivo treatment with DAC and Quis showed that the combination therapy has potent anti-MM activity. This was associated with a reduced expression of PD-L1 and CD47 and an increased expression of MHC-II and calreticulin in the tumor cells. The results with CD47 contrast with the in vitro findings and hints towards a role of the BM microenvironment to regulate CD47 expression or other co-stimulatory or inhibitory molecules. In line with the in vitro results, an increase in the maturation status of DCs was observed upon DAC and combo treatment but not with Quis treatment. Previous work also identified that DAC can induce DC maturation in melanoma.Citation35 Recent pre-clinical work on the combination of the DNMTi azacytidine and several HDACi showed profound alterations in the tumor microenvironment in lung cancer and ovarian cancer.Citation9,Citation10 Epigenetic treatment alone or in combination with PD-1 blockade of ovarian tumors resulted in significant more activated IFN γ-positive CD8-positive or CD4-positive T cells, and IFN-γ-positive NK cells in addition to significant less macrophages and myeloid-derived suppressor cells in the tumor microenvironment.Citation10 Likewise, in the lung cancer model, increased numbers of active IFN-γ- and CD8-positive T cells and reduced numbers of macrophages were identified.Citation9 While the total number of CD8-positive or CD4-positive T cells did not alter in these studies, we observed increased total numbers of naive and memory CD8-positive T cells and naive, memory and effector CD4-positive T cells based on CD44 and CD62L positivity. Interestingly, the CD8- and CD4-positive T cells appeared less exhausted based on the reduced expression of PD-1 and TIM3 in DAC or combination treated mice. Our results show similarities to the work in lung cancer where the T cells phenotypically appeared less exhausted and more memory-like based on transcriptomics data.Citation9 Also, in agreement, early after treatment, DAC and the combination decreased the number of myeloid CD11b-positive cells which we previously showed are immunosuppressive in our model.Citation36 We must recognize that the major difference in our study and those from Topper et al. and Stone et al. is that we used DAC and Quis, and this in a simultaneous treatment regimen and not in a sequential treatment regimen.
In conclusion, we provide evidence that the combination of a DNMTi and a HDACi induced tumor immunogenicity associated with DC activation and altered the immune cell constitution in the bone marrow in a pre-clinical mouse model for MM. These findings support new studies for further optimization and testing the combination of EMA-treatment with immunotherapy in MM.
Material and methods
Cells and cell culture
The murine MM cell line 5T33vt was originally subcloned from the stroma dependent murine 5T33MM model. Citation37,Citation38 Cells were cultured at 5% CO2 and 37°C in RPMI 1640 medium (Lonza, Basel, Switzerland) supplemented with 10% fetal calf serum (Biochrom AG, Berlin, Germany; FCS) and supplements (100 U/ml penicillin/streptomycin (Lonza), 2 mM L-glutamine (Lonza), 0.1 mM non-essential amino acids (Lonza) and 1 mM Sodium pyruvate (Lonza).
Mice
Six to ten weeks old C57Bl/KaLwRij mice were purchased from Envigo (Horst, The Netherlands). Animals were housed under conventional conditions and experiments were approved by the Ethical Committee for Animal Experiments of the Vrije Universiteit Brussel (license no. LA1230281, internal files 16–281-4 and 17–281-8).
Compounds
Decitabine (DAC), Quisinostat (Quis), Mitoxanthrone (Mtx) and Bortezomib (Bz) were purchased at Selleckchem (Munich, Germany). Melphalan (Mel) was obtained from Sigma-Aldrich. For in vivo experiments, DAC and Quis were used as a filter sterilized 10% hydroxypropyl-cyclodextran suspension.
Treatment schedules
5T33vt cells were plated at 5 x 10^5 cells in 5 ml/well (6 well) and treated with indicated doses of DAC. On day 3, treated cells were counted and replated with freshly added DAC or Quis. On day 6, cells were treated again without refreshing the medium to allow accumulation of secreted factors. For the 4-day combination treatment, Quis was added on day 3. For the 1-day combination treatment, Quis was added on day 6. For Mel, Bz and Mtx conditions, cells were treated with indicated doses of Mel, Bz or Mtx up to two days. Cells were collected for vaccination, co-culture with DCs, flow cytometry, quantitative real-time polymerase chain reaction (qRT-PCR) or western blot. Supernatant was used for western blotting and ELISA.
Vaccination experiments in the 5T33MM model
Murine 5T33vt myeloma cells were treated for 7 days with EMAs according to the schedule described above. In parallel, cells were treated with Mel, Bz or Mtx for two days. Next, treated/dying cells were pelleted, dissolved in PBS and subcutaneously injected into naïve C57Bl/KaLwRij mice in one flank as vaccine. Each mouse received the content of 1 well dissolved in 200 µL PBS. Eight days later, mice were injected subcutaneously on the contralateral side with 2 x 10^5 untreated 5T33vt cells in 200 µL PBS (tumor inoculation). Tumor formation was monitored for 65 days and a tumor volume of 1500 mm3 was taken as the endpoint.
Co-culture of DCs with treated 5T33vt cells and assessment of DC activation markers with flow cytometry
Murine DCs were derived from the BM of 6 to 10 weeks old naïve C57Bl/KaLwRij mice according to the protocol described by Breckpot et al..Citation39 Briefly, BM cells were collected from the tibia and femurs of C57Bl/KaLwRij mice. Red blood cells were lysed before seeding the BM cells at 5 x 10^5 cells/mL in DMEM containing 5% FCS, 5% supplements and 20 ng/mL recombinant murine GM-CSF (produced in house). New medium and GM-CSF was added on day 3 and 5 of culture. At day 6, primary DCs were harvested and plated at 3,5 x 10^5 cells/well in a 24 well plate with 20 ng/mL recombinant murine GM-CSF. Subsequently, DCs were co-cultured with the treated 5T33vt cells from 1 well, conditioned medium or LPS (positive control). One day later, DCs were harvested and analyzed for activation markers using flow cytometry.
Flow cytometry analysis of cell death
Cells were harvested and incubated for 15 min with Annexin-V FITC and 7AAD in 100 µL of Annexin-V binding buffer (BD Pharmigen, San Diego, CA, USA). Next, cells were analyzed by flow cytometry using BD Canto or Fortessa (BD Biosciences, San Jose, CA, USA),
Flow cytometry analysis for calreticulin, CD47 and DC maturation
Cells were harvested and washed using PBS/BSA/Azide (DPBS, 2.5 g BSA, 0.5 g NaN3, Lonza) followed by 10 min incubation with Fc blocking reagent (MiltenyBiotec, Bergisch Gladbach, Germany). Subsequently, primary antibody mix was added and cells were incubated for 30 min, followed by washing with PBS/BSA/Azide. After staining, samples were washed and resuspended in PBS/BSA/Azide and 2 µl 7AAD. Antibodies are listed in supplementary table 1. Antibody-coated microbeads were used for compensation and flow cytometry analysis was done using the FACS Canto or Fortessa (BD Biosciences).
Flow cytometry analysis for BM immune cell populations
Cells were washed in PBS/BSA/Azide and incubated with Fc blocking reagent (Miltenyi). Next, near IR live/dead staining was added and samples were incubated for 15 min at 4°C. Next, samples were washed and primary antibody mixes dissolved in brilliant staining buffer (BD Bioscience) were added. After 30 min incubation at 4°C, cells were washed. In case of the idiotype (tumor) staining, samples were incubated with a secondary antibody for 30 min followed by a last wash step. Antibodies are listed in supplementary table 1. Antibody-coated microbeads were used for compensation and flow cytometry analysis was done using the FACS Fortessa (BD Biosciences).
In vivo treatment schedule and procedures for sample collection and analysis
The 5T33MM model was maintained as previously described.Citation40 On day 0, naive C57BL/KaLwRij mice were intravenously injected with 5 x 10^5 5T33MM cells. Mice were treated from day 7 onwards with DAC (0.2 mg/kg) (intraperitoneal injection, daily) and/or Quis (1.5 mg/kg) (subcutaneous injection, once every other day). After 4, 7, 11 and 14 days of treatment, mice were sacrificed and the bone marrow (BM) from hind leg was isolated and subjected to red blood cell lysis. Cytospins were made and stained by May-Grünwald-Giemsa for manual counting of BM plasmacytosis. Flow cytometry analysis was done to investigate the effect on tumor cells, DCs, myeloid cells and T-cells as described below.
Western blotting
Supernatant or pellets were collected at indicated timepoints. An equal volume of 2X loading buffer (Bio-Rad, Temse, Belgium) was added to the supernatant or isolated proteins and were boiled for 5 min. After boiling, 30 µl of the supernatant or 20 µg of protein was loaded and separated using a sodium dodecyl sulfate–polyacrylamide gel electrophoresis and transferred to polyvinylidene difluoride membranes (Bio-Rad). Membranes were blocked with PBS containing 5% milk and 0.1% Tween 20. The following antibodies were used: mouse anti-HMGB1 IgG2b (ImTec Diagnostics, Antwerpen, Belgium), anti-DNMT1, anti-AcH3, anti-Actin, anti-c-Myc (Bioké, Leiden, The Netherlands) and anti-mouse IgG or anti-rabbit HRP-conjugated secondary antibody (ImTec Diagnostics). Blots were developed on Fuji medical x-ray film (Fujifilm, Tokyo, Japan) using Plus-ECL (PerkinElmer, Zaventem, Belgium) and Curix 60 (AGFA Gevaert NV, Mortsel, Belgium).
ELISA for HMGB1 and IFN-B
HMGB1 concentration in the supernatant of treated and control cells was detected using the IBL international HMGB1 ELISA kit (Hamburg, Germany) according to manufacturer protocol. Likewise, IFN-B concentration was determined using the Verikine HS IFNB kit (PBL assay science).
qRT-PCR analysis
Cell pellets were stored at −80°C before use. RNA was extracted using the NucleoSpin RNA kit from Macherey-Nagel (Düren, Germany) and RNA concentration was determined using NanoDrop software (Thermo Scientific). RNA was converted in cDNA using the Verso cDNA Synthesis Kit (Thermo Scientific). qRT-PCR was performed using 25 ng of cDNA. Primers were purchased at IDT (Leuven, Belgium) and were used at a final concentration of 200 nM. Sequences are summarized in supplementary table 2. Abl was used as housekeeping gene. The Maxima SYBR Green/ROX qPCR Master Mix kit (Thermo Scientific) was used to perform qRT-PCR on 7900HT Fast Real-Time PCR System (Thermo Scientific). Two step qRT-PCR was performed: DNA is denaturated at 95°C before annealing and extension of the primers was done at 60°C for 40 cycles. Relative expression was calculated using ΔΔCt and Abl as housekeeping gene.
Graphical and statistical analysis
Graphical and statistical analysis was performed using GraphPad Prism 5.0 software. Experiments were repeated at least 3 times and statistical comparison between several groups was made using One Way ANOVA and Tukey’s Multiple Comparison Test. Non-parametrical comparison of two groups was done with Mann-Whitney test. A p-value of <0.05 was considered significant. Flow cytometry data was analyzed using FACSDiva software (BD Biosciences) and FlowJo software (Ashland, Oregon, USA). For the in vivo vaccination experiment, data was plotted in Kaplan-Meier graphs using GraphPad Prism and statistical analysis was performed with a log-rank test.
Disclosure of potential conflicts of interest
No potential conflict of interest was reported by the authors.
Supplemental Material
Download Zip (1.5 MB)Acknowledgments
We thank Sofie Seghers, Carine Seynaeve and Lotte Jacobs for technical assistance with mice experiments and molecular assays. We thank Jean-Marc Zazou and Angelo Willems for technical assistance with FACS procedures.
Supplemental data
Supplemental data for this article can be accessed here.
Additional information
Funding
References
- Chen DS, Mellman I. Oncology meets immunology: the cancer-immunity cycle. Immunity. 2013;39(1):1–10. doi:10.1016/j.immuni.2013.07.012.
- Chen DS, Mellman I. Elements of cancer immunity and the cancer-immune set point. Nature. 2017;541(7637):321–330. doi:10.1038/nature21349.
- Schreiber RD, Old LJ, Smyth MJ. Cancer immunoediting: integrating immunity’s roles in cancer suppression and promotion. Science. 2011;331(6024):1565–1570. doi:10.1126/science.1203486.
- Vilgelm AE, Johnson DB, Richmond A. Combinatorial approach to cancer immunotherapy: strength in numbers. J Leukoc Biol. 2016;100(2):275–290. doi:10.1189/jlb.5RI0116-013RR.
- Romano A, Conticello C, Cavalli M, Vetro C, La Fauci A, Parrinello NL, Di Raimondo F. Immunological dysregulation in multiple myeloma microenvironment. Biomed Res Int. 2014;2014:198539. doi:10.1155/2014/198539.
- Rutella S, Locatelli F. Targeting multiple-myeloma-induced immune dysfunction to improve immunotherapy outcomes. Clin Dev Immunol. 2012;2012:196063. doi:10.1155/2012/196063.
- Rodriguez-Otero P, Paiva B, Engelhardt M, Prosper F, San Miguel JF. Is immunotherapy here to stay in multiple myeloma? Haematologica. 2017;102(3):423–432. doi:10.3324/haematol.2016.152504.
- Heninger E, Krueger TE, Lang JM. Augmenting antitumor immune responses with epigenetic modifying agents. Front Immunol. 2015;6:29.
- Topper MJ, Vaz M, Chiappinelli KB, DeStefano Shields CE, Niknafs N, Yen RC, Wenzel A, Hicks J, Ballew M, Stone M, et al. Epigenetic therapy ties MYC depletion to reversing immune evasion and treating lung cancer. Cell. 2017;171(6):1284–300 e21. doi:10.1016/j.cell.2017.10.022.
- Stone ML, Chiappinelli KB, Li H, Murphy LM, Travers ME, Topper MJ, Mathios D, Lim M, Shih IM, Wang TL, et al. Epigenetic therapy activates type I interferon signaling in murine ovarian cancer to reduce immunosuppression and tumor burden. Proc Natl Acad Sci U S A. 2017;114(51):E10981–E90. doi:10.1073/pnas.1712514114.
- Toor AA, Payne KK, Chung HM, Sabo RT, Hazlett AF, Kmieciak M, Sanford K, Williams DC, Clark WB, Roberts CH, et al. Epigenetic induction of adaptive immune response in multiple myeloma: sequential azacitidine and lenalidomide generate cancer testis antigen-specific cellular immunity. Br J Haematol. 2012;158(6):700–711. doi:10.1111/j.1365-2141.2012.09225.x.
- Moreno-Bost A, Szmania S, Stone K, Garg T, Hoerring A, Szymonifka J, Shaughnessy J Jr., Barlogie B, Prentice HG, van Rhee F. Epigenetic modulation of MAGE-A3 antigen expression in multiple myeloma following treatment with the demethylation agent 5-azacitidine and the histone deacetlyase inhibitor MGCD0103. Cytotherapy. 2011;13(5):618–628. doi:10.3109/14653249.2010.529893.
- Wu X, Tao Y, Hou J, Meng X, Shi J. Valproic acid upregulates NKG2D ligand expression through an ERK-dependent mechanism and potentially enhances NK cell-mediated lysis of myeloma. Neoplasia. 2012;14(12):1178–1189. doi:10.1593/neo.121236.
- Maes K, De Smedt E, Kassambara A, Hose D, Seckinger A, Van Valckenborgh E, Menu E, Klein B, Vanderkerken K, Moreaux J, et al. In vivo treatment with epigenetic modulating agents induces transcriptional alterations associated with prognosis and immunomodulation in multiple myeloma. Oncotarget. 2015;6(5):3319–3334. doi:10.18632/oncotarget.3207.
- Chiappinelli KB, Strissel PL, Desrichard A, Li H, Henke C, Akman B, Hein A, Rote NS, Cope LM, Snyder A, et al. Inhibiting DNA methylation causes an interferon response in cancer via dsRNA including endogenous retroviruses. Cell. 2015;162(5):974–986. doi:10.1016/j.cell.2015.07.011.
- Galluzzi L, Buque A, Kepp O, Zitvogel L, Kroemer G. Immunogenic cell death in cancer and infectious disease. Nat Rev Immunol. 2016;17:97–111.
- Bruyer A, Maes K, Herviou L, Kassambara A, Seckinger A, Cartron G, Reme T, Robert N, Requirand G, Boireau S, et al. DNMTi/HDACi combined epigenetic targeted treatment induces reprogramming of myeloma cells in the direction of normal plasma cells. Br J Cancer. 2018. doi:10.1038/s41416-018-0025-x.
- Kepp O, Senovilla L, Vitale I, Vacchelli E, Adjemian S, Agostinis P, Apetoh L, Aranda F, Barnaba V, Bloy N, et al. Consensus guidelines for the detection of immunogenic cell death. Oncoimmunology. 2014;3(9):e955691. doi:10.4161/21624011.2014.955691.
- Sistigu A, Yamazaki T, Vacchelli E, Chaba K, Enot DP, Adam J, Vitale I, Goubar A, Baracco EE, Remedios C, et al. Cancer cell-autonomous contribution of type I interferon signaling to the efficacy of chemotherapy. Nat Med. 2014;20(11):1301–1309. doi:10.1038/nm.3708.
- Yu Q, Katlinskaya YV, Carbone CJ, Zhao B, Katlinski KV, Zheng H, Guha M, Li N, Chen Q, Yang T, et al. DNA-damage-induced type I interferon promotes senescence and inhibits stem cell function. Cell Rep. 2015;11(5):785–797. doi:10.1016/j.celrep.2015.03.069.
- Arts J, King P, Marien A, Floren W, Belien A, Janssen L, Pilatte I, Roux B, Decrane L, Gilissen R, et al. JNJ-26481585, a novel “second-generation” oral histone deacetylase inhibitor, shows broad-spectrum preclinical antitumoral activity. Clin Cancer Res. 2009;15(22):6841–6851. doi:10.1158/1078-0432.CCR-09-0547.
- Maes K, De Smedt E, Lemaire M, De Raeve H, Menu E, Van Valckenborgh E, McClue S, Vanderkerken K, De Bruyne E. The role of DNA damage and repair in decitabine-mediated apoptosis in multiple myeloma. Oncotarget. 2014;5(10):3115–3129. doi:10.18632/oncotarget.v5i10.
- Moeller I, Spagnoli GC, Finke J, Veelken H, Houet L. Uptake routes of tumor-antigen MAGE-A3 by dendritic cells determine priming of naive T-cell subtypes. Cancer Immunol Immunother. 2012;61(11):2079–2090. doi:10.1007/s00262-012-1272-y.
- Spisek R, Charalambous A, Mazumder A, Vesole DH, Jagannath S, Dhodapkar MV. Bortezomib enhances dendritic cell (DC)-mediated induction of immunity to human myeloma via exposure of cell surface heat shock protein 90 on dying tumor cells: therapeutic implications. Blood. 2007;109(11):4839–4845. doi:10.1182/blood-2006-10-054221.
- Jarauta V, Jaime P, Gonzalo O, de Miguel D, Ramirez-Labrada A, Martinez-Lostao L, Anel A, Pardo J, Marzo I, Naval J. Inhibition of autophagy with chloroquine potentiates carfilzomib-induced apoptosis in myeloma cells in vitro and in vivo. Cancer Lett. 2016;382(1):1–10. doi:10.1016/j.canlet.2016.08.019.
- Lu X, Ding ZC, Cao Y, Liu C, Habtetsion T, Yu M, Lemos H, Salman H, Xu H, Mellor AL, et al. Alkylating agent melphalan augments the efficacy of adoptive immunotherapy using tumor-specific CD4+ T cells. J Immunol. 2015;194(4):2011–2021. doi:10.4049/jimmunol.1401894.
- D’Eliseo D, Di Renzo L, Santoni A, Velotti F. Docosahexaenoic acid (DHA) promotes immunogenic apoptosis in human multiple myeloma cells, induces autophagy and inhibits STAT3 in both tumor and dendritic cells. Genes Cancer. 2017;8(1–2):426–437.
- Liu P, Zhao L, Loos F, Iribarren K, Lachkar S, Zhou H, Gomes-da-Silva LC, Chen G, Bezu L, Boncompain G, et al. Identification of pharmacological agents that induce HMGB1 release. Sci Rep. 2017;7(1):14915. doi:10.1038/s41598-017-14848-1.
- Chesi M, Mirza NN, Garbitt VM, Sharik ME, Dueck AC, Asmann YW, Akhmetzyanova I, Kosiorek HE, Calcinotto A, Riggs DL, et al. IAP antagonists induce anti-tumor immunity in multiple myeloma. Nat Med. 2016;22(12):1411–1420. doi:10.1038/nm.4229.
- Obeid M, Tesniere A, Ghiringhelli F, Fimia GM, Apetoh L, Perfettini JL, Castedo M, Mignot G, Panaretakis T, Casares N, et al. Calreticulin exposure dictates the immunogenicity of cancer cell death. Nat Med. 2007;13(1):54–61. doi:10.1038/nm1523.
- Vasileiou S, Baltadakis I, Delimpasi S, Karatza MH, Liapis K, Garofalaki M, Tziotziou E, Poulopoulou Z, Karakasis D, Harhalakis N. Ex vivo induction of multiple myeloma-specific immune responses by monocyte-derived dendritic cells following stimulation by whole-tumor antigen of autologous myeloma cells. J Immunother. 2017;40(7):253–264. doi:10.1097/CJI.0000000000000182.
- Rizvi NA, Hellmann MD, Snyder A, Kvistborg P, Makarov V, Havel JJ, Lee W, Yuan J, Wong P, Ho TS, et al. Cancer immunology. Mutational landscape determines sensitivity to PD-1 blockade in non-small cell lung cancer. Science. 2015;348(6230):124–128. doi:10.1126/science.aaa1348.
- Van Allen EM, Miao D, Schilling B, Shukla SA, Blank C, Zimmer L, Sucker A, Hillen U, Foppen MHG, Goldinger SM, et al. Genomic correlates of response to CTLA-4 blockade in metastatic melanoma. Science. 2015;350(6257):207–211. doi:10.1126/science.aad0095.
- Miller A, Asmann Y, Cattaneo L, Braggio E, Keats J, Auclair D, Lonial S, Russell SJ, Stewart AK. High somatic mutation and neoantigen burden are correlated with decreased progression-free survival in multiple myeloma. Blood Cancer J. 2017;7(9):e612. doi:10.1038/bcj.2017.94.
- Triozzi PL, Aldrich W, Achberger S, Ponnazhagan S, Alcazar O, Saunthararajah Y. Differential effects of low-dose decitabine on immune effector and suppressor responses in melanoma-bearing mice. Cancer Immunol Immunother. 2012;61(9):1441–1450. doi:10.1007/s00262-012-1204-x.
- Van Valckenborgh E, Schouppe E, Movahedi K, De Bruyne E, Menu E, De Baetselier P, Vanderkerken K, Van Ginderachter JA. Multiple myeloma induces the immunosuppressive capacity of distinct myeloid-derived suppressor cell subpopulations in the bone marrow. Leukemia. 2012;26(11):2424–2428. doi:10.1038/leu.2012.113.
- Garrett IR, Dallas S, Radl J, Mundy GR. A murine model of human myeloma bone disease. Bone. 1997;20(6):515–520. doi:10.1016/S8756-3282(97)00056-2.
- Manning LS, Berger JD, O’Donoghue HL, Sheridan GN, Claringbold PG, Turner JH. A model of multiple myeloma: culture of 5T33 murine myeloma cells and evaluation of tumorigenicity in the C57BL/KaLwRij mouse. Br J Cancer. 1992;66(6):1088–1093. doi:10.1038/bjc.1992.415.
- Breckpot K, Dullaers M, Bonehill A, van Meirvenne S, Heirman C, de Greef C, van der Bruggen P, Thielemans K. Lentivirally transduced dendritic cells as a tool for cancer immunotherapy. J Gene Med. 2003;5(8):654–667. doi:10.1002/(ISSN)1521-2254.
- Asosingh K, Radl J, Van Riet I, Van Camp B, Vanderkerken K. The 5TMM series: a useful in vivo mouse model of human multiple myeloma. Hematol J. 2000;1(5):351–356. doi:10.1038/sj.thj.6200052.