
ABSTRACT
Epitopes that arise from a somatic mutation, also called neoepitopes, are now known to play a key role in cancer immunology and immunotherapy. Recent advances in high-throughput sequencing have made it possible to identify all mutations and thereby all potential neoepitope candidates in an individual cancer. However, most of these neoepitope candidates are not recognized by T cells of cancer patients when tested in vivo or in vitro, meaning they are not immunogenic. Especially in patients with a high mutational load, usually hundreds of potential neoepitopes are detected, highlighting the need to further narrow down this candidate list. In our study, we assembled a dataset of known, naturally processed, immunogenic neoepitopes to dissect the properties that make these neoepitopes immunogenic. The tools to use and thresholds to apply for prioritizing neoepitopes have so far been largely based on experience with epitope identification in other settings such as infectious disease and allergy. Here, we performed a detailed analysis on our dataset of curated immunogenic neoepitopes to establish the appropriate tools and thresholds in the cancer setting. To this end, we evaluated different predictors for parameters that play a role in a neoepitope’s immunogenicity and suggest that using binding predictions and length-rescaling yields the best performance in discriminating immunogenic neoepitopes from a background set of mutated peptides. We furthermore show that almost all neoepitopes had strong predicted binding affinities (as expected), but more surprisingly, the corresponding non-mutated peptides had nearly as high affinities. Our results provide a rational basis for parameters in neoepitope filtering approaches that are being commonly used.
Abbreviations: SNV: single nucleotide variant; nsSNV: nonsynonymous single nucleotide variant; ROC: receiver operating characteristic; AUC: area under ROC curve; HLA: human leukocyte antigen; MHC: major histocompatibility complex; PD-1: Programmed cell death protein 1; PD-L1 or CTLA-4: cytotoxic T-lymphocyte associated protein 4
Introduction
While epitope-based cancer immunotherapies have been the subject of intense investigation for decades, initial results in the clinical setting were mixed. Citation1–Citation3 However, recent years have witnessed a resurgence of interest in epitope-based cancer immunotherapy due to advances in high-throughput sequencing that have enabled rapid identification of cancer-associated, patient-specific mutations that can be recognized as T cell epitopes (mutated cancer epitopes or neoepitopes). Citation4–Citation8 This enthusiasm is further enhanced by the potential of coupling epitope immunization with recently developed checkpoint inhibitors targeting PD-1, PD-L1 or CTLA-4. Checkpoint inhibitors reduce immune suppressive mechanisms thus amplifying the immunogenicity of cancer-specific antigens and potentially overcoming a weakness of epitope-based cancer vaccines. Citation4,Citation9,Citation10
Not all neo-peptides resulting from cancer mutations are expected to be immunogenic. Recognition of a peptide by T cells requires a number of steps, most notably the binding of the peptide to a host-encoded HLA molecule. Previous studies defined 500nM as a minimal HLA binding affinity threshold for peptide immunogenicity in the context of MHC class I restricted cytotoxic T cell (CTL) responses to viral and other non-self-origin epitopes. Citation11 However, it is not clear if the same threshold should also be used to identify epitopes in self-antigens, such as the ones recognized in autoimmunity and cancer. Indeed, some reports have suggested that these epitopes are associated with distinctively lower HLA affinity Citation12–Citation15 as a result of the T cells recognizing high-affinity binders being silenced by central and peripheral tolerance. However, this tenet was challenged by several studies showing that cancer and autoantigen associated epitopes also bound with affinities similar to those of their microbial counterparts. Citation16,Citation17 The controversy was renewed in the setting of mutated cancer epitopes, with some studies suggesting that HLA binding is a crucial factor in selecting them Citation18 with others indicating that binding is of marginal importance Citation19 and that the MHC binding affinity of the non-mutated sequence from which the mutation is derived is also of importance.
Additional factors that are expected to play a role in immunogenicity include the capacity of epitopes to be derived by natural processing and subsequent recognition by a TCR. Processing can be predicted by several tools available online Citation20 which model the specificity of the antigen processing machinery such as proteasomal cleavage and TAP transport. TCR recognition is dependent on availability of a suitable TCR repertoire, which is in turn influenced by both positive and negative selection, and peripheral tolerance. Citation19 This complex process is hard to predict, but it seems to favor the recognition of amino acid residues with large and aromatic side chains types in peptide residue positions facing the TCR, which can be used to assign peptides an immunogenicity score independent of MHC binding and processing. Citation21
By now there have been multiple studies using immunoinformatics tools to analyze large-scale cancer sequencing data to predict mutation-derived epitopes and identify those with clinical relevance or to select candidates for clinical application. Citation5,Citation20,Citation22 However, most of these studies used different combinations of tools and applied different criteria to prioritize their set of mutated epitopes. Citation6,Citation23–Citation29 This lack of uniformity in defining ideal criteria for neoepitope prioritization shows the need for a study like ours to determine an optimal approach that combines the main factors influencing immunogenicity within the specific context of cancer.
Results
Assembly of mutated cancer epitopes
We assembled mutated epitopes previously described in the literature, as listed in the Cancer Immunity Epitope Database (http://cancerimmunity.org/peptide/). We only considered mutated epitopes whose HLA class I allele restriction was defined at four-digit resolution, Citation30 and for which HLA binding assays were available in our panel. Citation31 We furthermore used stringent inclusion criteria and only considered an epitope to be immunogenic if a corresponding epitope-specific T cell was shown to be capable of recognizing autologous tumor cells. This resulted in the identification of 32 mutated epitopes and associated non-mutated sequence pairs in the Cancer Immunity Epitope Database. Furthermore, utilizing the search and curation strategies developed by the Immune Epitope Database (IEDB), Citation32 we identified an additional 17 mutated epitopes in a first- and 29 in a second round of curation. In total, 78 distinct epitope HLA pairs were curated, of which 14 were filtered out because they were also included in the dataset provided by the National Cancer Institute (NCI, described below), leaving 64 epitope HLA pairs that were used for bioinformatics analysis. gives an overview of the epitope sets utilized throughout this study. Supplemental Table 1 lists the specific mutated epitope sequences, the corresponding non-mutated sequence, the protein of origin, and the journal article in which the epitopes were described.
Table 1. Overview of epitope sets
We wanted to validate the findings from the analysis of the literature dataset in a completely independent set of validated immunogenic neoepitopes. We received a set of peptides (25mers) that cover cancer mutations from the Surgery Department at the National Cancer Institute (NCI) for which T cell recognition status had been determined experimentally and peptides were classified into 52 positive peptides (with demonstrated T cell recognition) and 2,760 negative peptides (for which no T cell recognition was detected). Importantly, the workflow utilized at NCI considers all detected mutations in a patient and tests all mutated peptides for T cell recognition, meaning the peptides in both the positive and negative set were not pre-selected based on MHC binding. Citation33
For each 25-mer peptide, we considered all possible peptides of lengths 8–11 contained in it that span the mutation and paired each of these short peptides with each of the corresponding HLA class I alleles expressed by the patient from which they were derived, which resulted in 599,241 short peptide HLA pairs. To assess the efficiency to discriminate positives from negatives, predictions were performed for each short peptide HLA pair and every 25mer was then assigned the best prediction score among its corresponding short peptides.
As a first comparison, we wanted to assess the HLA allele distribution compared in these datasets. For the literature dataset, HLA-A*02:01, HLA-A*03:01, HLA-A*24:02 and HLA-A*01:01 are the four most frequently reported restrictions, potentially reflecting study bias for these well characterized MHC molecules. However in the distribution of HLA alleles found in the NCI donor cohort, HLA-A*02:01 and HLA-A*03:01 and HLA-A*01:01 are the top most frequent alleles, suggesting that while the literature dataset is certainly over-representing well characterized alleles, at least these are also frequently found expressed in actual patients. This is further confirmed by the top two restricting MHC alleles in the NCI dataset being HLA-A*02:01 and HLA-A*03:01, which are both in the top four literature alleles. Given the large number of different HLA alleles and their population specific frequencies, the datasets examined cannot be expected to fully represent this diversity, but some frequent alleles are well covered.
Experimental identification of the HLA class i binding affinity thresholds for neoepitopes
We synthesized peptides corresponding to the 49 epitope sequences identified in curation round 1 and utilized purified HLA molecules and in vitro binding assays Citation31 to measure their binding affinity for the HLA molecule identified in the published studies as their restricting element. Supplemental Table 1 lists the measured affinities. The results as summarized in , establish that an HLA binding affinity threshold of 500 nM captures 92% of the epitopes and 5,000 nM captures 98%. These affinities are largely in agreement with a previously defined threshold for class I epitopes Citation11,Citation34, where a 500 nM affinity level identified 85% of epitopes derived from various pathogens. In conclusion, the data presented herein suggested that 500 nM is a suitable binding affinity threshold associated with the majority of mutated HLA class I restricted T cell epitopes, and 5,000 nM is a conservative threshold capturing close to 98% of all epitopes.
Figure 1. Measured and predicted affinity thresholds of different classes of epitopes. (A) Experimental identification of the HLA class I binding affinity thresholds for mutated cancer epitopes. 49 neoepitopes curated from literature were synthesized and utilizing purified HLA molecules in vitro binding assays Citation31 were performed to measure binding affinities. HLA binding affinity threshold of 500 nM (dashed line) captures 83% of the epitopes and 5000 nM captures 93%. (B) Predicted HLA binding affinities of mutated cancer epitopes establish thresholds similar to those obtained by experimental binding affinities. The HLA binding prediction tool NetMHCpan 2.8 was used to predict binding affinities of neoepitopes curated from literature. The NetMHCpan predicted IC50 threshold of 500nM identified about 84% of epitopes and 5000 nM identified 97%. These values are remarkably close to those determined experimentally. (C) Comparison of affinity thresholds of mutated cancer epitopes to viral epitopes. A set of 2,299 viral epitopes were retrieved from the Immune Epitope Database (IEDB) and HLA binding predictions were performed using NetMHCpan. Neoepitopes curated from literature were predicted to bind with a lower threshold than viral epitopes; the NetMHCpan 500 nM threshold identified 69%, and 5000 nM identified 85% of the IEDB viral epitopes. When neoepitopes received from the National Cancer Institute (NCI) were considered, the NetMHCpan 500 nM threshold identified 96%, and 5000 nM identified 100%. (D) Comparison of affinity thresholds of mutated cancer epitopes to other classes of cancer epitopes. Tumor-specific antigens (n = 64), differentiation antigens (n = 57), and cancer-specific overexpressed antigens (n = 92) were retrieved from the cancer epitope database and HLA binding predictions were performed using NetMHCpan. The predicted binding affinity threshold of 500 nM identified 75, 84, and 76% of shared, differentiation, and overexpressed antigen derived cancer epitopes, respectively, while 5,000nM identified 90, 97, and 88%, respectively
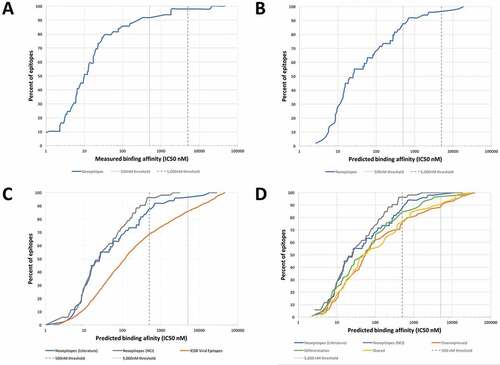
Predicted HLA binding affinities of mutated cancer epitopes establish thresholds similar to those obtained by experimental binding affinities
Experimental measurement of HLA binding affinities for a very large number of peptides is time and resource consuming. A more efficient alternative is the use of bioinformatics predictions of HLA binding. A number of algorithms are available that can perform this task. The IEDB analysis resource hosts validated and benchmarked algorithms that are freely available to the community Citation35, among them, NetMHCpan Citation36, which is a commonly utilized tool that provides quantitative affinity predictions for all alleles in our panel. Using the NetMHCpan tool, we wanted to define thresholds that could be utilized in mutated neoepitope prediction pipelines, at least partially removing the need for experimental determination of HLA binding. To keep the results comparable to the measured binding affinities we only considered the 49 epitopes for which experiments were performed. The result of this analysis is shown in , where the cumulative distribution of epitopes is shown as a function of NetMHCpan-predicted IC50 values. The NetMHCpan predicted IC50 threshold of 500nM identified about 88% of epitopes and 96% of epitopes were identified at 5000 nM. These values are remarkably close to those determined experimentally. Also, the measured and the predicted IC50 values were highly significantly correlated (Pearson’s correlation, r2 = 0.59631, p < 0.0001, Supplemental Figure S1). In conclusion, this analysis established that NetMHCpan predictions reliably estimated binding affinities of immunogenic neoepitopes described in the literature, and thus suggested that NetMHCpan could be utilized in subsequent analyses in lieu of actually experimentally measuring binding affinities.
Comparison of affinity thresholds between mutated cancer epitopes and viral epitopes
To directly compare the HLA affinity thresholds between mutated cancer epitopes and other types of epitopes, we assembled a set of viral epitopes taken as prototype non-self class-I restricted epitopes. As described in the methods, we retrieved viral T cell epitope sequences with defined HLA class I restriction from the IEDB resulting in a set of 2,299 viral epitopes. For each epitope, we generated NetMHCpan predicted binding affinities (IC50 in nM, Supplemental Table 4), and plotted the predicted IC50 values separately for each epitope category (). We found that the NetMHCpan 500 nM threshold identified 69% of the IEDB viral epitopes, which is a smaller fraction than the 88% of the neoepitopes curated from literature. To validate these findings we also considered neoepitopes received from the NCI (which were identified without any pre-selection based on MHC binding), and found that the 500 nM threshold identified 96% of epitopes which is an even greater fraction than the 88% of the neoepitopes curated from literature. Based on these results, mutated cancer epitopes bound with even higher affinity than viral epitopes.
Comparison of affinity thresholds between mutated cancer epitopes and other classes of cancer epitopes
The fact that mutated cancer epitopes actually bound better than viral epitopes was at first surprising, as previous studies had suggested that epitopes similar to self-antigens tended to have weaker MHC binding affinity, as T cells recognizing them would have been deleted based on negative selection otherwise. Citation12–Citation15 However, given that neoepitopes are different from self, we asked if lower affinities were a feature of cancer-associated epitopes that do not contain coding mutations in the epitopes themselves. To address this issue, we selected non-mutated epitopes from the Cancer epitope database (Supplemental Table 3) that were derived from tumor-specific antigens (ex. Melanoma Antigen Gene (MAGE); n = 64), differentiation antigens (ex. Carcinoembryonic antigen (CEA); n = 57) and overexpressed antigens (ex. Her2Neu; n = 92). The sequences of these non-mutated cancer epitopes are unchanged from their corresponding germline sequences, and their immune recognition is presumably a result of their source antigen being expressed in an unusual amount or in a tissue associated with tumor pathology. As shown in , non-mutated cancer epitopes also had predicted affinities better than viral epitopes, and similar to mutated cancer epitopes. More specifically, the predicted binding affinity (IC50) threshold of 500 nM identified 75%, 84%, and 76% of shared, differentiation, and overexpressed antigen derived cancer epitopes, respectively, compared to 88% and 69% for mutated and viral epitopes. These analyses suggested that high binding affinities are a general feature of tumor epitopes that might be necessary to overcome the immunosuppressive tumor environment and there is no evidence for lower affinities due to similarity of the recognized epitopes to self-antigens.
Assembly of a benchmark set of epitopes and background control peptides
Next, we wanted to systematically analyze the performance of various tools in successfully identifying immunogenic neoepitopes. For all following analyses, we used the unique literature dataset consisting of 64 immunogenic neoepitopes. To assess how well cancer T cell epitopes can be identified from within a given set of tumor mutations, we generated a control set of mutated peptides and their corresponding non-mutated counterparts based on mutation data extracted from The Cancer Genome Atlas database (TCGA). For each mutation extracted from TCGA, the corresponding nucleic acid sequence was translated into peptides that contained the mutated position. From this set of TCGA peptides, 100 peptides for each of the 64 neoepitopes were randomly selected. This ratio roughly reflects the situation in practice were approximately 1 in 50 tested peptides is positive. The background control dataset contained 6,400 peptides of length 8–11 residues in equal proportions, and were assigned HLA restrictions matching the distribution of restricting molecules found in the epitope dataset. This set of mutated peptides with unknown T cell recognition status served as a background distribution from which mutated epitopes with known T cell recognition status were to be picked out. This random background control dataset (randoms) together with the curated immunogenic neoepitopes (positives) is provided as a benchmark dataset in Supplemental Table 5.
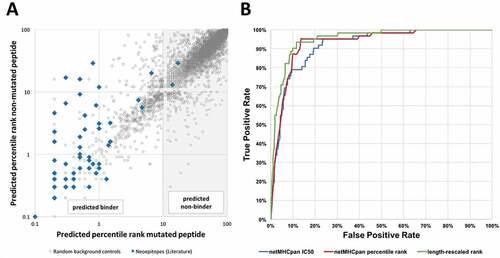
NetMHCpan version 2.8 was used to retrieve binding predictions for all curated neoepitopes and for the generated random control peptides. The predicted percentile rank of each non-mutant/mutant pair from the generated background dataset was plotted as grey dots in and compared to the ranks associated with neoepitopes recognized by T cells plotted as blue squares. The data indicated that 5,814 out of 6,400, (91%) background control peptides had predicted percentile ranks ≥ 10 and can therefore be considered non-binders. In contrast, all but two (97%) of experimentally confirmed neoepitopes had predicted percentile ranks below that threshold. This highlights how powerful MHC binding predictions are to pick out immunogenic epitopes from random mutations. The goal of our study was to refine neoepitope predictions beyond excluding clear non-binding peptides, so we excluded all peptides from further analysis that had affinities lower than this conservative threshold of 10 percentile ranks: 2 epitopes (3%) and 5,814 background controls (91%). This makes it more challenging to separate epitopes from the control dataset, and better highlights what approaches provide the most benefit in terms of improving predictions.
Figure 2. HLA class I binding affinity of neoepitopes is an excellent predictor of immunogenicity. (A) Predicted affinities for mutant and non-mutant peptide pairs of a benchmark set of epitopes and background control peptides. HLA binding predictions were performed using NetMHCpan and predicted percentile ranks of mutated peptides were plotted against those of non-mutated peptides. A threshold of 10 percentile ranks was determined to discriminate epitopes (blue squares) from background control peptides (grey dots). (B) ROC curves of different NetMHCpan binding prediction methods. Performance of the different NetMHCpan prediction methods IC50 (blue), percentile rank (red), and length-rescaled ranks (green) was assessed and prediction based on length-rescaled ranks was found to outperform the other methods
Quantitative HLA class i binding affinity of neoepitopes is an excellent predictor of immunogenicity
To test how well the predicted quantitative HLA class I binding affinity of a mutated peptide could separate known cancer epitopes from control peptides in the filtered (percentile rank < 10) benchmark dataset, we performed an ROC analysis to evaluate the classification accuracy of peptides into positives (epitopes) and non-epitopes (background peptides) based on the predicted affinities and percentile ranks. The overall results are shown in . On the filtered dataset, the AUC value for the predicted IC50 value to distinguish epitopes from controls was 0.920, which is remarkably good. In comparison, without removing the non-binders first, the AUC value is as high as 0.989, close to perfect and in a range where the practical relevance of differences in AUC values becomes obscured. We thus focus in the following on improving prediction performance in the more difficult filtered dataset of peptides with predicted percentile ranks < 10.
Table 2. Immunogenic neoepitope identification efficacy of different predictors (AUC values)
Next, we compared the performance of using the quantitative IC50 value vs. using the predicted percentile ranks using ROC plots (). For either measure, the ROC plot revealed that the prediction has most discriminatory power for very high affinities, where a quick gain of true positive predictions with few false negatives was observed. Once a true positive rate of ~ 95% was reached, the prediction quality tailed off, and a plateau was reached. The red curve indicating predictions using percentile ranks was consistently above the blue curve, indicating a trend that ranks outperformed quantitative affinity values, however, this difference in AUC was not significant when the two ROC curves were compared with a paired bootstrap test (p = 0.43, two-tailed Mann-Whitney test).
It is important to note that for an individual allele, the ROC curve using IC50 values or percentile ranks would be the same, as the ROC curve uses the predictions to order peptides from best to worst candidate. The improved performance when using percentile ranks over IC50 values in our dataset thus reflected the effect of mixing predictions for different MHC alleles. This confirmed previous findings that comparing predictions across alleles on a rank scale is more appropriate, presumably because some alleles intrinsically bind more peptides than others. Thus, comparing IC50 values tends to bias predictions towards certain alleles, as compared to what is seen in T cell recognition data. Citation37
Adjusting MHC binding affinity predictions by peptide length significantly improves epitope identification
The neoepitopes reported in the literature and utilized in the current study are between lengths 8–11. In many studies, only 9mer peptides are used for predictions, since this is the ‘canonical’ length of epitopes most frequently encountered in the case of MHC-I restriction. Citation38,Citation39 As shown in the red curve in Supplemental Figure S2, 9-mer predictions were effective when the goal was to keep the rate of false positive predictions extremely low, and clearly outperform predictions that treat all peptide length equally (blue curve) for false positive rates less than about 10%. However, by definition, such predictions can only identify the approximately 65% of epitopes that are indeed nine residues in size. Previous studies Citation40 indicated that accuracy of epitope predictions can be significantly improved by a model accounting for HLA allele-specific ligand length profiles, which reflect both the difference in length preference of binding to different HLA class I alleles and the differential availability of peptides of a given length for binding to HLA class I in the endoplasmic reticulum. We investigated whether this length based rescaling would improve the prediction of neoepitopes. Indeed, the rescaled predictions are remarkably effective with an AUC of 0.952 (), significantly outperforming the unbiased length predictions and the IC50 predictions (paired bootstrap test, p = 0.011 and p = 0.036, two-tailed Mann-Whitney test). This highlights the need to adjust pure HLA affinity predictions to take into account length preferences the antigen processing and presentation pathway.
Considering the HLA binding affinity of the non-mutated sequence
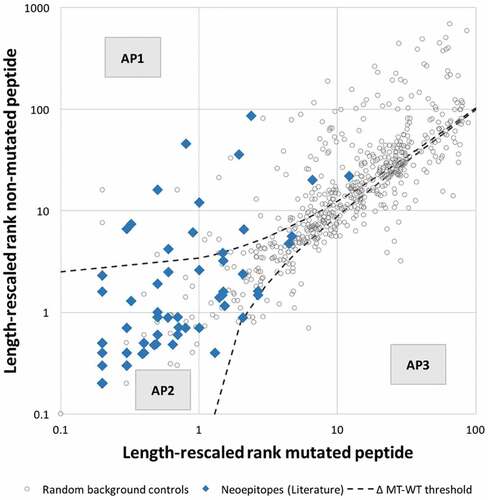
An additional parameter playing a potential role in the selection of mutated epitopes is the absolute HLA class I binding affinity of the non-mutated sequence from which the mutation is derived. During T cell maturation, the non-mutated sequence will be available for processing and presentation by HLA class I, and may impact positive and/or negative selection of T cells if they are cross-reactive with the mutated epitope sequence. This will depend on the affinity of the non-mutated peptide sequence. To investigate the affinity patterns of neoepitopes and their corresponding non-mutated counterparts, we used length-rescaled affinity rank predictions shown in the previous section to correlate best with epitope immunogenicity. Analogous to , length-rescaled ranks of each non-mutant/mutant pair in the epitope and background control dataset were plotted (). The results showed that 38 neoepitopes (61%) were predicted to bind stronger than their corresponding non-mutated counterpart, for 9 neoepitopes (15%) the non-mutated peptide was predicted to bind stronger, and in 15 instances (24%) the mutated and non-mutated had similar predicted length-adjusted percentile rank. This is an important observation, as several studies used this as a criterion and deprioritized neoepitopes if the mutation did not improve binding affinity above the non-mutated counterpart. Citation19,Citation27 Applying such a filter to our dataset would remove 39% of the neoepitopes, highlighting the need to use a threshold when filtering out neoepitopes with weaker binding affinity than the corresponding non-mutated peptide.
Figure 3. Peptide pairs can be categorized into three distinct affinity patterns. Analysis of the distribution of length-rescaled ranks of mutated/non-mutated peptide pairs revealed three distinct affinity patterns (APs): AP1 corresponds to peptides for which a substantial increase in affinity was associated with the mutational event, AP2 corresponds to peptides for which no appreciable change in binding affinity was introduced by the mutation, and AP3 corresponds to peptides for which a substantial decrease in affinity was associated with the mutational event
It was previously suggested that the difference of predicted binding affinity between the mutated peptide and its corresponding non-mutated counterpart is a better predictor of immunogenic neoepitopes.Citation19 We evaluated the performance of the proposed “differential agretopic index” (DAI) and found that tested on our dataset, it is performing worse than NetMHCpan predictions alone with an AUC of 0.86 when using percentile rank (as suggested by the authors) and 0.902 when using rescaled ranks.
Further inspection of revealed that peptides could be categorized into three distinct affinity patterns (APs). The first class of peptides, AP1, corresponded to peptides for which a substantial increase in affinity was associated with the mutational event. The second class, AP2, corresponded to those for which the difference in predicted binding affinity introduced by the mutation was limited. A third class of peptides, AP3, corresponded to peptides for which a substantial decrease in affinity was associated with the mutation. To determine if the definition of these classes of peptides allowed filtering out random control peptides more effectively, we systematically varied a threshold describing the difference in predicted percentile rank of the mutated and non-mutated peptide, filtered out all peptides falling into AP3 and assessed performance. We performed 5-fold cross-validation and found that at a threshold of 1.1–1.2, a large fraction of random peptides fall into AP3 and are filtered out, slightliy improving AUC when compared to length-rescaled predictions alone. We chose the less stringent threshold of 1.2 and found that at this threshold 145 background control peptides (25%), fall into the AP3 category while no epitope had decreased affinity above this threshold. 12 neoepitopes (19%) and 237 random control peptides (40%) fall into AP1, and 50 neoepitopes (81%) and 204 random controls (35%) fall into AP2. It is important to note, that the AP3 filter will perform best when no epitopes are filtered out and due to the small number of positives in our dataset it might be the case that the threshold of 1.2 is overfitted. Incorporating a filter that removes all peptides below the threshold 1.2, i.e. peptides in AP3, slightly improves AUC to 0.954, which was however not significant when compared to length-rescaled predictions alone ().
TAP transport and proteasomal cleavage predictions do not improve epitope identification
Proteasomal cleavage and TAP transport of epitopes and their precursors have been shown to have a sequence-dependent effect on the likelihood of a peptide to be recognized by T cells. To test the ability to incorporate these predictions into the epitope determination pipeline, we utilized the proteasomal cleavage and TAP transport predictions implemented in the IEDB. The proteasomal cleavage predictions alone and the TAP transport predictions alone gave AUC values of 0.572 and 0.584, respectively, and in combination gave an AUC value of 0.589 (). Notably, this is much lower than the performance these predictions have when evaluated on the benchmark data that includes peptides that are clear non-binders (percentile rank ≥ 10) where the combined AUC value reaches a respectable AUC of 0.779. The reduction in prediction performance in the benchmark dataset that focus on peptides with at least minimal MHC binding affinities indicates that peptides generated by the antigen processing and presentation machinery tend to have sequence motifs that also make them suitable as MHC binders. Within peptides that are reasonable MHC binders, the ability to distinguish epitopes from non-epitopes is much weaker. This becomes even more evident when combining the HLA class I binding predictions with processing predictions, for which the AUC of the combination is lower (0.906) than what could be obtained by HLA class I binding predictions alone (0.931). This suggested that incorporating processing predictions did not provide a boost to the epitope identification performance, and that MHC predictions by themselves essentially incorporate the major contribution of at least the proteasomal cleavage and TAP transport sequence preferences.
Stability prediction does not improve neoepitope identification
It has been reported that the stability of the MHC-peptide complex is a strong predictor of immunogenicity. Citation41,Citation42 To test the ability to utilize MHC-peptide stability predictions for neoepitope identification we used the prediction tool NetMHCstabpan. Citation43 Stability predictions alone and in combination with binding predictions, as recommended by the authors, Citation43 did not improve immunogenic neoepitope prediction performance when compared to binding prediction alone (). AUC values of stability predictions alone were lower (0.860 for stability prediction score and 0.890 for stability prediction percentile rank) than for binding predictions alone (0.931 for binding prediction percentile rank). Even when stability and binding predictions were combined (using the default combined setting of NetMHCstabpan), AUC values were lower than those for binding prediction alone.
The nature of amino acid substitutions has minor impact immunogenicity of mutated epitopes
Next, we analyzed neoepitopes for additional factors that could help understand what discriminates them from random control peptides. We hypothesized that when the epitope mutation is not associated with increased binding (i.e. AP2), there might be an increased need of the TCR facing residues to be different from the non-mutated sequence in order to overcome T cell tolerance. To test this hypothesis, we examined whether the substitutions found in mutated epitopes in AP2 were less conservative compared to control mutations in that region. We utilized the BLOSUM62 matrix to quantify the degree of similarity between a given peptide pair. While the similarity scores of peptide pairs in AP1 were not significantly different when compared to control peptides pairs, the difference for peptide pairs in AP2 was significant (p = 0.003, two-tailed Mann-Whitney test) (). This finding might be statistically significant, but it is not informative biologically, given the fact that the shift in similarity scores was very slight, and overlap of the score range was high. In line with this, incorporating a threshold for similarity score as a filtering step did not improve performance. Hence, the similarity score was not considered further in our selection scheme.
Figure 4. Impact of nature and position of amino acid substitutions on immunogenicity. Epitopes of the two affinity patterns (APs), i.e. AP1 (increased binding of mutated peptide) and AP2 (no significant increase in binding), were compared to the corresponding background control peptides. (A) The nature of amino acid substitutions does not impact immunogenicity of neoepitopes. The BLOSUM62 matrix was used to assess the degree similarity of the mutated peptide to the non-mutated counterpart in the epitope and background control datasets. The difference in similarity scores between epitopes and background control peptides was found to be significant for peptide pairs in AP2 (p = 0.003568, two-tailed Mann0Whitney test). (B) The type of specific residues found at mutated position contributes to the intrinsic immunogenicity of neoepitopes. The IEDB immunogenicity prediction tool was used to assess the immunogenicity of mutated and non-mutated peptides in the epitope and background control datasets. No significant difference between the immunogenicity scores of epitopes and background control peptides was
The residue composition of mutated epitopes has a minor impact to on immunogenicity
The amino acid composition of an MHC bound peptide in residue positions that are likely to be in contact with the TCR was shown to correlate with the likelihood of a peptide to be immunogenic. Citation21 Analogous to the similarity scores analysis described above, we incorporated the calculated immunogenicity scores, separately considering peptides in the AP1 and the AP2 categories (). We found no significant difference between the immunogenicity scores of epitopes and background control peptides neither in AP1 nor in AP2. Nevertheless, we wanted to analyze if including the immunogenicity score as a selection step into our prediction pipeline using the length adjusted percentile ranks provides a boost in performance. We systematically varied a threshold of the immunogenicity score and discarded all peptides with scores below that threshold. We found that with an immunogenicity score threshold of −0.43 neoepitopes could be marginally better discriminated from background control peptides, slightly improving the AUC to 0.953, compared to 0.952 when length-adjusted ranks were used alone. This filter removes 24 random peptides (4%) while no epitope is affected.
Establishment of neoepitope specific prediction rules
Based on our results above, we have defined an overall scheme based on which we would filter and prioritize candidate peptides to test for immune recognition. This scheme would be implemented as follows: 1) Given a selected set of cancer mutations, generate all 8–11 mers that overlap the mutations 2) Predict HLA binding affinity of each mutated and corresponding non-mutated peptide. Subsequently, apply three filtering steps that improve the immunogenicity prediction performance of neoepitopes: 3) Discard peptides with predicted percentile rank ≥ 10, 4) Discard peptides for which the corresponding non-mutant peptide binds more than 1.2 percentile points stronger than the mutant peptide, 5) Discard peptides with less than −0.43 immunogenicity score 6,) Rank the remaining peptides by their length-adjusted percentile rank HLA binding affinity. This scheme performs well on our filtered benchmark set with an AUC of 0.956, slightly outperforming length-rescaled ranks alone with an AUC of 0.952 (paired bootstrap test, p = 0.03801, two-tailed Mann-Whitney test, ).
To validate these findings and to rule out a class imbalance problem that might have been introduced by the large difference in the number of positives and random controls in the utilized dataset, we additionally used size matched subsamples of the background controls: we scaled the random background dataset down to match the numbers of positive epitopes and recalculated AUCs and thresholds for 100 different randomly sampled background control datasets. As expected, our findings remained unchanged: in 86 of 100 cases, ranks outperformed IC50 values, and in 96 of 100 cases, length-rescaled ranks outperformed ranks. The thresholds for AP3 and immunogenicity did not change in any of the subsamples.
While the improvement in performance is small, our filtering steps remove random control peptides so that the remaining candidate list is enriched for epitopes. Given that in a typical study or clinical setting, selected peptides from the candidate list would be synthesized and tested experimentally for T cell recognition, any such enrichment that can be reproducibly performed is highly beneficial.
Validation of results on an independent dataset of immunogenic neoepitopes from the national cancer institute (NCI)
To test the robustness of our initial findings, we repeated all steps from the analysis above on a completely independent set of immunogenic neoepitopes received from the NCI.
We first performed binding predictions using NetMHCpan version 2.8 and plotted the predicted percentile rank of each non-mutant/mutant pair analogous to , to compare the ranks associated with immunogenic neoepitopes (green squares) to ranks associated to peptides that were not recognized by T cells (green dots) (Figure S3). 70 negatives (2.5%) had predicted percentile ranks ≥ 10, while all positives had predicted ranks below this threshold.
We again evaluated the classification accuracy of each tool and could confirm that using length-adjusted percentile ranks outperforms all other prediction methods. All results are summarized in and ROC curves are plotted in Supplemental Figure S5. Next, we plotted the length-adjusted percentile rank of each mutant/non-mutant pair analogous to and assessed the previously defined affinity patterns (Figure S4). This analysis showed, that for 32.7% of the epitopes, the non-mutated peptide had better predicted length-rescaled ranks than the mutated peptide. This again highlights that it is critical not to filter out epitopes where the non-mutated counterpart binds better, but to use a threshold instead. The difference in ranks between mutated and non-mutated was smaller than our previously defined threshold of 1.2 for 51 of the 52 epitopes (98%). In contrast, for 12.9% of the negatives the difference was greater than 1.2, placing them in AP3 and eventually filtering them out. However, incorporating this threshold as a filtering steps does again not improve performance, as one epitope is lost. Slightly relaxing the threshold to 1.3 however, avoids filtering out that epitope and slightly improves performance to an AUC of 0.780 compared to an AUC of 0.777 when using length-rescaled ranks alone. Of note, when this relaxed AP3 threshold of 1.3 was applied to the literature dataset instead of the 1.2 threshold, the AUC remained unchanged at 0.954. The third filter, i.e. the 5th step in our proposed decision tree discarding peptides with less than −0.43 immunogenicity score, removed one negative peptide from this dataset. Taken together, applying our combined filters and using length-adjusted percentile ranks yields improved performance with an AUC of 0.782. These findings show that our initial results for using length-rescaled ranks for MHC binding predictions were reproduced on an independent dataset. However, additional thresholds for affinity patterns (AP3) that previously led to minor improvements were not robust and had to be relaxed. This suggests that the safest and most robust way to identify neoantigen candidates is to use MHC binding predictions.
Table 3. Prediction performance on NCI dataset (AUC values)
NetMHCpan version 4
Having established that MHC binding predictions are the most robust way to discriminate immunogenic neoepitopes from random control peptides and that allele-specific length-rescaling provides a noticeable boost in performance, we assessed the recently published most up-to-date version of NetMHCpan (version 4.0), which includes an allele-specific length-adjustment as an intrinsic step to the new method. Citation44 NetMHCpan4 was trained on naturally eluted ligands as well as on binding affinity data and therefore returns two predicted values: likelihood of a peptide becoming a natural ligand (EL), and predicted binding affinity (BA). We used NetMHCpan-4.0 to perform predictions for the NCI dataset. We found that NetMHCpan-4.0 EL percentile rank outperforms all other approaches with an AUC of 0.807 on the unfiltered dataset and 0.802 on the dataset, where non-binders were removed. This suggests that the simplest practical implementation for neoepitope identification is to use the NetMHCpan-4.0 EL scores, discard peptides with percentile ranks > 10, and rank the remainders in order.
Discussion
Recent years have witnessed a resurgence of interest and hope linked to personalized cancer immunotherapy. Citation4–Citation7,Citation45 This is in large part linked to the success of checkpoint blockade inhibitors, which promise to overcome immunosuppressive mechanisms that are believed to have hampered the ability of cancer vaccines to induce effective immune responses. In addition, today’s capacity for fast and comprehensive sequencing of genomes and transcriptomes of tumor samples from cancer patients makes it possible to design cancer vaccines to the specific mutations that could be immune targets in a patient’s tumor. It has however become evident that the vast majority of these neoepitope candidates do not induce a T cell response when tested in vivo or in vitro, i.e. most are not immunogenic. Citation24,Citation28,Citation46 Especially in patients with high mutational load, hundreds or even thousands of mutated peptides are commonly found based on sequencing approaches, highlighting the need to further narrow down this candidate list and increase the specificity in detecting immunogenic neoepitopes.
In our study, we assembled a dataset of known immunogenic neoepitopes to determine properties that distinguish them from other cancer-specific peptides arising from mutations. The most commonly used approach to select candidate T cell epitopes from a set of peptides is to determine their MHC binding affinity. A commonly used threshold to determine if a peptide is likely to be immunogenic was established over two decades ago, stating that most epitopes have a peptide:MHC binding affinity with an IC50 < 500 nM. Citation11 This threshold has been repeatedly validated for viral and other non-self origin epitopes but it is being controversially discussed whether the same threshold is also applicable for cancer epitopes. Citation15,Citation18,Citation19,Citation47 Neoepitopes are generally very similar to their non-mutated counterparts which are self-proteins that are subject to central tolerance. Thus, studies have suggested that the binding threshold for neoepitopes should be substantially higher than 500nM. Citation19 Based on our results in this study, we can confirm that the IC50 < 500 nM threshold is applicable for neoepitopes. 45 out of 49 analyzed neoepitopes (92%) had measured binding affinities of < 500 nM. Predicted binding affinities using NetMHCpan were highly correlated to the measured affinities, and 43 out of 49 analyzed neoepitopes (88%) had predicted binding affinities of < 500 nM. Surprisingly, we found that the association between HLA affinity and immunogenicity was even more pronounced for mutated epitope and other cancer epitopes in general as compared to epitopes of viral origin, where 1,579 out of 2,299 analyzed viral epitopes (69%) have predicted binding affinities < 500 nM. This finding might reflect the generally immunosuppressive environment associated with tumor sites, and in this scenario, the higher affinity of cancer epitopes might be required to compensate this immunosuppressive environment.
It is well recognized that immunogenicity in general and in the cancer setting in particular, is a complex process, influenced by multiple variables beyond MHC binding. In our study, we have evaluated several different predictors and we suggest that using binding prediction alone, i.e. length-rescaled percentile ranks, yields the most robust performance in discriminating immunogenic neoepitopes from a background set of mutated peptides as well as from a set of non-immunogenic mutated peptides. We did not find that using proteasomal cleavage or TAP transport predictions improve performance. In fact, whether proteasomal cleavage and TAP transport predictions should be incorporated into neoepitope prediction pipelines is another controversially discussed topic. Citation5,Citation45,Citation48 The fact that we did not see an increase in performance when combining binding and proteasomal cleavage and/or TAP transport predictions should however not be taken to signify that these processes are not relevant. Proteasomal cleavage prediction and TAP transport prediction alone achieved reasonable AUC values, showing that these tools indeed have predictive value, but this value gets lost when combined with binding predictions. This indicates that peptides generated by the antigen processing and presentation machinery tend to have sequence motifs that make them preferable as MHC binders, which is likely a result of co-evolution. Additionally, it is well known that antigen processing has a lower relative weight in the whole antigen processing and presenting machinery when compared to HLA binding. Citation34
There are several reports in the literature that the stability of the MHC-peptide complex is a stronger predictor of immunogenicity than peptide affinity alone. Citation41,Citation42 We used the peptide-MHC stability prediction tool NetMHCstabpan and could not confirm those previous reports since our results indicated that binding prediction alone performed better than both stability prediction alone and stability prediction in combination with binding.
Several studies have now confirmed that only a very small fraction (< 1%) of expressed mutations are immunogenic in cancer patients. Citation24,Citation49 In this context, it is often mentioned that the tumor microenvironment plays a critical role for antitumor T cell responses, not only by inhibiting existing T cells, but also by preventing T cell priming against neoepitopes. Citation50,Citation51 At the same time, it needs to be stressed that even in the context of e.g. poxvirus infection, the vast majority of peptides that could in principle be recognized by the immune system in any context of immune exposure are not. Citation34,Citation52 There are multiple aspects influencing immunodominance that impact which epitopes ultimately get recognized, ranging from variables associated with the antigen encoding the epitope (such as its abundance, cellular localization or kinetics of transcription), as well as conservation/cross-reactivity with other immune targets. These are also all relevant in the cancer setting, where expression level of the antigen itself, and the clonality of a mutation within the cancer cell population both impact the likelihood of detecting an immune response against it. Citation53 Our current analysis does not take any such factors into account and assumes that all peptides are equally accessible for T cell recognition.
Using a comprehensive dataset of mutated peptides as a background set, we show that known neoepitopes can be very efficiently picked based on predicted HLA binding affinity. Two important considerations stand out in this context. First, when considering binding affinities for different alleles together, there are different options to pick predicted positives from the combined set. We found that when considering peptides of different lengths, one cannot simply use the predicted binding affinities, but must consider the fact that different peptide lengths are intrinsically more or less favored, presumably due to differences in the efficiency with which they are processed and presented. We apply a length-rescaling approach developed for this purpose, Citation40 which mimics the length distribution found in naturally eluted ligands. This length-rescaling approach is only available for predictions based on NetMHCpan version 2.8, which considers all lengths equally likely to bind. The newest version of this algorithm, NetMHCpan-4.0, is taking length preferences for naturally eluted ligands directly into consideration during training, and which provides a simpler implementation of length-specific scores, and shows similar improvements in the identification of neo-epitopes. Citation44,Citation54,Citation55
The two epitope datasets utilized in our study are very different: First, it has to be noted that about half of the epitopes (37 out of 78) in the first dataset were curated from studies that used an HLA binding prediction tool to select candidate epitopes for testing. This introduces an HLA binding bias into this dataset, which is expected to lead to an overestimate of the performance. By removing 90% of the peptides from the background dataset that had low predicted binding affinity, we attempted to reduce this effect, and allow us to focus more on how other factors contribute to epitope recognition, but it is likely that some overestimation effect remains. Given the sparsity of completely unbiased epitope mapping data in the literature, we consider our approach a reasonable compromise between lack of bias and retaining a reasonably large dataset.
Another important difference between the datasets is that the first one is comprised of peptide epitopes mapped to their minimal length and have known restrictions to specific HLA molecules in the patient that recognized them. The second dataset consists of 25-mer peptides spanning the mutation, with no restriction defined. A single 25-mer contains 17 x 9-mers, 16 x 10-mers, 15 x 11-mers = 48 potential minimal peptides, restricted by any of the HLA class I molecules expressed in a patient. Most likely, only one of these minimal peptide:HLA combinations will be the true epitope recognized within the 25-mer peptide that got a T cell response in a patient. Distinguishing a positive long peptide from a negative long peptide, where it is not known what the actual recognized minimal epitope is, or what HLA it is restricted by, is intrinsically harder than distinguishing positive vs. negative minimal peptides for a defined HLA restrictions, as is the case for the first dataset. This explains why the AUC values are systematically lower for the second set compared to the first set. On the other hand: The difference in prediction performance highlight that testing longer peptides for T cell recognition experimentally is a very efficient way to reduce the number of tests that need to be performed, which can be especially important if patient samples are limited. Once positive long peptides have been identified, subsequent experiments can still narrow down minimal epitopes if desired. This stresses that predictions are particularly effective at identifying minimal epitopes, but this might not be the most effective strategy if samples are limited for testing.
In terms of limitations of the present study, it is important to emphasize that our current analysis is focused on neoepitopes derived from point mutations and does not consider epitopes derived from insertions, deletions, translocations, fusions, etc. These classes of neoepitopes are often thought to be more immunogenic as they usually more significantly differ from self-peptidesCitation8. More recently, additional classes of unconventional epitopes have emerged and are being appreciated as valuable targets for cancer immunotherapy. Citation56–Citation58 As more datasets about immunogenicity of such epitopes becomes available, our analysis should be expanded to cover them as well.
Overall, our study provides an actionable and straightforward way to implement selection scheme for T cell epitope candidates from a set of mutations. While we did validate our results with an independent dataset of additional immunogenic neoepitopes, we would have much preferred to conduct larger scale validation. Unfortunately, such data is very limited at this time. Currently ongoing efforts such as the Tumor Neoantigen Selection Alliance (TESLA), will provide such validation opportunities.
Currently, the IEDB does not curate cancer epitopes, as its mandate is focused on infectious diseases, allergy, and autoimmunity. However, there is clearly a need for a centralized resource and database, freely available to the scientific community. As studies reporting immunogenic neoepitopes are being published regularly, capturing and centrally storing neoepitope data on an ongoing basis would provide up-to-date datasets that could highly facilitate our understanding of what makes a good immunogenic neoepitope.
Methods
Curation of mutated cancer epitopes from literature
The first set of neoepitopes were assembled in February of 2016 (round 1). Mutated epitope sequences, as well as corresponding non-mutated sequences, were obtained from ‘Mutations ʹ provided in the Cancer Immunity Peptide Database [www.cancerimmunity.org/peptide], a data resource from the Cancer Research Institute. Additional mutated epitopes were identified using an expanded keyword search of the published literature (PubMed), in parallel with a survey seeking input from various cancer immunologists. Briefly, we modified the standard IEDB query Citation59,Citation60 which retrieves papers containing epitope information, by adding the keywords ‘neo-epitope, neoepitope, neo-antigen, neoantigen, chromosomal translocation, chromosomal translocations, mutanome.’ In total, 80 papers were retrieved by this expanded query and their neoepitope content was manually verified by experts. We used stringent inclusion criteria and included only minimal epitopes. Also, epitopes were only included if a corresponding epitope-specific T cell was shown to be capable of recognizing autologous tumor cells. We only considered epitopes that i) result from single nucleotide variants, ii) are of lengths 8–11 amino acids, and iii) have a defined HLA class I allele restriction that was covered by one of the alleles in our binding assay repertoire encompassing 49 common HLA A and B specificities. Citation31 As result, a total of 49 unique mutated epitopes included in this first set of curated neoepitopes. For all mutated and non-mutated peptides in this set, experimental HLA binding measurements were performed. In January of 2018, an additional set of neoepitopes was assembled using the same query as described above (round 2). We identified 15 additional papers that contained suitable information regarding neoepitopes associated with positive T cell responses in humans and known HLA class I restriction at the 4-digit level. This second set of curated neoepitopes consisted of 29 neoepitopes (Supplemental Table 1).
We received an additional set of peptides from the Surgery Branch at the National Cancer Institute (NCI) for which T cell recognition status had been experimentally determined. This set contained 2,844 peptides of which 56 were recognized by T cells (positives) while 2,788 were not (negatives). To be consistent with the literature datasets, we only considered peptides derived from nonsynonymous point mutations, resulting in the removal of 28 peptides that were derived from indel mutations. We also removed four neoepitopes, that were only recognized by CD4 T cells. The final NCI dataset that was investigated in this study consisted of 52 positives and 2,760 negatives (Supplemental Table 2).
Several of the peptides from the NCI dataset were also published, Citation46,Citation61–Citation63 which resulted in an overlap with the curated literature dataset. To keep the datasets distinct from each other, we filtered the literature dataset and removed all peptides included in the NCI dataset for all bioinformatics and statistical analyses. From the 78 peptide HLA pairs that were initially curated, 14 peptides were removed because they overlapped with peptides in the NCI dataset. As a result, the final literature dataset consisted of 64 unique peptide HLA pairs.
Assembly of additional epitopes (viral and non-mutated cancer origin)
Epitopes from cancer antigens that did not involve coding mutations were also obtained from the Cancer Immunity Peptide Database. This included epitopes from shared tumor-specific antigens (e.g. MAGE; n = 64), differentiation antigens (e.g. CEA, Tyrosinase; n = 57) and overexpressed antigens (e.g. Telomerase, Her2Neu; n = 92, Supplemental Table 3). A control set of 2299 viral epitopes with defined HLA class I restriction was also retrieved from the IEDB (Query criteria: source organism = viruses, restriction = HLA class I, T cell response = positive.) Query results were filtered using the same length and HLA restriction as for cancer epitopes above (Supplemental Table 4).
Background dataset generation
A set of peptides covering cancer mutations and their corresponding non-mutated counterparts was generated to serve as a background control. Somatic mutation data from the publicly available TCGA data portal were downloaded for the 33 cancer types available on the TCGA website (http://cancergenome.nih.gov/). Mutation annotated files (MAF format version 2.2) were extracted from the Somatic Mutations directories of each dataset. From these, missense mutations resulting from single nucleotide variants were randomly selected so that the number of mutations selected from each file was proportional to the total number of mutations contained in that file. For each of these randomly selected mutations, peptide sequences for all possible 8, 9, 10 and 11-mer peptides overlapping the mutation were taken into consideration. We randomly picked 100 control peptides for each of the 64 neoepitopes in our curated literature dataset described above. The control peptide pairs were assigned the same HLA restriction as the neoepitope for which they were picked (Supplemental Table 5).
HLA class I binding measurements
Purification of HLA class I molecules and quantitative competitive inhibition assays to measure the binding affinity of peptides to purified HLA class I were performed as previously described. Citation31 Briefly, 0.1–1 nM of a high-affinity radiolabeled peptide is co-incubated at room temperature with 1 µM to 1 nM of purified HLA class I in the presence of a cocktail of protease inhibitors and 1 µM β-microglobulin. Following a two-day incubation, HLA class I bound radioactivity is determined by capturing HLA class I/peptide complexes on W6/32 (anti-class I) antibody coated Lumitrac 600 plates (Greiner Bio-one, Frickenhausen, Germany), and measuring bound cpm using the TopCount (Packard Instrument Co., Meriden, CT) microscintillation counter, and the concentration of peptide yielding 50% inhibition of the binding of the radiolabeled peptide is calculated. Under the conditions utilized, where [label]<[HLA class I] and IC50 ≥ [HLA class I], the measured IC50 values are reasonable approximations of true Kd values. Citation64,Citation65 Each competitor peptide is tested at six different concentrations covering a 100,000-fold dose range, and in three or more independent experiments. As a positive control, the unlabeled version of the radiolabeled probe is also tested in each experiment. The dataset has been submitted to the Immune Epitope database, submission: http://www.iedb.org/subid/1000715.
HLA class i binding predictions
Binding predictions were performed using the command-line version of NetMHCpan version 2.8 available on the Immune Epitope Database website (http://www.iedb.org).Citation35,Citation36,Citation66 NetMHCpan was selected because it consistently performs as one of the best prediction tools across a wide array of alleles, and also provides predicted IC50 nM values for the complete set of common class I alleles considered here. Citation67,Citation68 In addition to predicted affinity (IC50), NetMHCpan also provides a percentile score expressing the relative capacity of each peptide to bind each specific allele, compared to a universe of potential sequences of the same size. While newer versions of NetMHCpan are available, we focused on the 2.8 version as only for this implementation a length-rescaling model is available, as described by Trolle et al. Citation40 Briefly, ligands from five common HLA class I alleles were eluted and the allele-specific length-distribution of ligands was determined. This data showed that different MHC alleles have different length preferences and that these preferences seem to have an impact on the length distribution of naturally processed ligands. These findings were translated into a normalization model that corrects predicted percentile ranks from NetMHCpan 2.8 and provides more accurate length-rescaled ranks. Citation40 A tool implementing this model can be accessed via the IEDB Analysis Resource (http://tools.iedb.org/mhci/, select “Prediction Method” “NetMHCpan 2.8”)Citation69.
To test the added value of HLA binding stability, we used the prediction tool NetMHCstabpan (Version 1.0) Citation43 and performed stability predictions alone and in combination with affinity predictions as recommended by the authors.
Processing predictions
In order to evaluate the performance of proteasomal cleavage and TAP transport predictions, we used the combined processing predictor implemented in the IEDB (http://tools.iedb.org/processing/). This tool allows combined prediction of a peptide’s intrinsic characteristics and provides separate prediction scores for proteasomal cleavage, TAP transport, and HLA class I binding affinity, as well as combined scores for processing (proteasomal cleavage and TAP transport combined) and a total score which combines all three predictions. Scores are combined by a simple linear model adding up individual scores on log scale. Citation70
Assessment of sequence similarity
To assess the similarity of the mutated epitopes and their non-mutated counterparts, we used a BLOSUM matrix, which is based on the frequency of amino acid substitutions observed in evolutionarily related protein sequences.Citation71,Citation72 A BLOSUM matrix contains log-odds scores for each of the possible substitutions of the 20 amino acids, where highly conserved amino acids have the highest scores, while non-conservative substitutions have negative scores. We used the BLOSUM62 matrix, which is generated based on protein sequence alignments of 62% identity or less. For each pair of the mutated epitope and corresponding non-mutant peptide, we calculated the similarity score as previously described. Citation73 Briefly, for two peptides a and b the similarity score is calculated as the BLOSUM score for a and b divided by the square root of the product of the BLOSUM scores of the two peptides aligned to themselves. This method assigns two identical peptides a similarity score of 1.
Immunogenicity predictions based on amino acid composition
We used the IEDB immunogenicity prediction tool (http://tools.iedb.org/immunogenicity/) which assigns a score to a given peptide based on its amino acid composition at residues not directly involved in binding to the MHC molecule as previously described. Citation21
Predictions for the NCI dataset
Peptide sequences provided for analysis by the NCI Surgery Department consisted of 25 amino acids (25mer) with the mutation in the center of the peptide. For each peptide, the HLA class I alleles expressed by the corresponding patient were also provided. We considered all possible peptides of lengths 8–11 that were contained in each 25mer and contained the mutation. Each of these short peptides were paired with each of the corresponding HLA class I alleles, resulting in 599,241 short peptide HLA pairs. For each of these pairs, all above-mentioned predictions and calculations were performed individually. Every 25mer was then assigned the best prediction score among its short peptide HLA pairs.
Performance assessment and statistical calculations
The R package pROC was used for performing ROC analysis, calculating AUCs and performing paired bootstrap tests of ROC curves.Citation74
Disclosure of interest
The authors report no conflict of interest
Supplemental Material
Download Zip (3 MB)Acknowledgments
Research reported in this publication was supported by the National Institute Of Allergy And Infectious Diseases of the National Institutes of Health under Award Number R21AI134127. The content is solely the responsibility of the authors and does not necessarily represent the official views of the National Institutes of Health.
Supplementary material
Supplementary material can be accessed here.
Additional information
Funding
References
- Coulie PG, Van den Eynde BJ, van der Bruggen P, Boon T. Tumour antigens recognized by T lymphocytes: at the core of cancer immunotherapy. Nat Rev Cancer. 2014;14:135–146. doi:10.1038/nrc3670.
- Hacohen N, Fritsch EF, Carter TA, Lander ES, Wu CJ. Getting personal with neoantigen-based therapeutic cancer vaccines. Cancer Immunol Res. 2013;1:11–15. doi:10.1158/2326-6066.CIR-13-0022.
- Rosenberg SA, Yang JC, Restifo NP. Cancer immunotherapy: moving beyond current vaccines. Nat Med. 2004;10:909–915. doi:10.1038/nm1100.
- Schumacher TN, Hacohen N. Neoantigens encoded in the cancer genome. Curr Opin Immunol. 2016;41:98–103. doi:10.1016/j.coi.2016.07.005.
- Schumacher TN, Schreiber RD. Neoantigens in cancer immunotherapy. Science. 2015;348:69–74. doi:10.1126/science.aaa4971.
- Delamarre L, Mellman I, Yadav M. Cancer immunotherapy. Neo approaches to cancer vaccines. Science. 2015;348:760–761. doi:10.1126/science.aab3465.
- Gubin MM, Artyomov MN, Mardis ER, Schreiber RD. Tumor neoantigens: building a framework for personalized cancer immunotherapy. J Clin Invest. 2015;125:3413–3421. doi:10.1172/JCI80008.
- Wang RF, Wang HY. Immune targets and neoantigens for cancer immunotherapy and precision medicine. Cell Res. 2017;27:11–37. doi:10.1038/cr.2016.155.
- Pardoll DM. The blockade of immune checkpoints in cancer immunotherapy. Nat Rev Cancer. 2012;12:252–264. doi:10.1038/nrc3239.
- Melero I, Berman DM, Aznar MA, Korman AJ, Perez Gracia JL, Haanen J. Evolving synergistic combinations of targeted immunotherapies to combat cancer. Nat Rev Cancer. 2015;15:457–472. doi:10.1038/nrc3973.
- Sette A, Vitiello A, Reherman B, Fowler P, Nayersina R, Kast WM, Melief CJ, Oseroff C, Yuan L, Ruppert J, et al. The relationship between class I binding affinity and immunogenicity of potential cytotoxic T cell epitopes. J Immunol. 1994;153:5586–5592.
- Fairchild PJ, Wraith DC. Lowering the tone: mechanisms of immunodominance among epitopes with low affinity for MHC. Immunology Today. 1996;17. 80–85.
- Gammon G, Sercarz E. Does the presence of self-reactive T cells indicate the breakdown of tolerance? Clin Immunol Immunopathol. 1990;56. 287–297.
- Kawakami Y, Robbins PF, Rosenberg SA. Human melanoma antigens recognized by T lymphocytes. Keio J Med. 1996;45. 100–108.
- Smilek DE, Ehlers MR, Nepom GT. Restoring the balance: immunotherapeutic combinations for autoimmune disease. Dis Model Mech. 2014;7:503–513. doi:10.1242/dmm.015099.
- Keogh E, Fikes J, Southwood S, Celis E, Chesnut R, Sette A. Identification of new epitopes from four different tumor-associated antigens: recognition of naturally processed epitopes correlates with HLA-A*0201-binding affinity. J Immunol. 2001;167. 787–796.
- Valli A, Sette A, Kappos L, Oseroff C, Sidney J, Miescher G, Hochberger M, Albert ED, Adorini L. Binding of myelin basic protein peptides to human histocompatibility leukocyte antigen class II molecules and their recognition by T cells from multiple sclerosis patients. J Clin Invest. 1993;91:616–628. doi:10.1172/JCI116242.
- Engels B, Engelhard VH, Sidney J, Sette A, Binder DC, Liu RB, Kranz DM, Meredith SC, Rowley DA, Schreiber H. Relapse or eradication of cancer is predicted by peptide-major histocompatibility complex affinity. Cancer Cell. 2013;23:516–526. doi:10.1016/j.ccr.2013.03.018.
- Duan F, Duitama J, Al Seesi S, Ayres CM, Corcelli SA, Pawashe AP, Blanchard T, McMahon D, Sidney J, Sette A, et al. Genomic and bioinformatic profiling of mutational neoepitopes reveals new rules to predict anticancer immunogenicity. J Exp Med. 2014;211:2231–2248. doi:10.1084/jem.20141308.
- Hackl H, Charoentong P, Finotello F, Trajanoski Z. Computational genomics tools for dissecting tumour-immune cell interactions. Nat Rev Genet. 2016;17:441–458. doi:10.1038/nrg.2016.67.
- Calis JJ, Maybeno M, Greenbaum JA, Weiskopf D, De Silva AD, Sette A, Keşmir C, Peters B. Properties of MHC class I presented peptides that enhance immunogenicity. PLoS Comput Biol. 2013;9:e1003266. doi:10.1371/journal.pcbi.1003266.
- Backert L, Kohlbacher O. Immunoinformatics and epitope prediction in the age of genomic medicine. Genome Med. 2015;7:119. doi:10.1186/s13073-015-0245-0.
- Rizvi NA, Hellmann MD, Snyder A, Kvistborg P, Makarov V, Havel JJ, Lee W, Yuan J, Wong P, Ho TS, et al.Cancer immunology. Mutational landscape determines sensitivity to PD-1 blockade in non-small cell lung cancer. Science. 2015;348:124–128. doi:10.1126/science.aaa1348.
- Yadav M, Jhunjhunwala S, Phung QT, Lupardus P, Tanguay J, Bumbaca S, Franci C, Cheung TK, Fritsche J, Weinschenk T, et al.Predicting immunogenic tumour mutations by combining mass spectrometry and exome sequencing. Nature. 2014;515:572–576. doi:10.1038/nature14001.
- Rooney MS, Shukla SA, Wu CJ, Getz G, Hacohen N. Molecular and genetic properties of tumors associated with local immune cytolytic activity. Cell. 2015;160:48–61. doi:10.1016/j.cell.2014.12.033.
- Kreiter S, Vormehr M, van de Roemer N, Diken M, Lower M, Diekmann J, Boegel S, Schrörs B, Vascotto F, Castle JC. Mutant MHC class II epitopes drive therapeutic immune responses to cancer. Nature. 2015;520:692–696. doi:10.1038/nature14426.
- Gubin MM, Zhang X, Schuster H, Caron E, Ward JP, Noguchi T, Ivanova Y, Hundal J, Arthur CD, Krebber WJ, et al. Checkpoint blockade cancer immunotherapy targets tumour-specific mutant antigens. Nature. 2014;515:577–581. doi:10.1038/nature13988.
- Carreno BM, Magrini V, Becker-Hapak M, Kaabinejadian S, Hundal J, Petti AA, Ly A, Lie WR, Hildebrand WH, Mardis ER, et al. Cancer immunotherapy. A dendritic cell vaccine increases the breadth and diversity of melanoma neoantigen-specific T cells. Science. 2015;348:803–808. doi:10.1126/science.aaa3828.
- Brown SD, Warren RL, Gibb EA, Martin SD, Spinelli JJ, Nelson BH, Holt RA. Neo-antigens predicted by tumor genome meta-analysis correlate with increased patient survival. Genome Res. 2014;24:743–750. doi:10.1101/gr.165985.113.
- Robinson J, Waller MJ, Parham P, De Groot N, Bontrop R, Kennedy LJ, Stoehr P, Marsh SG. IMGT/HLA and IMGT/MHC: sequence databases for the study of the major histocompatibility complex. Nucleic Acids Res. 2003;31:311–314.
- Sidney J, Southwood S, Moore C, Oseroff C, Pinilla C, Grey HM, Sette A. Measurement of MHC/peptide interactions by gel filtration or monoclonal antibody capture. Curr Protoc Immunol. 2013. Chapter 18:Unit 18 3. doi:10.1002/0471142735.im1803s100.
- Vita R, Overton JA, Greenbaum JA, Ponomarenko J, Clark JD, Cantrell JR, Wheeler DK, Gabbard JL, Hix D, Sette A, et al. The immune epitope database (IEDB) 3.0. Nucleic Acids Res. 2015;43:D405–12. doi:10.1093/nar/gku938.
- Tran E, Robbins PF, Rosenberg SA. ‘Final common pathway’ of human cancer immunotherapy: targeting random somatic mutations. Nat Immunol. 2017;18:255–262. doi:10.1038/ni.3682.
- Assarsson E, Sidney J, Oseroff C, Pasquetto V, Bui H H, Frahm N, Brander C, Peters B, Grey H, Sette A. A quantitative analysis of the variables affecting the repertoire of t cell specificities recognized after vaccinia virus infection. J Immunol. 2007;178:7890–7901.
- Kim Y, Ponomarenko J, Zhu Z, Tamang D, Wang P, Greenbaum J, Lundegaard C, Sette A, Lund O, Bourne PE, et al. Immune epitope database analysis resource. Nucleic Acids Res. 2012;40:W525–30. doi:10.1093/nar/gks438.
- Hoof I, Peters B, Sidney J, Pedersen LE, Sette A, Lund O, Buus S, Nielsen M. NetMHCpan, a method for MHC class I binding prediction beyond humans. Immunogenetics. 2009;61:1–13. doi:10.1007/s00251-008-0341-z.
- Paul S, Weiskopf D, Angelo MA, Sidney J, Peters B, Sette A. HLA class I alleles are associated with peptide-binding repertoires of different size, affinity, and immunogenicity. J Immunology. 1950;2013(191):5831–5839. (Baltimore, Md.
- Neefjes J, Jongsma ML, Paul P, Bakke O. Towards a systems understanding of MHC class I and MHC class II antigen presentation. Nat Rev Immunol. 2011;11:823–836. doi:10.1038/nri3084.
- Rammensee HG, Falk K, Rotzschke O. Peptides naturally presented by MHC class I molecules. Annu Rev Immunol. 1993;11:213–244. doi:10.1146/annurev.iy.11.040193.001241.
- Trolle T, McMurtrey CP, Sidney J, Bardet W, Osborn SC, Kaever T, Sette A, Hildebrand WH, Nielsen M, Peters B.The length distribution of class I-restricted T cell epitopes is determined by both peptide supply and MHC Allele-specific binding preference. J Immunol. 2016;196:1480–1487. doi:10.4049/jimmunol.1501721.
- Strø nen E, Toebes M, Kelderman S, van Buuren MM, Yang W, van Rooij N, Donia M, Böschen ML, Lund-Johansen F, Olweus J, et al.Targeting of cancer neoantigens with donor-derived T cell receptor repertoires. Science. 2016;352:1337–1341. doi:10.1126/science.aaf2288.
- van der Burg SH, Visseren MJ, Brandt RM, Kast WM, Melief CJ. Immunogenicity of peptides bound to MHC class I molecules depends on the MHC-peptide complex stability. J Immunol. 1996;156. 3308–3314.
- Rasmussen M, Fenoy E, Harndahl M, Kristensen AB, Nielsen IK, Nielsen M, Buus S. Pan-specific prediction of peptide-MHC class I complex stability, a correlate of T cell immunogenicity. J Immunol. 2016;197:1517–1524. doi:10.4049/jimmunol.1600582.
- Jurtz V, Paul S, Andreatta M, Marcatili P, Peters B, Nielsen M. NetMHCpan-4.0: improved peptide-MHC class I interaction predictions integrating eluted ligand and peptide binding affinity data. J Immunol. 2017;199:3360–3368. doi:10.4049/jimmunol.1700893.
- Yarchoan M, Johnson BA 3rd, Lutz ER, Laheru DA, Jaffee EM. Targeting neoantigens to augment antitumour immunity. Nat Rev Cancer. 2017;17:209–222. doi:10.1038/nrc.2016.154.
- Robbins PF, Lu YC, El-Gamil M, Li YF, Gross C, Gartner J, Lin JC,Teer JK, Cliften P, Tycksen E, et al. Mining exomic sequencing data to identify mutated antigens recognized by adoptively transferred tumor-reactive T cells. Nat Med. 2013;19:747–752.
- Brennick CA, George MM, Corwin WL, Srivastava PK, Ebrahimi-Nik H. Neoepitopes as cancer immunotherapy targets: key challenges and opportunities. Immunotherapy. 2017;9:361–371. doi:10.2217/imt-2016-0146.
- Lundegaard C, Lund O, Buus S, Nielsen M. Major histocompatibility complex class I binding predictions as a tool in epitope discovery. Immunology. 2010;130:309–318. doi:10.1111/j.1365-2567.2010.03300.x.
- van Rooij N, van Buuren MM, Philips D, Velds A, Toebes M, Heemskerk B, van Dijk LJ, Behjati S, Hilkmann H, El Atmioui D, et al. Tumor exome analysis reveals neoantigen-specific T-cell reactivity in an ipilimumab-responsive melanoma. J Clin Oncol. 2013;31:e439–42. doi:10.1200/JCO.2012.47.7521.
- Chen DS, Mellman I. Oncology meets immunology: the cancer-immunity cycle. Immunity. 2013;39:1–10. doi:10.1016/j.immuni.2013.07.012.
- Smyth MJ, Ngiow SF, Ribas A, Teng MW. Combination cancer immunotherapies tailored to the tumour microenvironment. Nat Rev Clin Oncol. 2016;13:143–158. doi:10.1038/nrclinonc.2015.209.
- Moutaftsi M, Tscharke DC, Vaughan K, Koelle DM, Stern L, Calvo-Calle M, Ennis F, Terajima M, Sutter G, Crotty S, et al. Uncovering the interplay between CD8, CD4 and antibody responses to complex pathogens. Future Microbiol. 2010;5:221–239. doi:10.2217/fmb.09.110.
- McGranahan N, Furness AJ, Rosenthal R, Ramskov S, Lyngaa R, Saini SK, Jamal-Hanjani M, Wilson GA, Birkbak NJ, Hiley CT, et al. Clonal neoantigens elicit T cell immunoreactivity and sensitivity to immune checkpoint blockade. Science. 2016;351:1463–1469. doi:10.1126/science.aaf1490.
- Bjerregaard AM, Nielsen M, Jurtz V, Barra CM, Hadrup SR, Szallasi Z, Eklund AC. An analysis of natural T cell responses to predicted tumor neoepitopes. Front Immunol. 2017;8:1566. doi:10.3389/fimmu.2017.01566.
- Bassani-Sternberg M, Chong C, Guillaume P, Solleder M, Pak H, Gannon PO, Kandalaft LE, Coukos G, Gfeller D. Deciphering HLA-I motifs across HLA peptidomes improves neo-antigen predictions and identifies allostery regulating HLA specificity. PLoS Comput Biol. 2017;13:e1005725. doi:10.1371/journal.pcbi.1005731.
- Ho O, Green WR. Alternative translational products and cryptic T cell epitopes: expecting the unexpected. J Immunol. 2006;177. 8283–8289.
- Starck SR, Shastri N. Non-conventional sources of peptides presented by MHC class I. Cell Mol Life Sci. 2011;68:1471–1479. doi:10.1007/s00018-011-0655-0.
- Starck SR, Shastri N. Nowhere to hide: unconventional translation yields cryptic peptides for immune surveillance. Immunol Rev. 2016;272:8–16. doi:10.1111/imr.12434.
- Seymour E, Damle R, Sette A, Peters B. Cost sensitive hierarchical document classification to triage PubMed abstracts for manual curation. BMC Bioinformatics. 2011;12:482. doi:10.1186/1471-2105-12-482.
- Wang P, Morgan AA, Zhang Q, Sette A, Peters B. Automating document classification for the immune epitope database. BMC Bioinformatics. 2007;8:269. doi:10.1186/1471-2105-8-269.
- Lu YC, Yao X, Crystal JS, Li YF, El-Gamil M, Gross C, Davis L, Dudley ME, Yang JC, Samuels Y, et al. Efficient identification of mutated cancer antigens recognized by T cells associated with durable tumor regressions. Clin Cancer Res. 2014;20:3401–3410. doi:10.1158/1078-0432.CCR-14-0433.
- Gros A, Parkhurst MR, Tran E, Pasetto A, Robbins PF, Ilyas S, Prickett TD, Gartner JJ, Crystal JS, Roberts IM, et al. Prospective identification of neoantigen-specific lymphocytes in the peripheral blood of melanoma patients. Nat Med. 2016;22:433–438. doi:10.1038/nm.4051.
- Cohen CJ, Gartner JJ, Horovitz-Fried M, Shamalov K, Trebska-McGowan K, Bliskovsky VV, Parkhurst MR, Ankri C, Prickett TD, Crystal JS, et al. Isolation of neoantigen-specific T cells from tumor and peripheral lymphocytes. J Clin Invest. 2015;125:3981–3991. doi:10.1172/JCI82416.
- Gulukota K, Sidney J, Sette A, DeLisi C. Two complementary methods for predicting peptides binding major histocompatibility complex molecules. J Mol Biol. 1997;267:1258–1267. doi:10.1006/jmbi.1997.0937.
- Cheng Y, Prusoff WH. Relationship between the inhibition constant (K1) and the concentration of inhibitor which causes 50 per cent inhibition (I50) of an enzymatic reaction. Biochem Pharmacol. 1973;22. 3099–3108.
- Peters B, Sette A. Generating quantitative models describing the sequence specificity of biological processes with the stabilized matrix method. BMC Bioinformatics. 2005;6:132. doi:10.1186/1471-2105-6-132.
- Peters B, Bui H H, Frankild S, Nielsen M, Lundegaard C, Kostem E, Basch D, Lamberth K, Harndahl M, Fleri W, et al. A community resource benchmarking predictions of peptide binding to MHC-I molecules. PLoS Comput Biol. 2006;2:e65. doi:10.1371/journal.pcbi.0020065.
- Trolle T, Metushi IG, Greenbaum JA, Kim Y, Sidney J, Lund O, Sette A, Peters B, Nielsen M. Automated benchmarking of peptide-MHC class I binding predictions. Bioinformatics. 2015. doi:10.1093/bioinformatics/btv123.
- Fleri W, Paul S, Dhanda SK, Mahajan S, Xu X, Peters B, Sette A. The immune epitope database and analysis resource in epitope discovery and synthetic vaccine design. Front Immunol. 2017;8:278. doi:10.3389/fimmu.2017.00278.
- Tenzer S, Peters B, Bulik S, Schoor O, Lemmel C, Schatz MM, Kloetzel PM, Rammensee HG, Schild H, Holzhütter HG. Modeling the MHC class I pathway by combining predictions of proteasomal cleavage, TAP transport and MHC class I binding. Cell Mol Life Sci. 2005;62:1025–1037. doi:10.1007/s00018-005-4528-2.
- Peters B, Bulik S, Tampe R, Van Endert PM, Holzhutter HG. Identifying MHC class I epitopes by predicting the TAP transport efficiency of epitope precursors. J Immunol. 2003;171. 1741–1749.
- Henikoff S, Henikoff JG. Amino acid substitution matrices from protein blocks. Proc Natl Acad Sci U S A. 1992;89. 10915–10919.
- Bresciani A, Paul S, Schommer N, Dillon MB, Bancroft T, Greenbaum J, Sette A, Nielsen M, Peters B. T-cell recognition is shaped by epitope sequence conservation in the host proteome and microbiome. Immunology. 2016;148:34–39. doi:10.1111/imm.12585.
- Robin X, Turck N, Hainard A, Tiberti N, Lisacek F, Sanchez JC, Müller M. pROC: an open-source package for R and S+ to analyze and compare ROC curves. BMC Bioinformatics. 2011;12:77. doi:10.1186/1471-2105-12-77.