
ABSTRACT
Oral squamous cell carcinoma (OSCC) is a major cause of cancer-associated morbidity and mortality and may develop from oral premalignant lesions (OPL). An improved molecular classification of OPL may help refining prevention strategies. We identified two main OPL gene-expression subtypes, named immunological and classical, in 86 OPL (discovery dataset). A gene expression-based score was then developed to classify OPL samples from three independent datasets, including 17 (GSE30784),13 (GSE10174) and 15 (GSE85195) OPLs, into either one of the two gene-expression subtypes. Using the single sample gene set enrichment analysis, enrichment scores for immune-related pathways were different between the two OPL subtypes. In OPL from the discovery set, loss of heterozygosities (LOH) at 3p14, 17p13, TP53, 9p21 and 8p22 and miRNA gene expression profiles were analyzed. Deconvolution of the immune infiltrate was performed using the Microenvironment Cell Populations-counter tool. A multivariate analysis revealed that decreased miRNA-142-5p expression (P = 0.0484) and lower T-cell, monocytic and myeloid dendritic cells (MDC) immune infiltration (T-cells, P = 0.0196; CD8 T cells, P = 0.0129; MDC, P = 0.0481; and monocytes, P = 0.0212) were associated with oral cancer development in the immunological subtype only. In contrast, LOH at 3p14 (P = 0.0241), 17p13 (P = 0.0348) and TP53 (P = 0.004) were associated with oral cancer development in the classical subtype only. In conclusion, we identified 2 subtypes of OPLs, namely immune and classical, which may benefit from different and specific personalized prevention interventions.
Introduction
Head and neck squamous cell carcinoma (HNSCC) is ranked as the seventh most common cancer worldwide, with more than 600,000 cases diagnosed annually, and is a major cause of cancer-associated morbidity and mortality.Citation1 Patients with squamous cell carcinomas of the oral cavity (OSCC), the most common anatomical site of HNSCC, have the greatest risk of death,Citation2 which is commonly related to local-regional advanced disease.Citation3 Since OSCC may develop from oral premalignant lesions (OPL), prevention of malignant transformation of OPL to OSCC may substantially improve the clinical outcome of patients. Nonetheless, one of the greatest challenges in managing patients with oral OPL is determining risk for malignant transformation and the need for intervention, with a risk of OSCC between 0.13% and 34%Citation4 during periods of up to 30 years. The current histologic classification of oral epithelial dysplasia is subjective and unreliable, and surgical resection of OPL has not been shown to reduce OSCC development.Citation5
Some biomarkers of risk of malignant transformation, such as loss of heterozygosity (LOH),Citation6–Citation8 and epithelial growth factor receptor (EGFR) gene copy number gain,Citation9 have been identified and validated in OPL. Retrospective and prospective studies completed initially by our groupCitation6 and subsequently by othersCitation7,Citation8 demonstrate that LOH profiles (primarily at 3p14 and/or 9p21) in OPL are the most robust marker of cancer risk in this setting. Despite these efforts, randomized controlled trials (RCT) of chemopreventive agents have not yet resulted in the development of an intervention that can be considered as standard of care.Citation10–Citation14
The recent Erlotinib for Prevention of Oral Cancer (EPOC)Citation15 trial was the first RCT to use molecular selection (LOH) to treat patients suffering from high-risk OPL. The rationale for testing erlotinib for prevention of OSCC was partly based on the significant decrease of premalignant and neoplastic lesions induced by erlotinib treatment in the 4-nitroquinoline-1-oxide (4-NQO)-induced murine model of oral carcinogenesis.Citation16 Although EPOC paved the way for the beginning of an era of personalized-based prevention strategies,Citation17 it failed to reach the primary endpoint of oral cancer-free survival.Citation15
To provide insight into the molecular heterogeneity of HNSCC, four distinct gene expression-based molecular subtypes have been identified, reproduced and well-characterized in terms of their genomic alterations, canonical pathways and methylation profiles.Citation18–Citation21 Interestingly, some of these molecular subtypes present different drug sensitivity patternsCitation21 as well as different levels of radioresistance,Citation22 suggesting their potential relevance to define personalized-based therapy in head neck cancers.
Using a similar rationale, we hypothesized that the identification of OPL gene expression-based molecular subtypes may help design precision prevention strategies. Using a discovery set of 86 OPL samples, we identified two distinct gene expression subtypes of OPL, namely immunological and classical, that were validated in three independent datasets. Deconvolution scores of immune populations were computed in all datasets. Loss of heterozygosity at specific chromosomal loci as well as miRNA expression were measured in the discovery dataset and their association with oral cancer free-survival was tested.
Results
Discovery of two molecular subtypes of OPL: ‘immunological’ and ‘classical’
To identify gene expression based OPL subtypes, we used genome-wide expression profiles that we previously generated in a set of 86 oral leukoplakiasCitation23 (GSE26549). Using the 2,500 most variable genes, we performed an unsupervised and unbiased clustering of the 86 OPL from the discovery dataset, as previously described.Citation18 Two main clusters, including 42 (cluster 1) and 44 (cluster 2) OPLs, respectively, were identified based on the heatmap of the consensus matrix () and plots (Supplementary Figure 1) produced by the ConsensusClusterPlus R package, as well as on the heatmap of hierarchical clustering using ArrayStudio software (Supplementary Figure 2).
Figure 1. Identification of two gene expression-based subtypes, “classical” and “immunological”, in the discovery dataset of 86 OPL. To identify gene expression subtypes, we ran the ConsensusClusterPlus R packageCitation55 with the 2,500 most variable genes, which were selected using the median absolute deviation, as previously described Citation18. (A) Heatmap of the consensus matrix for k = 2 clusters, with samples in rows and columns, and consensus values ranging from 0 (never clustered together) to 1 (always clustered together) and marked by white to dark blue. (B) Enrichment scores of 1,329 canonical pathways in each OPL samples were computed and the 15 pathways most enriched in the immunological and the classical subtypes are shown. (C) The percentage of stromal inflammatory cells (SIC) as well as intraepithelial inflammatory cells (EIC) were compared between the two subtypes (Fisher’s exact test). Abbreviation: NS: not significant.
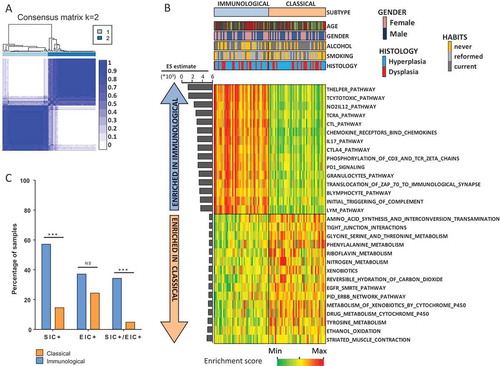
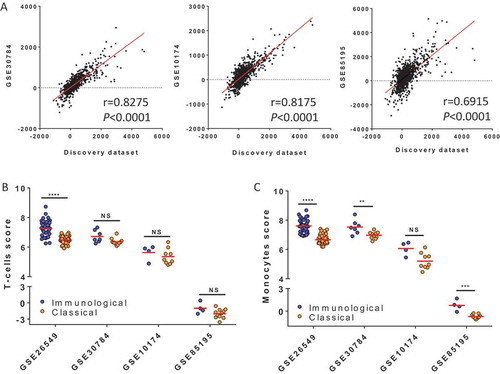
Figure 2. Validation of biological pathways and immune populations infiltrate characterizing the two subtypes. (A) In each dataset (discovery set and three validation sets: V1 = GSE30784, V2 = GSE10174 and V3 = GSE85195), the enrichment scores (ES) of 1,329 canonical pathways and the estimate was calculated for each pathway in the following manner: (Mean score Pathway in immunological score) – (Mean score Pathway in classical subtype). We tested the correlation of estimates calculated for each pathway in each validation set with the estimate of the corresponding pathways computed in the discovery set (Pearson’s correlation). (B) Using MCPcounter to deconvoluate the immune infiltrate, the score of T-cells (B) and monocytes (C) scores were computed and compared between the two subtypes in the discovery and validation sets (Wilcoxon test).
To gain some insight into the biological differences between these two clusters, the enrichment score (ES) of 1,329 canonical pathways was computed for each OPL sample, using the single sample Gene Set Enrichment Analysis (ssGSEA) tool.Citation24–Citation26 The ES was then compared between the two clusters using a Wilcoxon test. Since we observed a strong and significant enrichment of immune pathways, especially lymphocyte-related pathways, in cluster 1 compared to cluster 2 (; supplementary file 1), cluster 1 was named ‘immunological’. Conversely, cluster 2 was characterized by a moderate enrichment of pathways involved in xenobiotic metabolism as well as EGFR signaling and was therefore named ‘classical’ by analogy with the classical subtype of head neck cancers.Citation18,Citation21 Of note, EGFR gene expression was significantly higher in the classical subtype compared to the immunological subtype of OPL (P < 0.0001; Supplementary Figure 3).
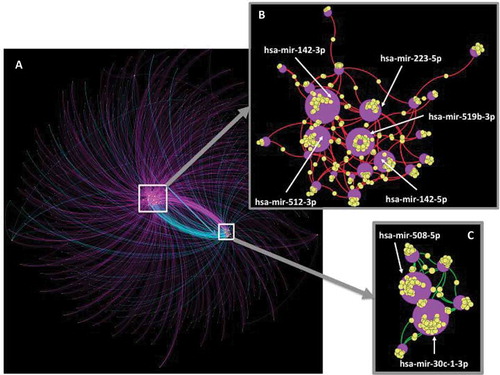
Figure 3. Integrative network of miRNAs and target genes differentially expressed between the two subtypes. In the discovery set, we identified a set of 31 miRNAs differentially expressed between the immunological and classical subtypes (Q-value< 0.05, |FC|> 2) and connected with 970 target genes (miRNet tool) which were also differentially expressed between the two subtypes (Q-value< 0.05). The Gephi software allowed visualizing the integrative network of these 31 miRNAs and their 970 target genes (A). Two central sub-networks were identified: (B) over-expressed miRNA connected to under-expressed targeted genes; (C) under-expressed miRNA connected to over-expressed targeted genes. In this network, miRNAs are shown as purple circles with increasing size according to the number of connections with its target gene (yellow circles). Connections between a miRNA and a target gene are shown as colored curved lines: purple lines = miRNA overexpressed – gene overexpressed; turquoise lines = miRNA underexpressed – gene underexpressed; red lines: miRNA overexpressed – gene underexpressed; green lines: miRNA underexpressed – gene overexpressed; yellow circles = genes; purple circles = miRNA. Nodes (miRNA and genes) were clustered using the ForceAtlas2 algorithm.
As the main biological difference between the two subtypes lied in the tumor microenvironment, we used the MCPcounter R packageCitation27 to deconvoluate the immune infiltrate and compute a score of the absolute abundance of eight immune and two stromal cell populations. When compared to the classical subtype, the immunological subtype had higher score of T-cells (P < 0.0001), cytotoxic lymphocytes (P < 0.0001), B lineage (P = 0.0025), monocytic lineage (P < 0.0001) and myeloid dendritic cells (P < 0.0001) (Supplementary Table S1). No significant differences were found when we evaluated the abundance of other cell populations such as neutrophils, endothelial cells and fibroblasts. Interestingly, the presence of intraepithelial inflammatory cells (EIC) and stromal inflammatory cells (SIC) as defined previouslyCitation28 was significantly higher in the immunological subtype compared to the classical subtype (P = 0.0014) (). No significant difference was observed with regard to clinical and pathological characteristics between the two subtypes ().
Table 1. Characteristics of the 86 patients from the OPL discovery dataset. Characteristics were compared between the immunological (N = 42) and the classical (N = 44) subtypes, using a fisher’s exact test. RP: retinyl palmitate; BC: beta-carotene; 13cRA: 13-cis retinoic acid.
Overall, we identified two biologically distinct gene expression subtypes of OPL that harbor major differences in terms of immune microenvironment, despite being clinically similar.
Classification of OPL samples using a 400-gene expression based score
To build and test a classifier of OPL samples, the discovery dataset of 86 OPL samples was randomly split into two subsets of 57 samples (training set) and 29 OPL samples (testing set) (see methods). In the training subset, we used a method of classification based on a gene-expression ES of genes which were differentially expressed between the two subtypes. The comparison of genome-wide expression profiles resulted in the identification of 200 most overexpressed genes (UP subset) and 200 most under-expressed genes (DOWN subset) in the immunological subtype compared to the classical subtype (Wilcoxon test with a Q-value< 0.05 and a |FC| > 1.5; supplementary file 2). Using ssGSEA, we computed an ES of the UP and DOWN subsets and a combined score equal to the ESUP – ESDOWN. Using this “ES-based classifier”, an OPL was classified as being immunological or classical if the score was > 0 or < 0, respectively.
In order to compare the ES-based classifier to alternative methods of classification, three well-established algorithms of classification based on centroid (partial least square, linear discriminant analysis and k-nearest neighbor) were also applied to the 57 OPL samples from the training set (see method) using 500 selected genes (F-test) and leave one-out cross validation. The best classifier in the training set was the Partial Least Square with K = 3 (i.e., PLS3 classifier) (Supplementary Figure 4). The ES-based classifier score and the PLS3 classifier were applied to the remaining 29 OPL samples from the testing set and the percentage of classification accuracy was compared between the two classifiers. The ES-based score had a higher accuracy (96.5%) compared to PLS3 (89.7%), misclassifying only 1 of the 29 OPLs from the testing subset.
Figure 4. OPL subtypes and biomarkers of oral cancer risk in the discovery set. In the 86 OPL discovery dataset, classical (A, C, E) and immunological (B, D, F) OPL were split into two groups according to loss of heterozygosity at D17S1176 (17p13) (A-B); the median score of monocytic lineage (C-D) (high i.e. > median), the median expression of miR-142-5p (E-F) (high i.e. > median). Oral-cancer free survival curves were compared between these groups, using a log-rank test.
Subsequently, we used the ES-based classifier in order to classify 17, 13 and 15 new OPL samples from two independent validation sets (V1,V2 and V3 respectively) which were downloaded from Gene Expression Omnibus (see method). The distribution of samples in each molecular subtype for all datasets is provided in Supplementary Fig. 5. The ES of 1,329 canonical pathways was computed and compared between the two subtypes in V1, V2 and V3 (Supplementary File 1). We computed the estimate ([Mean pathway in immunological subtype] – [mean pathway in classical subtype]) in V1,V2 and V3, and tested its correlation with the estimate calculated in the discovery dataset (). Coefficients of correlation were high (r > 0.6, P < 0.0001) for both V1, V2 and V3, emphasizing the consistency of the biological differences between the two molecular subtypes across multiple datasets.
Deconvolution of the immune infiltrate was also performed in V1 and V2 and the scores of the immune and stromal populations were compared between the two subtypes using a Wilcoxon test. The T-cell and monocyte scores were higher in the immunological subtype in the two validation datasets V1 (P = 0.0553 and P = 0.0068 respectively), V2 (P = 0.414 and P = 0.0503 respectively) and V3 (P = 0.1377 and P = 0.0015 respectively) (–) (Supplementary Table S1).
Overall, we defined and validated an accurate method of classification based on a gene-expression enrichment score (ES) of 400 genes that were differentially expressed between the two subtypes.
Integrated network of mRNAs and mrnas in OPL subtypes
The main difference between the two subtypes of OPL lied in the immune microenvironment. Because microRNA-mediated RNA interference has been described as an important regulatory mechanism of the immune response,Citation29 we analyzed miRNA expression profiles of 71/86 OPL samples from the discovery dataset (37 “classical” and 34 “immunological”). A total of 46 and 15 miRNAs were found to be overexpressed and underexpressed respectively in the immunological subtype compared to the classical subtype (Wilcoxon test, Q-value< 0.05, |FC|> 2) (Supplementary File 3). Of note, 14/46 miRNAs overexpressed in the immunological subtype, have been involved in the activation or differentiation of lymphocytes and/or monocytes.Citation30,Citation31 Using the miRNet tool, we identified 3,251 validated mRNAs targets of the 31/61 differentially expressed miRNAs (). Interestingly, 970/3,251 (30%) mRNAs targets were also found to be differentially expressed between the two classes of OPL (Wilcoxon test, Q-value< 0.05). An integrated network of these differentially expressed mRNAs and miRNAs was performed using the Gephi software (). Over-expressed miRNAs and their underexpressed target genes (), as well as the underexpressed miRNAs and their over-expressed target genes () in the immunological versus classical subtypes, were connected within two distinct networks. These networks highlighted 7 miRNAs connected with over 30 target genes. Two and five miRNAs were under-expressed (hsa-mir-30c-1-3p; mir-508-5p) and over-expressed (mir-142-3p; mir-512-3p; mir-519b-3p; mir-223-5p; mir-142-5p) in the immunological versus classical subtypes respectively (–).
In summary, the two gene expression-based subtypes of OPL were also characterized by distinct patterns of miRNAs, some of which known to be involved in the regulation of the immune response.
Molecular subtypes of OPL and oral cancer risk
We then tested whether the immunological and classical subtypes of OPL were clinically relevant using the discovery cohort in which samples were collected in the context of a clinical trial.Citation13 No difference was observed in OCFS between patients with immunological versus classical OPL (Supplementary Fig. 6).
We then looked at effect of LOH at specific chromosomal loci, a previously reported biomarker of risk of oral cancer development in patients with OPL.Citation6,Citation7,Citation15,Citation32 LOH at 3p14, 3p21, 17p13, TP53 and 8p22 were analyzed as previously described in 70/86 (81.4%) OPL samples from the discovery cohort.Citation6 The percentage of LOH at these sites was not significantly different between the two subtypes (P > 0.05, Fisher’s exact test) (). We tested the association of LOH at these sites with OCFS, using Kaplan Meier curves (Fig; 4A-B) as well as a univariate and multivariate cox proportional hazard model including age, treatment arm and histology (hyperplasia vs. dysplasia) (Supplementary File 4). No significant association was observed in the overall population of patients with OPL. However, LOH at D17S1176 (17p13) (P = 0.0348; Odds Ratio (OR) = 12.40; Confidence Interval 95% (CI95) = [1.197;128.497]), at TP53 (P = 0.004; Odds Ratio (OR) = 52.19;CI95 = [3.612;754]) and D3S1285 (3p14) (P = 0.0241; OR = 6.46; CI95 = [1.277;32.681]) were associated with worse OCFS in the classical but not in the immunological subtypes.
Table 2. Percentage of loss of heterozygosities (LOH) in the discovery dataset. LOH were evaluated in the discovery dataset (n = 70) at different chromosomal loci: D9s171 and D9S1747 (9p21), D3s1285 (3p14), D17s1176 (17p13), TP53 and D8s254 (8p22). Percentage of LOH was compared between immunological and classical OPL (Fisher’s exact test). “Missing data” actually include both non-informative cases and cases for which analysis could not be performed.
In addition, we evaluated the association of 8 immune (T-cells; CD8 T-cells; cytotoxic lymphocytes; NK cells; B lineage; monocytic lineage; myeloid dendritic cells; and neutrophils) and 2 stromal (endothelial cells and fibroblasts) cell populations based on their deconvolution scores with OCFS, using Kaplan-Meier curves ( ) and a multivariate cox proportional hazard model including age, treatment arm and histology (hyperplasia vs. dysplasia) (Supplementary File 4). While no significant association was observed between immune or stromal cell populations and OCFS in the overall population, increased scores of the monocytic lineage (P = 0.0212; OR = 0.22; CI95 = [0.06;0.80]) and myeloid dendritic cells (P = 0.0481; OR = 0.55; CI95 = [0.30;0.99]) were associated with improved OCFS in the immunological (n = 42) but not in the classical (n = 44) subtypes (–D and Supplementary File 4:). Similarly, increased scores of T-cells (P = 0.0196; OR = 0.3264; CI95 = [0.13;0.84]) and CD8 T-cells (P = 0.0129; OR = 0.06; CI95 = [0.007;0.552]) were associated with improved OCFS (Supplementary File 4).
Finally, we tested whether the 7 miRNAs identified in the integrative analyses were associated with the OCFS. Consistent with the association of the monocytic lineage with improved OCFS in the immunological subtype only, hsa-miR-142-5p monocyte-macrophage transducer was the only one significantly associated with a lower risk to develop OSCC in the immunological subtype only (P = 0.0484; OR = 0.68; CI95 = [0.46;0.997]), while no association was found in the classical subtype (Kaplan Meier curves: –; univariate and multivariate cox models: Supplementary File 4).
Discussion
Large-scale programs have provided important biological insights into HNSCC and allowed for the identification of four gene expression-based subtypesCitation18,Citation19 that have been associated with different patterns of drug sensitivityCitation21 and response to radiation therapy.Citation22 A pre-cancer atlas is the next step for elucidating the molecular heterogeneity at the early steps of head and neck tumorigenesis and help designing next generation prevention interventions.Citation33 Given that 0.13% to 34% of OPLs will transform into invasive SCCCitation4 over a period of up to 30 years, the generation of prospective collections of OPL samples has been challenging. Using previously established independent cohorts of OPL, we defined a gene expression-based classification of OPL into two subtypes, immunological and classical. The immunological subtype was characterized by overexpression of miR-142-5p as well as increased infiltration of monocytes and T-cells according to computed deconvolution of immune populations, all being associated with OCFS in this subtype only but not in the classical subtype.
Molecular classifications have been reported in different cancer types, using well-established classification algorithms, such as linear discriminant analysis, partial least square and k-nearest neighbor.Citation34,Citation35 In our study, we applied these algorithms to build a classifier of OPL that we compared to an alternative classification method based on a 400 gene expression score using the ssGSEA tool. Scores based on gene expression and computed in individual samples have previously been proposed for classification purposes in biological samples e.g. epithelial – vs. mesenchymal-like samples using a pancancer signature of epithelial-to-mesenchymal transition.Citation36 Unlike algorithm-based methods, they allow classifying new samples independently from previous ones, which is attractive in the clinical setting, especially in the context of the forthcoming clinical trials evaluating new prevention strategies. Our OPL classifier was built from a training subset of the discovery dataset, including a relative small number of samples. Moreover, the discovery dataset includes samples from patients who had been diagnosed with oral leukoplakia and who had been randomly assigned to intervention with different chemopreventive agents, that could also limit interpretation of our results. However, the association of biomarkers with oral cancer free survival was tested using multivariate analysis including the treatment arm. Moreover, biological differences between the two gene expression based subtypes were validated in three independent datasets, which greatly enhanced confidence in our results. Nevertheless, our ES-based classifier needs to be validated in larger cohorts.
We report two subtypes of OPL while 4 subtypes of HNSCC have been proposed, i.e. classical, basal, atypical and mesenchymal-like.Citation18,Citation19 More recently, the mesenchymal-like subtype has been questioned as it may be reflecting the contribution of non-malignant mesenchymal cell types of the tumor micro-environment.Citation37 Finally, a recent pancancer study from TCGA has reported 6 immune subtypes that encompass multiple cancer types.Citation38 The vast majority of HNSCC fits into the wound healing (more frequent in the classical subtype) or the IFN-gamma dominant subtypes that do not completely overlap with previously described subtypes. Whether the immunological subtype of OPL precedes transformation to the IFN-gamma subtype and the classical subtype of OPL precedes transformation to the wound healing and classical subtypes is a plausible hypothesis that remains to be demonstrated through the analysis of OPL and subsequent paired oral squamous cell carcinoma. Whether driver and passenger mutation patterns are different in these different subtypes of OPL remain to be studied. Moreover, we have recently shown that the main biological and actionable difference between oral SCC from never-smoker never-drinker and smoker drinker patients lies into the immune microenvironment. It was tempting to hypothesize that this difference would also be observed in premalignancy. However, we found no significant association between the smoking and drinking habits and immunological subtyping. The small size of our cohort may explain the lack of statistical significance of this association and larger cohorts are needed to confirm this result.
In our analyses, the immunological subtype was characterized by a strong enrichment in immune-related pathways, especially pathways related to lymphocytes and monocytes functions and a higher infiltration of monocytes and T-cells as compared to the classical subtype. This result was consistent with the overexpression of 14 miRNAs in the immunological subtype that have been involved in the activation or differentiation of lymphocytes and/or monocytes.Citation30,Citation31 In particular, miR-142-5p expression was higher in the immunological subtype compared to the classical subtype while its decreased expression was associated with a higher risk of oral cancer development in the immunological subtype only. A study of microRNA profiles during progression of oral leukoplakia to cancer has shown the complex deregulation of miR-142-5p expression during oral carcinogenesis. It was found to be upregulated in cancer versus normal mucosa, while its expression changes in hyperplasia, dysplasia and cancer was not consistent across all patients, suggesting that its dysregulation could be different depending on the molecular subtype of OPL.Citation39 In other contexts, miR142-5p has been reported to play a role into macrophages differentiationCitation40 and to be down-regulated in glioblastoma-infiltrating macrophages.Citation41 Overall, the interaction between the immune system and neoplasia reflects a fundamental principle, applicable to all organ/cell types.Citation42 The recent success of the use of PD-1 immune checkpoint blockade in advanced HNSCCCitation43–Citation45 confirms the clinical importance of immune modulation in this context. Overall, tumors orchestrate a complex signaling network to induce immune tolerance.Citation46 These events can occur as early as in the OPL, as demonstrated in preclinicalCitation47 and early clinical studiesCitation48 that illustrate the dynamic and complex of the premalignant immune microenvironment.
The classical subtype of OPL was characterized by an overexpression of Epidermal Growth Factor Receptor (EGFR) as well as a significant enrichment by EGFR signaling pathway. Inhibition of the EGFR pathway has been proposed for oral cancer prevention, based on the significant decrease of premalignant and neoplastic lesions induced by EGFR inhibitors in the 4-nitroquinoline-1-oxide (4-NQO)-induced murine model of oral carcinogenesis. However, the recent Erlotinib for Prevention of Oral Cancer (EPOC) trial failed to reach its primary endpoint (oral cancer-free survival). In light of our results, it is tempting to hypothesize that the benefit of EGFR targeting agents could be higher in patients suffering from classical lesions, and therefore, that the proposed molecular classification may potentially help for refining oral cancer prevention strategies.
In our study, LOH status was not significantly different between the classical or the immunological OPL subtypes. Interestingly, although LOH results are limited by the number of primers used for each region, LOH at 3p14, TP53 and 17p13 were significantly associated with a higher risk of oral cancer development in the classical subtype but not in the immunological subtype. In contrast to LOH, down-regulation of miRNA-142-5p and decreased infiltration of monocytes, myeloid dendritic cells and T-cells according to computed deconvolution of immune populations, were associated with poor OCFS in the immunological subtype but not in the classical subtype. Our results suggest that beyond LOH, our gene expression-based classification of OPL may provide an opportunity to refine the molecular assessment of oral cancer risk. Consistent with previous observations in HNSCC,Citation49–Citation51 we found that premalignant-infiltrating T-cells and monocytes are associated with a lower oral cancer risk, suggesting an important role of these populations during oral carcinogenesis. Scattered evidence on the biology of OPL suggests the presence of an immune stimulatory environment characterized by IFN-gamma, and other pro-inflammatory cytokines and immune cells, including NK cells, macrophages and activated CD8 + T-cells. The 4-NQO mouse model of oral carcinogenesis, which mimics the effects of tobacco and induces molecular, genetic and tumor antigen changes similar to those of human OPL and oral SCC,Citation52 provides an opportunity to study the mechanisms governing the evolution of pre-malignant clones and early immune interception of this oncogenic process. Recent reports on the 4-NQO model found that OPL cells themselves elicit increased cytokine production (e.g., IFN-gamma), immune cell (e.g., activated T-cell) activation,Citation53 and therefore serve as a basis to define a mechanism by which OPLs modulate the immune response. Importantly, these studies suggest that immune intervention may be effective in patients with OPL as they are in a significant proportion of patients with oral cancer. Recent reports showing that metformin exerts immune-mediated anti-tumor effects,Citation54 in addition to preventing tumorigenesis and malignant conversion of OPL to oral cancer in the 4-NQO model, we have launched an immune interception trial assessing the activity of Metformin For Oral Cancer Prevention (M4OC-Prevent) (www.clinicaltrials.gov, NCT02581137).
In conclusion, we report a gene expression-based classification of OPL, into immunological and classical subtypes, that may be applicable in the clinical setting for refining prevention strategies. Large prospective cohorts of OPL are needed to validate our results. Further characterization of the immune infiltrate is required, which may pave the road to immune intervention strategies.
Methods
Four independent sets of OPL samples
Four independent sets of OPL samples with available gene expression profiles were established, using data generated in OPL biopsies collected prospectively in a chemoprevention trial run at The University of Texas MD Anderson Cancer Center (MDACC) (discovery set), as well as data downloaded from the public data repository Gene Expression Omnibus (GEO) (validation sets V1, V2 and V3). Written informed consent was obtained for all patients included in the trials at MDACC.
The discovery set included 86 OPL biopsies collected in patients followed prospectively with a median follow-up of 7 years (95% CI [5.6–8.6]) in a chemoprevention trial with available gene expression profiles previously published in GEO (GSE26549).Citation13,Citation23 Patients had been diagnosed with OPL and randomly assigned to intervention with 13-cisretinoic acid (13cRA) versus retinyl palmitate (RP) with or without b-carotene (BC). Of note, loss of heterozygosity status at 9p21 (D9S171, D9S1747), 3p14 (D3S1285), 17p13 (D17S1176), TP53, 8p22 (D8S254) was available for 70/86 OPLs. Moreover, miRNA gene expression profiling was generated in 71/86 OPLs (see below the subsection “miRNA profiling of OPL”). Finally, based on the examination of OPL biopsies under a multi-headed microscope by three observers, each OPL was defined by the presence or absence of inflammatory cells in the stroma (SIC) and intra-epithelial inflammatory cells (EIC).Citation28
In order to validate our gene expression based classification, three independent gene expression validation datasets V1, V2 and V3 were downloaded from Gene Expression omnibus and included 17 oral dysplastic lesions (GSE30784),13 OPL with hyperplasia or dysplasia (GSE10174) and 15 OPL (GSE85195) respectively.
A detailed description of the different datasets is provided in Supplementary Table S2.
MicroRNA profiling of OPL in the discovery set
All steps leading to the generation of raw data using the samples from the discovery set were processed at the University of Texas M.D. Anderson Cancer Center (MDACC) Genomics Core Facility. We produced miRNA profiles in 71/86 OPL (discovery set) using available aliquots previously prepared for mRNA gene expression profiling.Citation23 Each sample was hybridized on TaqMan® low density arrays Cards A and B, using the manufacturer’s instructions (Applied Biosystems, Foster City, CA). All TLDA cards were run on the Applied Biosystems 7900HT real-time PCR platform (Applied Biosystems, Foster City, CA).
Loss of heterozygosity analysis
In 70/86 OPL, loss of heterozygosities (LOH) at 9p21 (D9s171, D9S1747), 3p14 (D3s1285), 17p13 (D17s1176), TP53 and 8p22 (D8s254) were evaluated as previously reported.Citation6
Unsupervised discovery of OPL gene expression subtypes
Using gene expression data of the 86 OPL samples from the discovery set (GSE26549),Citation23 identification of the distinct molecular subtypes of OPL was performed as previously described.Citation18,Citation34 Gene expression values were gene median centered and the 2,500 most variable genes, using the median absolute deviation, were selected for clustering. We then used the ConsensusClusterPlus R package to cluster the OPL samples in an unbiased and unsupervised manner.Citation55 This procedure was performed with 1,000 randomly selected sets of microarray samples using a sampling proportion of 80% and a distance metric equal to one minus the Pearson correlation coefficient.
Classification methods of OPL subtypes
The discovery dataset of 86 OPL samples was randomly split into a training and a testing subsets of 57 and 29 OPL samples respectively using the “sample” function in the R language. Using the ArrayStudio© software (OmicSoft©, Cary, NC), different classification algorithms (partial least square, linear discriminant analysis, and K-nearest neighbor) were applied to the training subset to build a classifier, including the 500 most significant genes based on F-test. According to an external cross validation, the best gene classifier was selected and applied to the testing subset. In addition, based on differential gene expression between OPL subtypes, we computed a gene expression score for the OPL classification, using the single sample gene set enrichment analysis (ssGSEA)Citation24,Citation25 from Gene Pattern.Citation26 We compared these methods of classification in terms of the accuracy percentage (= [number of samples misclassified/number of samples well-classified]*100).
Pathway analysis
To characterize the OPL subtypes, we performed an enrichment pathway analysis based on large-scale gene expression data in the four OPL datasets. Pathway-specific pathways were downloaded from the Molecular Signature Database (MSigDB database Molecular Signatures Database v5.2, 2016) and included a total of 1,329 canonical pathways. The ssGSEA was used to compute an enrichment score for each pathway in each sampleCitation24,Citation25 which was run from GenePattern.Citation26 Unlike GSEA which analyzes differential pathways between two phenotypical groups, the ssGSEA tool allows for computing an enrichment score (ES) of a given gene set in each sample. The gene expression values for a given sample are rank-normalized, and an ES is produced using the empirical cumulative distribution functions of the genes in the gene set and the remaining genes.Citation24,Citation25 When UP and DN versions of a gene set are available, a combined score was computed. Default parameters were used (weighting component of 0.75 and minimal gene set size of 10 genes).
Deconvolution of the immune infiltrate in OPL
The Microenvironment Cell Populations-counter (MCP-counter) R packageCitation27 was used for deconvolution of the immune infiltrate in each OPL sample. This method allows computing a score of the absolute abundance of eight immune cell types (T-cells; CD8 T-cells; Cytotoxic lymphocytes; NK cells; B lineage; Monocytic lineage; Myeloid dendritic cells; and Neutrophils) as well as of two stromal cell populations (endothelial cells and fibroblasts) in heterogeneous tissues from transcriptomic data. This score was defined as the log2 average expression of specific well-defined transcriptomic markers for each population.
Bioinformatics and statistics
Bioinformatics and statistics were performed using the Array Studio software (Omicsoft Corporation) as well as Bioconductor packages in the R languageCitation56 and GraphPad Prism version 6.00 (San Diego, SA). Raw data from microarrays were processed using quantile normalization and the robust multi-array average (RMA) algorithm and were log2 transformed.Citation57 Custom CDF were used and downloaded from brainarray website.Citation58 miRNA raw data was log2 transformed for normalization. An integrative network including miRNA and differentially expressed genes between subtypes was built and visualized using miRNetCitation59 and the Gephi software,Citation60 respectively. The algorithm layout used in the Gephi software was ForceAtlas2. Hierarchical clustering analysis was done using the Pearson correlation and ward linkage method.
Unpaired Mann-Whitney or Wilcoxon tests were performed to compare the continuous values between the subtypes. Fisher’s exact test allowed us to analyze the contingency tables. In the 86 samples from the discovery set (GSE26549), oral cancer-free survival (OCFS) distributions were estimated using the Kaplan-Meier method and compared with the log- rank test. The OCFS was defined as the time from the first biopsy to oral cancer or to the date of last follow-up (for censored patients). The univariate and multivariate Cox proportional hazard model, including age, treatment arm (13cRA, RP with or without b-carotene BC) and histology (hyperplasia vs. dysplasia), were built to investigate the potential association between some biomarkers and OCFS in each molecular subtype. All statistical tests were two-sided, and P–values of 0.05 or less were considered to be statistically significant.
Supplemental Material
Download Zip (2.3 MB)Supplementary material
Supplemental data for this article can be accessed here.
Disclosure statement
No potential conflict of interest was reported by the authors.
Additional information
Funding
Related Research Data
References
- Ferlay J, Soerjomataram I, Dikshit R, Eser S, Mathers C, Rebelo M, Parkin DM, Forman D, Bray F. Cancer incidence and mortality worldwide: sources, methods and major patterns in GLOBOCAN 2012. Int J Cancer. 2015; 136:E359–86. doi:10.1002/ijc.29210.
- Divi V, Chen MM, Nussenbaum B, Rhoads KF, Sirjani DB, Holsinger FC, Shah JL, Hara W. Lymph node count from neck dissection predicts mortality in head and neck cancer. J Clin Oncol. 2016. doi:10.1200/JCO.2016.67.3863.
- Bernier J, Domenge C, Ozsahin M, Matuszewska K, Lefebvre JL, Greiner RH, Giralt J, Maingon P, Rolland F, Bolla M, et al. Postoperative irradiation with or without concomitant chemotherapy for locally advanced head and neck cancer. N Engl J Med. 2004; 350:1945–1952. doi:10.1056/NEJMoa032641.
- Warnakulasuriya S, Ariyawardana A. Malignant transformation of oral leukoplakia: a systematic review of observational studies. J Oral Pathol Med. 2016; 45: 155–166. doi:10.1111/jop.12339.
- Balasundaram I, Payne KF, Al-Hadad I, Alibhai M, Thomas S, Bhandari R. Is there any benefit in surgery for potentially malignant disorders of the oral cavity? J Oral Pathol Med. 2014; 43: 239–244. doi:10.1111/jop.12088.
- Mao L, Lee JS, Fan YH, Ro JY, Batsakis JG, Lippman S. Hittelman W, Hong WK. Frequent microsatellite alterations at chromosomes 9p21 and 3p14 in oral premalignant lesions and their value in cancer risk assessment. Nat Med. 1996;2:682–685.
- Rosin MP, Cheng X, Poh C, Lam WL, Huang Y, Lovas J, Berean K, Epstein JB, Priddy R, Le ND, et al. Use of allelic loss to predict malignant risk for low-grade oral epithelial dysplasia. Clin Cancer Res. 2000;6:357–362.
- Zhang L, Poh CF, Williams M, Laronde DM, Berean K, Gardner PJ, Jiang H, Wu L, Lee JJ, Rosin MP. Loss of heterozygosity (LOH) profiles–validated risk predictors for progression to oral cancer. Cancer Prev Res (Phila). 2012; 5:1081–1089. doi:10.1158/1940-6207.CAPR-12-0173.
- Taoudi Benchekroun M, Saintigny P, Thomas SM, El-Naggar AK, Papadimitrakopoulou V, Ren H, Wenhua Lang, You-Hong Fan, Jiannan Huang, Lei Feng, et al. Epidermal growth factor receptor expression and gene copy number in the risk of oral cancer. Cancer Prev Res (Phila). 2010; 3:800–809. doi:10.1158/1940-6207.CAPR-09-0163.
- Leeman-Neill RJ, Seethala RR, Singh SV, Freilino ML, Bednash JS, Thomas SM, Panahandeh MC, Gooding WE, Joyce SC, Lingen MW, et al. Inhibition of EGFR-STAT3 signaling with erlotinib prevents carcinogenesis in a chemically-induced mouse model of oral squamous cell carcinoma. Cancer Prev Res (Phila). 2011; 4:230–237. doi:10.1158/1940-6207.CAPR-10-0249.
- Bauman JE, Grandis J. Oral Cancer Chemoprevention–the End of EPOC, the beginning of an epoch of molecular selection. JAMA Oncol. 2016; 2: 178–179. doi:10.1001/jamaoncol.2015.4637.
- Papadimitrakopoulou VA, William WN, Jr., Dannenberg AJ, Lippman SM, Lee JJ, Ondrey FG, Peterson DE, Feng L, Atwell A, El-Naggar AK, et al. Pilot randomized phase II study of celecoxib in oral premalignant lesions. Clin Cancer Res. 2008; 14:2095–2101. doi:10.1158/1078-0432.CCR-07-4024.
- Papadimitrakopoulou VA, Lee JJ, William WN, Jr., Martin JW, Thomas M, Kim ES, Khuri FR, Shin DM, Feng L, Hong WK, et al. Randomized trial of 13-cis retinoic acid compared with retinyl palmitate with or without beta-carotene in oral premalignancy. J Clin Oncol. 2009; 27:599–604. doi:10.1200/JCO.2008.17.1850.
- Lippman SM, Batsakis JG, Toth BB, Weber RS, Lee JJ, Martin JW, Hays GL, Goepfert H, Hong WK. Comparison of low-dose isotretinoin with beta carotene to prevent oral carcinogenesis. N Engl J Med. 1993; 328:15–20. doi:10.1056/NEJM199301073280103.
- William WN, Jr., Papadimitrakopoulou V, Lee JJ, Mao L, Cohen EE, Lin HY, Gillenwater AM, Martin JW, Lingen MW, Boyle JO, et al. Erlotinib and the risk of oral cancer: the erlotinib prevention of oral cancer (EPOC) randomized clinical trial. JAMA Oncol. 2016; 2:209–216. doi:10.1001/jamaoncol.2015.4364.
- Hong WK, Endicott J, Itri LM, Doos W, Batsakis JG, Bell R, Fofonoff S, Byers R, Atkinson EN, Vaughan C, et al. 13-cis-retinoic acid in the treatment of oral leukoplakia. N Engl J Med. 1986; 315:1501–1505. doi:10.1056/NEJM198612113152401.
- Armstrong WB, Taylor TH, Kennedy AR, Melrose RJ, Messadi DV, Gu M, Le AD, Perloff M, Civantos F, Goodwin WJ, et al. Bowman birk inhibitor concentrate and oral leukoplakia: a randomized phase IIb trial. Cancer Prev Res (Phila). 2013; 6:410–418. doi:10.1158/1940-6207.CAPR-13-0004.
- Walter V, Yin X, Wilkerson MD, Cabanski CR, Zhao N, Du Y, Ang MK, Hayward MC, Salazar AH, Hoadley KA, et al. Molecular subtypes in head and neck cancer exhibit distinct patterns of chromosomal gain and loss of canonical cancer genes. PLoS One. 2013; 8:e56823. doi:10.1371/journal.pone.0056823.
- Cancer Genome Atlas N. Comprehensive genomic characterization of head and neck squamous cell carcinomas. Nature. 2015; 517: 576–582. doi:10.1038/nature14129.
- Keck MK, Zuo Z, Khattri A, Stricker TP, Brown CD, Imanguli M. Rieke D, Endhardt K, Fang P, Brägelmann J, et al. Integrative analysis of head and neck cancer identifies two biologically distinct HPV and three non-HPV subtypes. Clin Cancer Res. 2015; 21:870–881. doi:10.1158/1078-0432.CCR-14-2481.
- De Cecco L, Nicolau M, Giannoccaro M, Daidone MG, Bossi P, Locati L, Licitra L, Canevari S. Head and neck cancer subtypes with biological and clinical relevance: meta-analysis of gene-expression data. Oncotarget. 2015; 6:9627–9642. doi:10.18632/oncotarget.3301.
- Foy JP, Bazire L, Ortiz-Cuaran S, Deneuve S, Kielbassa J, Thomas E, Viari A, Puisieux A, Goudot P, Bertolus C, et al. A 13-gene expression-based radioresistance score highlights the heterogeneity in the response to radiation therapy across HPV-negative HNSCC molecular subtypes. BMC Med. 2017; 15:165. doi:10.1186/s12916-017-0929-y.
- Saintigny P, Zhang L, Fan YH, El-Naggar AK, Papadimitrakopoulou VA, Feng L, Lee JJ, Kim ES, Ki Hong W, Mao L. Gene expression profiling predicts the development of oral cancer. Cancer Prev Res (Phila). 2011; 4:218–229. doi:10.1158/1940-6207.CAPR-10-0155.
- Subramanian A, Tamayo P, Mootha VK, Mukherjee S, Ebert BL, Gillette MA, Paulovich A, Pomeroy SL, Golub TR, Lander ES, et al. Gene set enrichment analysis: a knowledge-based approach for interpreting genome-wide expression profiles. Proc Natl Acad Sci U S A. 2005; 102:15545–15550. doi:10.1073/pnas.0506580102.
- Barbie DA, Tamayo P, Boehm JS, Kim SY, Moody SE, Dunn IF, Schinzel AC, Sandy P, Meylan E, Scholl C, Systematic RNA interference reveals that oncogenic KRAS-driven cancers require TBK1. Nature. 2009; 462:108–112. doi:10.1038/nature08460.
- Reich M, Liefeld T, Gould J, Lerner J, Tamayo P, Mesirov JP. GenePattern 2.0. Nat Genet. 2006; 38: 500–501. doi:10.1038/ng0506-500.
- Becht E, Giraldo NA, Lacroix L, Buttard B, Elarouci N, Petitprez F, Selves J, Laurent-Puig P, Sautès-Fridman C, Fridman WH, et al. Estimating the population abundance of tissue-infiltrating immune and stromal cell populations using gene expression. Genome Biol. 2016; 17:218. doi:10.1186/s13059-016-1070-5.
- Saintigny P, El-Naggar AK, Papadimitrakopoulou V, Ren H, Fan YH, Feng L, Lee JJ, Kim ES, Hong WK, Lippman SM. DeltaNp63 overexpression, alone and in combination with other biomarkers, predicts the development of oral cancer in patients with leukoplakia. Clin Cancer Res. 2009; 15:6284–6291. doi:10.1158/1078-0432.CCR-09-0498.
- Tsitsiou E, Lindsay MA. microRNAs and the immune response. Curr Opin Pharmacol. 2009; 9: 514–520. doi:10.1016/j.coph.2009.05.003.
- El Gazzar M, McCall CE. MicroRNAs regulatory networks in myeloid lineage development and differentiation: regulators of the regulators. Immunol Cell Biol. 2012; 90: 587–593. doi:10.1038/icb.2011.74.
- Podshivalova K, Salomon DR. MicroRNA regulation of T-lymphocyte immunity: modulation of molecular networks responsible for T-cell activation, differentiation, and development. Crit Rev Immunol. 2013;33:435–476.
- Rosin MP, Lam WL, Poh C, Le ND, Li RJ, Zeng T, Priddy R, Zhang L. 3p14 and 9p21 loss is a simple tool for predicting second oral malignancy at previously treated oral cancer sites. Cancer Res. 2002;62:6447–6450.
- Spira A, Yurgelun MB, Alexandrov L, Rao A, Bejar R, Polyak K, Giannakis M, Shilatifard A, Finn OJ, Dhodapkar M, et al. Precancer atlas to drive precision prevention trials. Cancer Res. 2017; 77:1510–1541. doi:10.1158/0008-5472.CAN-16-2346.
- Wilkerson MD, Yin X, Hoadley KA, Liu Y, Hayward MC, Cabanski CRMuldrew K, Miller CR, Randell SH, Socinski MA, et al. Lung squamous cell carcinoma mRNA expression subtypes are reproducible, clinically important, and correspond to normal cell types. Clin Cancer Res. 2010; 16:4864–4875. doi:10.1158/1078-0432.CCR-10-0199.
- Kadara H, Behrens C, Yuan P, Solis L, Liu D, Gu X, Minna JD, Lee JJ, Kim E, Hong WK, et al. A five-gene and corresponding protein signature for stage-I lung adenocarcinoma prognosis. Clin Cancer Res. 2011; 17:1490–1501. doi:10.1158/1078-0432.CCR-10-2703.
- Mak MP, Tong P, Diao L, Cardnell RJ, Gibbons DL, William WN, Skoulidis F, Parra ER, Rodriguez-Canales J, Wistuba II, et al. A patient-derived, pan-cancer emt signature identifies global molecular alterations and immune target enrichment following epithelial-to-mesenchymal transition. Clin Cancer Res. 2016; 22:609–620. doi:10.1158/1078-0432.CCR-15-0876.
- Puram SV, Tirosh I, Parikh AS, Patel AP, Yizhak K, Gillespie S, Rodman C, Luo CL, Mroz EA, Emerick KS, et al. Single-cell transcriptomic analysis of primary and metastatic tumor ecosystems in head and neck cancer. Cell. 2017; 171:1611–24 e24. doi:10.1016/j.cell.2017.10.044.
- Thorsson V, Gibbs DL, Brown SD, Wolf D, Bortone DS, Ou Yang TH, Porta-Pardo E, Gao GF, Plaisier CL, Eddy JA, et al. The immune landscape of cancer. Immunity. 2018; 48:812–30 e14. doi:10.1016/j.immuni.2018.03.023.
- Cervigne NK, Reis PP, Machado J, Sadikovic B, Bradley G, Galloni NN, Pintilie M, Jurisica I, Perez-Ordonez B, Gilbert R, et al. Identification of a microRNA signature associated with progression of leukoplakia to oral carcinoma. Hum Mol Genet. 2009; 18:4818–4829. doi:10.1093/hmg/ddp446.
- Su S, Zhao Q, He C, Huang D, Liu J, Chen F, Chen J, Liao JY, Cui X, Zeng Y, et al. miR-142-5p and miR-130a-3p are regulated by IL-4 and IL-13 and control profibrogenic macrophage program. Nat Commun. 2015; 6:8523. doi:10.1038/ncomms9523.
- Xu S, Wei J, Wang F, Kong Ly, Ling Xy, Nduom E, Gabrusiewicz K, Doucette T, Yang Y, Yaghi NK, et al. Effect of miR-142-3p on the M2 macrophage and therapeutic efficacy against murine glioblastoma. J Natl Cancer Inst. 2014:106(8). pii: dju162. doi:10.1093/jnci/dju162.
- Spira A, Disis ML, Schiller JT, Vilar E, Rebbeck TR, Bejar R, Ideker T, Arts J, Yurgelun MB, Mesirov JP, et al. Leveraging premalignant biology for immune-based cancer prevention. Proc Natl Acad Sci U S A. 2016; 113:10750–10758. doi:10.1073/pnas.1608077113.
- Ferris RL, Blumenschein G, Jr., Fayette J, Guigay J, Colevas AD, Licitra LHarrington K, Kasper S, Vokes EE, Even C, et al. Nivolumab for recurrent squamous-cell carcinoma of the head and neck. N Engl J Med. 2016. doi:10.1056/NEJMoa1602252.
- Chow LQ, Haddad R, Gupta S, Mahipal A, Mehra R, Tahara M, Berger R, Eder JP, Burtness B, Lee SH, et al. Antitumor activity of pembrolizumab in biomarker-unselected patients with recurrent and/or metastatic head and neck squamous cell carcinoma: results from the phase Ib KEYNOTE-012 expansion cohort. J Clin Oncol. 2016. doi:10.1200/JCO.2016.68.1478.
- Seiwert TY, Burtness B, Mehra R, Weiss J, Berger R, Eder JP, Heath K, McClanahan T, Lunceford J, Gause C, et al. Safety and clinical activity of pembrolizumab for treatment of recurrent or metastatic squamous cell carcinoma of the head and neck (KEYNOTE-012): an open-label, multicentre, phase 1b trial. Lancet Oncol. 2016. doi:10.1016/S1470-2045(16)30066-3.
- Concha-Benavente F, Ferris RL. Oncogenic growth factor signaling mediating tumor escape from cellular immunity. Curr Opin Immunol. 2017; 45: 52–59. doi:10.1016/j.coi.2017.01.004.
- Woodford D, Johnson SD, De Costa AM, Young MR. An inflammatory cytokine milieu is prominent in premalignant oral lesions, but subsides when lesions progress to squamous cell carcinoma. J Clin Cell Immunol. 2014;5(3). pii: 230.
- Yagyuu T, Hatakeyama K, Imada M, Kurihara M, Matsusue Y, Yamamoto K, Obayashi C, Kirita T. Programmed death ligand 1 (PD-L1) expression and tumor microenvironment: implications for patients with oral precancerous lesions. Oral Oncol. 2017; 68:36–43. doi:10.1016/j.oraloncology.2017.03.006.
- Badoual C, Hans S, Rodriguez J, Peyrard S, Klein C, Agueznay Nel H, Mosseri V, Laccourreye O, Bruneval P, Fridman WH, et al. Prognostic value of tumor-infiltrating CD4+ T-cell subpopulations in head and neck cancers. Clin Cancer Res. 2006; 12:465–472. doi:10.1158/1078-0432.CCR-05-1886.
- Nguyen N, Bellile E, Thomas D, McHugh J, Rozek L, Virani S, Peterson L, Carey TE, Walline H, Moyer J, et al. Tumor infiltrating lymphocytes and survival in patients with head and neck squamous cell carcinoma. Head Neck. 2016; 38:1074–1084. doi:10.1002/hed.24406.
- Balermpas P, Michel Y, Wagenblast J, Seitz O, Weiss C, Rodel F, Rödel C, Fokas E. Tumour-infiltrating lymphocytes predict response to definitive chemoradiotherapy in head and neck cancer. Br J Cancer. 2014; 110:501–509. doi:10.1038/bjc.2013.640.
- Foy JP, Tortereau A, Caulin C, Le Texier V, Lavergne E, Thomas E, Chabaud S, Perol D, Lachuer J, Lang W, et al. The dynamics of gene expression changes in a mouse model of oral tumorigenesis may help refine prevention and treatment strategies in patients with oral cancer. Oncotarget. 2016. doi:10.18632/oncotarget.8321.
- Johnson SD, Levingston C, Young MR. Premalignant oral lesion cells elicit increased cytokine production and activation of T-cells. Anticancer Res. 2016;36:3261–3270.
- Eikawa S, Nishida M, Mizukami S, Yamazaki C, Nakayama E, Udono H. Immune-mediated antitumor effect by type 2 diabetes drug, metformin. Proc Natl Acad Sci U S A. 2015; 112: 1809–1814. doi:10.1073/pnas.1417636112.
- Wilkerson MD, Hayes DN. ConsensusClusterPlus: a class discovery tool with confidence assessments and item tracking. Bioinformatics. 2010; 26: 1572–1573. doi:10.1093/bioinformatics/btq170.
- Huber W, Carey VJ, Gentleman R, Anders S, Carlson M, Carvalho BS, Bravo HC, Davis S, Gatto L, Girke T, et al. Orchestrating high-throughput genomic analysis with Bioconductor. Nat Methods. 2015; 12:115–121. doi:10.1038/nmeth.3252.
- Irizarry RA, Hobbs B, Collin F, Beazer-Barclay YD, Antonellis KJ, Scherf U, Speed TP. Exploration, normalization, and summaries of high density oligonucleotide array probe level data. Biostatistics. 2003; 4:249–264. doi:10.1093/biostatistics/4.2.249.
- Dai M, Wang P, Boyd AD, Kostov G, Athey B, Jones EG, Bunney WE, Myers RM, Speed TP, Akil H, et al. Evolving gene/transcript definitions significantly alter the interpretation of GeneChip data. Nucleic Acids Res. 2005; 33:e175. doi:10.1093/nar/gni179.
- Fan Y, Siklenka K, Arora SK, Ribeiro P, Kimmins S, Xia J. miRNet - dissecting miRNA-target interactions and functional associations through network-based visual analysis. Nucleic Acids Res. 2016; 44: W135–41. doi:10.1093/nar/gkw288.
- Jacomy M, Venturini T, Heymann S, Bastian M. ForceAtlas2, a continuous graph layout algorithm for handy network visualization designed for the Gephi software. PLoS One. 2014 Jun 10;9(6):e98679. doi:10.1371/journal.pone.0098679. eCollection 2014. PMID: 24914678