
ABSTRACT
Synovial sarcoma expresses multiple cancer testis antigens that could potentially be targeted by T-cell receptor (TCR) gene therapy. In this study we investigated whether PRAME-TCR-gene therapy could be an effective treatment for synovial sarcoma by investigating the potential of PRAME-specific T-cells to recognize sarcoma cells and by evaluating the expression patterns of PRAME and HLA class I (HLA-I) in synovial sarcoma tumor samples. All PRAME expressing sarcoma cell lines, including 2 primary synovial sarcoma cell cultures (passage < 3), were efficiently recognized by PRAME-specific T-cells. mRNA FISH demonstrated that PRAME was expressed in all synovial sarcoma samples, mostly in an homogeneous pattern. Immunohistochemistry demonstrated low HLA-I baseline expression in synovial sarcoma, but its expression was elevated in specific areas of the tumors, especially in biphasic components of biphasic synovial sarcoma. In 5/11 biphasic synovial sarcoma patients and in 1/17 monophasic synovial sarcoma patients, elevated HLA-I on tumor cells was correlated with infiltration of T-cells in these specific areas. In conclusion, low-baseline expression of HLA-I in synovial sarcoma is elevated in biphasic areas and in areas with densely infiltrating T-cells, which, in combination with homogeneous and high PRAME expression, makes synovial sarcoma potentially a suitable candidate for PRAME-specific TCR-gene therapy.
Introduction
Synovial sarcoma (SS) is an aggressive soft tissue sarcoma (STS) that is characterized by a (X;18) translocation resulting in an SS18/SSX1 or SS18/SSX2 fusion protein (or very rarely SS18/SSX4).Citation1 Different histological subtypes have been described of which monophasic and biphasic SS are most common. Biphasic SS consists of both spindle cell components and epithelial components. The epithelial cells have abundant cytoplasm and ovoid nuclei and the can form glands and papillary structures while the spindle cell compartment consists of small, uniform cells with spars cytoplasm. In monophasic SS, only the spindle cell compartment is present.Citation1 SS constitutes for approximately 6% of all STS patients and has a 5 year survival rate in adults ranging between 52% and 65% depending on the histological subtype. Survival did not substantially improve over the last three decades.Citation2,Citation3 Patients with localized disease have a 10-year survival rate of 69% that drops to below 10% in patients with metastatic disease,Citation4 illustrating the need for better treatment options for patients with advanced stages of SS. Multiple trials are running using inhibiting molecules to target metabolic pathways in SS and other trials target SS with monoclonal antibodies.Citation5 In addition, attempts were made to generate immune responses against SS, for example by peptide or dendritic cell mediated vaccination targeting the SS18-SSX fusion proteins or cancer testis antigens.Citation5,Citation6 T-cell receptor (TCR) gene therapy with NY-ESO-1 specific HLA-A*02:01 restricted T-cells resulted in objective responses in 11/18 patients including 1 complete response.Citation7 Recently, preferentially expressed antigen in melanoma (PRAME) was identified as a potential target for immunotherapeutic approaches in sarcomaCitation8, with SS expressing the highest levels of PRAME. We previously identified a PRAME-specific HLA-A*02:01 restricted TCR with potent anti-tumor potential. This PRAME-specific TCR is currently used for the treatment of refractory or relapsed acute myeloid leukemia in a phase I TCR-gene therapy trial (ClinicalTrials.gov NCT02743611) to assess safety and feasibility.Citation9
In this study, we explore whether patients suffering from SS might benefit from PRAME-TCR-gene therapy by analyzing PRAME mRNA expression levels and by testing in vitro whether sarcomas can be recognized by PRAME-specific T-cells. Heterogeneous antigen expression within tumors can help malignancies to escape from targeted therapeutic strategies so we aimed to evaluate intra-tumoral expression patterns of PRAME. To our best knowledge, there is no PRAME-specific antibody available that is suitable for use in formalin fixed paraffin embedded tissue samples. To overcome this problem, we developed and tested a PRAME-specific mRNA fluorescence in situ hybridization (mRNA-FISH) technique to assess PRAME expression patterns in SS. Furthermore, tumor-specific T-cells need HLA class I (HLA-I) expression on tumor cells to be able to recognize their antigenic peptide presented in the context of HLA-I, thereby leading to execution of their anti-tumor effect. Therefore, we studied the expression and distribution of HLA-I in SS samples and investigated in more detail the variable HLA-I expression.
Results
Synovial sarcomas express PRAME at a high level and are efficiently recognized by PRAME-specific T-cells
We first assessed PRAME expression in a panel of 158 sarcomas using publicly available mRNA expression data. A substantial part of the different sarcoma types expressed PRAME and all SS (35/35) and EWSR1-NFATc2 translocation positive Ewing sarcomas (8/8) expressed PRAME at high levels (). Next, the recognition potential of PRAME specific T-cells was tested against a panel of 26 sarcoma cell lines, including one SS cell-line (SYO-1) and 2 primary SS cultures, L2701 and L2521, both of passage ≤ 3. All sarcoma cells that were PRAME positive (19/25), as measured by real-time quantitative polymerase chain reaction (rt-qPCR), were recognized by PRAME-T-cells and PRAME negative cell-lines were not (Figure S1). Flow cytometric analyses demonstrated that interferon (IFN) stimulation resulted in up regulation of HLA-I in all different sarcoma cell-lines, with IFNγ being more potent than IFNα (, Figure S1). IFN pre-treatment of the sarcoma cells also resulted in increased recognition by the PRAME-T-cells (Figure S1). HLA-A*02:01 positive L2521 primary SS cells were efficiently recognized by PRAME-T-cells, even without IFN treatment (). HLA-A*02:01 negative L2701 primary SS cells were not recognized (not shown). Transfer of HLA-A*02:01 into L2701 and the SS cell-line SYO-1 resulted in efficient recognition by PRAME-T-cells which was further increased by IFN stimulation (). In summary, PRAME is highly expressed in 100% of SS, and its expression can be targeted by PRAME-T-cells. Furthermore, the HLA-A*02:01 restricted recognition of sarcoma cells by PRAME-T-cells can be increased by IFN treatment.
Figure 1. PRAME and HLA-I expression in synovial sarcoma and recognition by PRAME-T-cells.
a) PRAME expression in sarcoma as measured by mRNA-micro array. Horizontal line represents arbitrary cut-off value for PRAME positivity. Circles highlight high expression in all SS and EWS-NFATc2 translocation positive Ewing sarcomas. b-c) Primary SS (p ≤ 3) L2521 (b) and L2701 (c) were analysed by flowcytometry to assess total HLA-I surface expression after stimulation with 300u/ml of IFNα (IFNα) or 100u/ml IFNγ (IFNγ) for 18h. d) PRAME-T-cells (PRAME) were stimulated with primary SS cells L2521 and HLA-A2 transduced L2701 (L2701-A2), and SS cell line SYO1 transduced with HLA-A2 (SYO-1-A2). IFNγ production by the T-cells was measured after 18h of stimulation by standard ELISA. A CMV specific HLA-A2 restricted T-cell clone (CMV) served as negative control, and the USP11 specific HLA-A2 restricted T-cell clone (USP11) served as positive control. Synovial sarcoma cells were treated with 300u/ml of IFNα, (IFNα), 100u/ml IFNγ (IFNγ) or nothing (none) before stimulation.
PRAME is homogeneously expressed in the majority of synovial sarcoma patients
We evaluated the intra-tumoral PRAME expression patterns in primary and metastasized SS of both biphasic and monophasic morphology. Since no reliable antibody against PRAME exists for staining formalin fixed paraffin embedded (FFPE) tumor samples, we developed a PRAME specific mRNA fluorescence in situ hybridization (FISH) technique for PRAME detection in FFPE tissue samples (see supplementary data). PRAME expression patterns were assessed in FFPE tissue sections of 52 primary and metastasized SS samples derived from 29 patients. PRAME and Glyceraldehyde 3-phosphate dehydrogenase (GAPDH) probe sets with different labels were hybridized together to a single slide of each tumor. 45/52 Tumors demonstrated appropriate staining with the GAPDH probe set, confirming good mRNA quality, and therefore suitability for analysis. All 45 tumor samples analyzed from 26 patients demonstrated PRAME expression. 22 of 26 patients, including 14 monophasic patients, 7 biphasic patients and one poorly differentiated patient, homogeneously expressed PRAME in all tumor samples tested (). One monophasic SS patient (pt. 15) demonstrated heterogeneous expression of PRAME (50–90% PRAME + cells). Three biphasic patients demonstrated a heterogeneous pattern of PRAME expression in at least one of the tumor samples tested (2 patients with 50–90% PRAME + cells, 1 patient with 10–50% PRAME + cells) (). We confirmed these results by performing a dye mirrored experiment which gave identical results. In summary, PRAME was homogeneously expressed in 85% of SS patients.
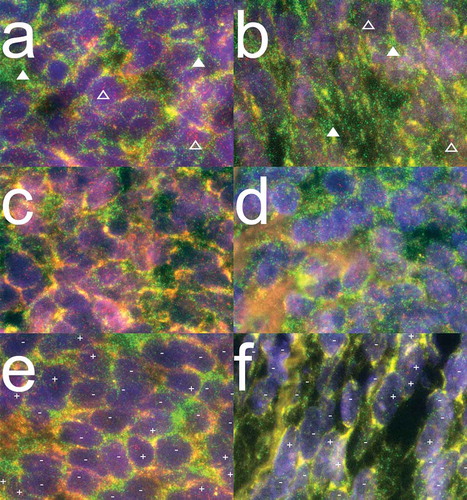
Figure 2. PRAME mRNA expression patterns in synovial sarcoma.
Combined images of PRAME and GAPDH mRNA probe sets hybridized together to FFPE synovial sarcoma sections. PRAME and GAPDH molecules are visualized as refraction limited spots in red and green respectively. PRAME specific signals are visualized as red dots of which examples are indicated above open triangles. GAPDH specific signals are visualized in green of which examples are indicated above closed triangles. The DAPI nuclear counterstaining is visualized in blue to outline the morphology of the tissue. (a-b) Representative images of 14/15 monophasic SS patients analysed, demonstrating homogeneous expression (> 90% of cells +) of both GAPDH and PRAME mRNA molecules. (c-d) Representative images for 16/21 biphasic SS from 7/10 patients demonstrating homogeneous expression of both GAPDH and PRAME mRNA molecules. (e) Representative image for SS21-SS23, all derived from biphasic SS patient 7 demonstrating both PRAME positive (+) and PRAME negative (-) cells throughout the whole tumours while the internal control GAPDH stained homogeneously. (f) Representative image of biphasic SS46, in which GAPDH stains homogeneously positive while small areas with PRAME positive cells (+) were seen between larger areas of PRAME negative cells (-).
Synovial sarcomas have a low baseline expression of HLA class I that is up regulated in specific areas
Since HLA-I expression on tumors is essential for T-cells to become activated and execute their anti-tumor effect, we assessed HLA-I expression on the same 52 FFPE by immunohistochemistry (IHC) with antibodies directed against HLA-A, HLA-B/C and β2 microglobulin (B2M). Samples that were derived from the same patient mostly showed identical staining patterns for HLA-I (table S1). When multiple tumors were available of a single patient, the average scoring of the different blocks was used for statistical analysis.
Eleven of the 17 monophasic patients had weak, focal expression of HLA-I on their tumors. The HLA-I expression on these tumors could be visualized by minimally one of the HLA-I antibodies, but did not reach the level of HLA-I that was observed on the endothelial cells in the same slide (). This HLA-I staining pattern was comparable to normal, healthy connective tissue (). In the other 6 monophasic patients heterogeneous HLA-I expression on the tumor cells of the different tumor samples was observed. The HLA-I expression in large areas of these tumors was low, but these areas were alternated with areas of tumor cells with elevated HLA-I expression that was similar to the HLA-I expression observed on the endothelial cells in the same slide (). Finally, one small lung metastasis demonstrated homogeneous high expression of HLA-I (). Interestingly, from one monophasic tumor (SS35), we had both an FFPE tissue block as well as primary cultured cells (L2521) available. This tumor demonstrated heterogeneous HLA-I expression () and the L2521 primary SS cells that were derived from this tumor, demonstrated high HLA-I expression () and were efficiently recognized by PRAME-T-cells ().
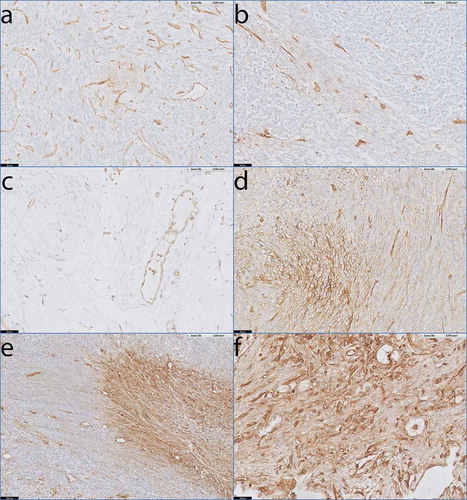
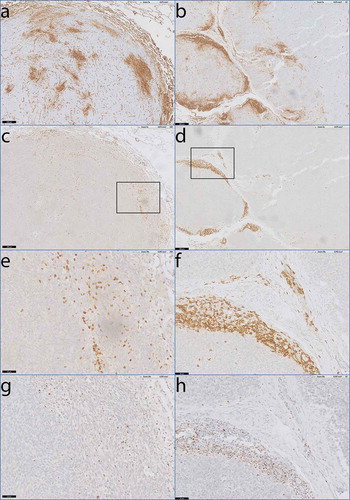
Figure 3. HLA-I expression patterns in monophasic SS.
Antibody staining specific for HLA-A and HLAB/C on tumour sections from monophasic SS with endothelial lining of blood vessels as internal positive control. a) SS51 demonstrating low, focal expression of HLA-A. b) SS38 demonstrating low, focal expression of HLA-B/C. c) Healthy loose connective tissue demonstrating low HLA-B/C expression on stromal cells. d) SS35 demonstrating heterogeneous expression of HLA-A. e) SS05 demonstrating heterogeneous expression of HLA-A. f) Small lung metastasis (< 2 mm) demonstrating homogeneous expression of HLA-B/C.Scale bars: a-d, f: 50 µm; e: 100 µm.
Only one biphasic SS patient demonstrated no HLA-I on the tumor cells (), and one patient demonstrated weak, focal HLA-I expression (). The majority of patients (9/11) with biphasic SS demonstrated heterogeneous HLA-I expression (). The HLA-I up regulation in the HLA-I heterogeneous expressed tumors was mainly present in the differentiated biphasic component of the biphasic SS (). This was especially clear in tumors of two patients (pt. 8 and 30) where the biphasic components were differentiated into epithelial-like ducts. In these 2 tumors (SS24 and SS53), the ducts demonstrated strongly elevated HLA-I expression compared to the spindle cell compartments in between the ducts (). Finally, we analyzed 1 poorly differentiated SS which was heterogeneous for HLA-I ().
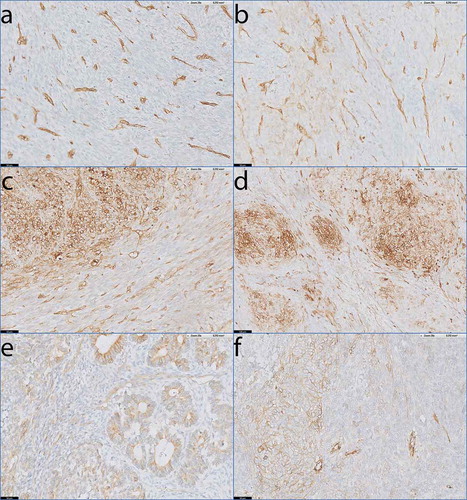
Figure 4. HLA-I expression patterns in biphasic and poorly differentiated SS.
Antibody staining specific for HLA-A and HLA-B/C on tumour sections of biphasic SS (a-e) and poorly differentiated SS (f). a) Absent staining of HLA-A on SS46. b) Low, focal expression of HLA-A on SS15. c-e) Heterogeneous expression of HLA-A on SS34 (c) and HLA-B/C on SS23 (d) and SS24 (e) with the biphasic component of the tumour demonstrating clear up regulation of HLA-I compared to the spindle cell compartment that lies in between the biphasic parts. Note that HLA-I is elevated on the epithelial-like ducts in SS24 (e). f) SS50, demonstrating heterogeneous expression of HLA-A on a poorly differentiated SS.Scale bars a-c, e-f: 50 µm; d: 100 µm.
In summary, the tumors of biphasic SS patients demonstrated significantly more heterogeneous expression of HLA-I than the tumors of monophasic SS patients (9/11 vs. 6/17, Fisher’s Exact Test, p = 0.024). Our results illustrate that SS has a low baseline level of HLA-I expression, similar to healthy connective tissue, but that HLA-I expression is often elevated in selected areas of the tumor, especially in the biphasic component of biphasic SS (table S1).
In synovial sarcoma, HLA-I up-regulation is associated with dense T-cell infiltration
Since not all HLA-I up regulation in SS could be explained by differentiation into the biphasic component of SS, we investigated whether HLA-I expression was accompanied by infiltration of T-cells. IHC with an anti-CD3 mAb was performed on the FFPE tissue sections of all patients. The average infiltration throughout the whole slide was scored, since in part of the tumor samples the T-cells were not evenly distributed throughout the tumor sections. We observed low T-cell infiltration (0–5 cells/high power field) in 38/52 tumors, intermediate T-cell infiltration (5–20/high power field) in 10/52 tumors and high T cell infiltration (20+/high power field) in 4/52 tumors. Samples that were derived from the same patient mostly showed similar average T-cell infiltration rates (table S1). There was no significant relation of increased average T-cell infiltration (intermediate or high) with histological subtype or elevated HLA-I expression levels per patient. (Fischer’s exact tests p = 0.653 and p = 0.183 respectively).
To further investigate a potential correlation between T-cell infiltration and HLA-I expression in SS, we digitally overlaid the whole slide images of CD3 and HLA-I stained slides from consecutive sections. We identified 10 tumors (3 with high average T-cell infiltration, 3 with intermediate average T-cell infiltration and 4 with low average T-cell infiltration), derived from 6 patients of which 5 were biphasic and 1 was monophasic, in which we demonstrated clear co-localization of infiltrating T-cells and HLA-I up regulation on tumor cells. In these cases, tumor areas that were densely infiltrated with T-cells showed elevated levels of HLA-I on the tumor cells compared to tumor areas that were not densely infiltrated with T-cells ().
Figure 5. Co-localisation of activated T-cells and HLA-I expression in monophasic and biphasic SS.
Digitally overlaid slides of consecutive sections that were stained with antibodies specific for HLA-I, CD3, and T-bet. a) Heterogeneous staining of HLA-A in monophasic SS07. b) Heterogeneous staining of HLA-B/C in biphasic SS45. c-d) consecutive slide after a and b demonstrating dense T-cell infiltration by anti-CD3 staining in areas of elevated HLA-I expression. e-f) Magnification of c and d. g) consecutive slide after e, demonstrating T-bet positivity of densely infiltrated T-cells. h) consecutive slide after f demonstrating T-bet positivity of densely infiltrated T-cells as well.Scale bars: a-d: 200 µm, e-h: 50 µm.
To investigate whether these infiltrating T-cells were activated, we performed IHC with an mAb directed against T-bet on all 10 tumor sections that showed co-localization of T-cells and up regulated HLA-I expression on tumor cells. In all 10 slides, the T-cells in these tumor areas were expressing T-bet (), a transcription factor that regulates IFN-y production, suggesting that the T-cells were activated.
In summary, up regulation of HLA-I expression on the tumor cells in monophasic and biphasic SS is associated with infiltration of T cells in these specific areas or with differentiation into the biphasic component of the SS cells.
Discussion
Our results demonstrate that PRAME is highly expressed in 100% of SS and that in the majority of SS patients, PRAME expression exhibits a homogeneous expression pattern. SS has low intrinsic HLA-I expression similar to the surrounding connective tissue, but its expression was elevated in specific areas of the tumors, especially in biphasic components of biphasic synovial sarcoma, and in areas with densely infiltrating T-cells. Furthermore, we demonstrated that PRAME-T-cells efficiently recognized SS cells, and that this recognition can be increased upon IFN stimulation, indicating that they can kill SS tumors when HLA-I expression is high enough. These results demonstrate that synovial sarcoma is a suitable candidate for PRAME-specific TCR-gene therapy.
Although the mechanism behind elevated PRAME expression in SS is still unknown, we and othersCitation8 did not find a single SS without expression of PRAME at the RNA level. This suggests that the gene is either essential for the survival of this tumor or that its expression is directly regulated by the oncogenic fusion gene that makes this tumor to thrive. In addition, PRAME was homogeneously expressed in 85% of all patients investigated, making it less likely for this tumor to develop PRAME negative escape variants in reaction to PRAME-specific TCR-gene therapy when compared to similar approaches targeting other tumor associated antigens, e.g. NY-ESO-1 or MAGE-1.Citation10 The high and mostly homogeneous expression indicates that all HLA-A*02:01 positive SS patients could be treated with PRAME-specific T-cells, which might be favorable to the earlier used approach targeting NY-ESO-1.Citation7 NY-ESO-1 is expressed heterogeneously in SS, with only 56% of tumors expressing the antigen in more than 50% of the tumor cells.Citation11 PRAME-TCR engineered T-cells could be used for the treatment of other cancers as well, including medulloblastoma, since many tumor types express PRAME.Citation8–Citation10,Citation12–Citation14 PRAME-TCR engineered T-cells are currently used for the treatment of refractory or relapsed acute myeloid leukemia (AML) in a phase I TCR-gene therapy trial (ClinicalTrials.gov NCT02743611). However, in contrast to synovial sarcoma, prior testing for PRAME expression in tumor samples will be essential, since not all AMLs are PRAME positive. Our expression array data indicate that EWSR1-NFATc2 translocation positive Ewing sarcomas might also be a suitable candidate for PRAME-TCR gene therapy, since 100% of tumors tested are PRAME positive, and high levels of T cell infiltration were already described by Szuhai et. al.Citation15
Although we did not demonstrate PRAME expression at the protein level in the tissue sections, we did demonstrate a clear relation between high PRAME mRNA levels and recognition by PRAME-T-cells in 25 sarcoma cell lines including 3 SS cell lines. In the past, this relation was demonstrated in more than 50 other cancer cell lines as well.Citation9,Citation16 We hereby proofed that mRNA expression leads to the expression of the relevant PRAME peptide because PRAME-T-cells could only have recognized the sarcoma cells if the PRAME peptide was processed by the proteasome and presented in the context of HLA-I. Whether a full length and functional protein is transcribed as well is not certain, but not relevant either, because expression and processing of the 9-amino acid long peptide is enough for T-cell recognition.
PRAME cannot be targeted by CAR-T-cells because it is an intracellular protein that is not expressed on the cell surface. Therefore, it has to be processed and presented in the context of HLA-I before it can be targeted by T-cells. Many SS cases exhibit a low HLA-I baseline level, resembling the expression on other cells from mesenchymal origin, e.g. healthy muscle tissues.Citation17–Citation19 However, in part of the SS samples we observed heterogeneous up regulation of HLA-I, especially in the glandular formations and biphasic nests of biphasic SS, suggesting that HLA-I up regulation could be explained by a differentiation process towards epithelium. We hypothesize that during the differentiation of biphasic SS, the tumor cells up regulate HLA-I in a similar process as occurs during normal epithelial differentiation of healthy cells.
Furthermore, in 5/10 biphasic SS and 1/16 monophasic SS patients, we found co-localization of dense infiltration of T-bet positive T-cells and HLA-I up regulation on the tumor cells. The underlying mechanism of co localization of T-cell infiltration and HLA-I up regulation on the tumor cells cannot be extracted from our data. Whether the infiltrating T-cells got activated, produced cytokines and thereby elevated HLA-I expression or that they were attracted to tumor cells with elevated HLA-I expression remains unclear. Another possibility is that a third, environmental factor both stimulated HLA-I expression on SS cells and attracted the infiltrating T-cells. If it is a third, environmental factor, this could explain why we see the co-localization more often in biphasic SS. Due to its intrinsic capability to differentiate towards epithelium,Citation20–Citation22 biphasic SS might be more prone to up regulate HLA-I in response to environmental factors that also attract infiltrating T-cells. The phenomenon of co-localization of infiltrating T-cells and HLA-I up regulation was described in other sarcomas as well, e.g. osteosarcoma.Citation23
The low HLA-I expression that was observed in many synovial sarcoma cases might be one of the reasons for PRAME-T-cell therapy to fail. However, Robbins et. al. already demonstrated favorable results with HLA-A*02:01 dependent NY-ESO1 specific TCR-gene therapy in this tumorCitation7. We hypothesize that the low HLA-I expression in SS will be enough to initiate activation of T-cells. Activation of TCR-modified T-cells will lead to excretion of cytokines and we believe that this might attract more inflammatory cells and enhances HLA-I expression on SS cells, thereby partly overcoming the observed low HLA-I expression on SS. When further research demonstrates that responses to TCR-gene therapy correlate with HLA-I expression levels in SS, TCR-gene therapy might be combined with agents that enhance HLA-I expression, e.g. IFNα. Immune checkpoints might become overexpressed during treatment with PRAME-T-cells forming another problem. If this is the case, TCR-gene therapy might be combined with immune-checkpoint blockade as well.
In conclusion, we demonstrated that PRAME is a suitable target for TCR-gene therapy of SS because of its high and mostly homogeneous expression pattern. Furthermore, we demonstrated heterogeneous expression of HLA-I in SS, correlating with differentiation into epithelial structures in biphasic SS and with infiltration of T cells.
Materials and methods
mRNA micro-array analysis
mRNA expression data from Ewing sarcomas, synovial sarcoma, osteosarcomas, BCOR-CCNB3 translocation sarcomas and EWSR1-NFATc2 translocation positive Ewing sarcomas were downloaded from the Gene Expression Omnibus (GSE20196, GSE2109, GSE14827, GSE2110, GSE34620, GSE12102, GSE34800 and GSE60740). The java based Chipster software was used for quality control and integrated gcRMA normalization.Citation24
Human material
Human tissue was handled in a coded fashion, according to Dutch national ethical guidelines (“Code for Proper Secondary Use of Human Tissue,” Dutch Federation of Medical Scientific Societies) as reviewed and approved by the LUMC ethical board (B17.033). Primary SS cells were obtained from tumor resections as previously described.Citation25 Formalin fixed, paraffin embedded (FFPE) tissue blocks that were archived between 2005 and 2015 were collected from our pathological archives including 24 primary tumors, 8 recurrent tumors and 21 metastasis from a total of 29 patients. From nine patients in our series multiple tumors were available. All tumors were confirmed to be SS based on histology and genetic testing for (X;18) rearrangements in routine diagnostics. Tumors were divided in biphasic and monophasic SS based on histological findings. Ten consecutive sections of 4 µm-thick were cut from each tumor.
Cell lines
Sarcoma cell lines were cultured in Iscove’s Modified Dulbecco’s Medium (IMDM; Lonza, Basel, Switzerland) supplemented with 10% fetal bovine serum (FBS; Gibco, Life Technologies, Carlsbad, California). The following sarcoma derived cell-lines were used: Ewing sarcoma: L1062, EW7 Citation25, IOR/BRZ which was kindly provided by Katia Scotlandi, CRS Laboratory of Experimental Oncology-Rizzoli Orthopaedic Institute,Citation26 Sk-N-MC, STA-ET2.1, RD-ES, CADO-ES, A673, TC71, SK-ES1 and EW3;Citation27 osteosarcoma: Saos-2, HOS143b, SJSA1, U2-OS, ZK58, MG63 and OHS;Citation27 rhabdomyosarcoma: RD (ATCC: HTB-166), RH30, A204 and TE671 (DSMZ: ACC-489, ACC-250 and ACC-263, respectively) and from synovial sarcoma: SYO-1, which was a kind gift from Akira Kaway, National Cancer Center Hospital, Tokyo.Citation28
Quantitative real-time PCR
PRAME expression was measured by quantitative real-time polymerase chain reaction (rt-qPCR) using Evagreen® (Biotium, Hayward, California) fluorescence as readout. Total RNA was isolated using the micro RNaqueous kit (Ambion, Austin, Texas) before DNA was fragmented with DNAse (Ambion, Austin, Texas) and removed by RNeasy mini kit (Qiagen, Hilden, Germany). cDNA synthesis was performed using oligo dT primers with M-MLV reverse transcriptase (Invitrogen, Carlsbad, California). Primers for amplifying PRAME derived cDNA were 5ʹ CGTTTGTGGGGTTCCATTC 3ʹ and 5ʹ GCTCCCTGGGCAGCAAC 3ʹ. Each sample was run in triplicate using cDNA derived from 20ng of total RNA. The household gene Porphobilinogen Deaminase (PBGD) was used to ensure good cDNA quality. Rt-qPCR expression values for PRAME in sarcomas were normalized to the expression of PRAME in melanoma cell line mel1.14 using the Delta-Ct method.
T-cell recognition assay
T cells were cultured in T-cell medium consisting of IMDM supplemented with 100 IU/ml IL-2 (Proleukine; Novartis Pharma, Arnhem, The Netherlands), 5% FCS and 5% human serum.
The PRAME-specific T-cell clone HSS1 which recognizes the SLLQHLIGL epitope of PRAME in the context of HLA-A*02:01 was used to evaluate whether PRAME-specific T-cells can recognize sarcoma cells.Citation9 The PRAME specific TCR of HSS1 is currently used for the treatment of refractory or relapsed acute myeloid leukemia in a Phase I TCR-gene therapy trial (ClinicalTrials.gov NCT02743611). Controls included T-cell clone HSS12 recognizing peptide FTWEGLYNV from the ubiquitously expressed gene USP11 in the context of HLA-A*02:01 to confirm HLA-A*02:01 expression, Citation9 and the negative control clone pp65-A2,Citation29 also HLA-A*02:01-restricted, recognizing an antigen from cytomegalovirus (CMV), that is not expressed in sarcoma cells. T-cells were co-incubated with sarcoma cell lines and primary SS cells at responder-to-stimulator ratios of 1:4 . Five thousand T cells were co-incubated with 20.000 sarcoma cells in a round bottomed 96-well plate for 18h. If sarcoma cells were HLA-A*02:01 negative based on genetic testing, we introduced HLA-A*02:01 using retroviral vectors as described previously.Citation30 After 18 h co-incubation, supernatants were harvested and IFN-γ production was measured by standard enzyme-linked immunosorbent assay (ELISA, Sanquin Reagents, The Netherlands).
Flow cytometry
For flow cytometric analysis of HLA-I expression on sarcoma cells, FITC-labeled monoclonal antibodies (mAb) were used against HLA-A*02:01 (clone BB7.2, BD biosciences, Netherlands) and HLA-ABC (clone W6/32, AbD Serotec, Ltd-Kidlington, UK) as well as an IgG1-FITC isotype control mAb against an irrelevant antigen (Sanquin, Netherlands). Flow cytometry was performed on a FACS Calibur (BD Biosciences, San Jose, CA, USA) and analysed using FlowJo Software (TreeStar, Ashland, OR, USA).
mRNA FISH in FFPE tissues using labelled oligonucleotides
An oligonucleotide probe set against PRAME mRNA was designed using the Stellaris ®FISH Probe Designer (Biosearch Technologies, Petaluma, CA, USA), available online. All probes were individually blasted and probes containing less than two mismatches with any other mRNA molecule were removed. 46 Probes were selected. Oligonucleotide probes recognizing GAPDH were commercially available from Biosearch technologies. For both genes, two probe sets were synthesized and labelled: one probe set labelled with Quasar 570 and one probe set with Quasar 670 (Biosearch Technologies, Petaluma, CA, USA). In all experiments, GAPDH served as an internal control for mRNA quality of the FFPE slides. There was no spectral overlap between Quasar 570 and 670 probe sets.
mRNA-FISH on FFPE slides was performed according to manufacturer’s protocol with modifications. Briefly, slides were deparaffinised in xylene and hydrated to 70% ethanol for permeabilization. Auto fluorescence was reduced by incubating slides in 70% EtOH with 0,25% ammonia for 1 hr at RT. Slides were subsequently permeabilized by incubation with 10µg/ml proteinase K (Promega, Madison, WI,USA) at 37°C and dehydrated using ethanol series. Hybridisation was performed under a cover slip for 24 hr in a moist chamber at 37°C. Homemade hybridization mix consisted of the probe sets at a final concentration of 125nM each, 2X SSC buffer, 10% deionised formamide, 10% dextran sulphate, and 0,1 mg/ml yeast tRNA. After hybridization the slides were washed twice with 2X SSC supplemented with 10% formamide for 30 min at 37°C, and subsequently washed with 2X SSC at RT, to remove formamide before dehydration in ethanol series. Sections were then embedded using ProLong™ Gold Antifade Mountant with DAPI (ThermoFisher, Eugene, OR, USA). A Leica DM5500 microscope equipped with a 63X oil immersion lens with a numerical aperture of 1.4 was used to grab images. From each area that was analysed, 5 spectral images (DAPI, FITC, DEAC, Cy3, and Cy5) were aquired. Cy3 and Cy5 showed the refraction limited spots from the Quasar 570 and Quasar 670 probes, respectively, while DAPI was used to show the outlines of cells by staining nuclei. FITC and DEAC images were taken to be able to correct for auto fluorescence. All images were analysed by two independent observers (SJL, KS) who scored all slides individually into the categories homogeneous (> 90% of cells expressing PRAME), heterogeneous (50–90% of cells expressing PRAME), low heterogeneous (10–50% of cells expressing PRAME), or negative (< 10% of cells expressing PRAME).
To verify the use of mRNA FISH in paraffin tissues, five different Ewing sarcoma cell lines with variable expression levels of PRAME were processed into paraffin blocks. Cell lines were cultured in vitro in IMDM medium with 10% FCS (no phenol red), fixed with 10% formalin and a solid pellet was created using the Shandon™ Cytoblock™ Cell Block Preparation System (Thermo Shandon Limited, Cheshire, UK). The resulting “tissue” was then processed by our standard diagnostic laboratory into paraffin to resemble archived paraffin blocks and the mRNA FISH technique was extensively tested.
Immunohistochemical analysis of HLA-I expression and T -cell infiltration
HLA-I expression in SS FFPE tissue slides was analyzed with primary antibodies against HLA-A (HC-A2), HLA-B/C (HC-10) and β2-microglobuline (A139; DAKO, Copenhagen, Denmark).Citation31 Secondary visualization was performed using a 3,3ʹ-Diaminobenzidine(DAB) based standard laboratory procedure that was described before.Citation19 Endothelial cells from blood vessels within the tumor served as a positive control for antibody staining. All tumors were scored by two independent observers (SJL and JVMGB/AHGC) and divided into four categories: absent, weakly focally positive, heterogeneous, and homogeneous positive staining. A monoclonal anti-CD3 antibody (AB699, Dako, Netherlands) was used to stain infiltrating T-cells and T-cell infiltration was graded into three groups according to Zhang et. al.: low infiltration: 0–5 T-cells/high power field, intermediate infiltration: 5–20 T-cells/high power field or high infiltration: > 20 T-cells/high power field.Citation32 T-bet was stained as described before.Citation33 All slides were scanned using a Phillips Ultra-Fast Scanner and overlays of consecutive slides were constructed using the corresponding Image Management System (Philips, Eindhoven, Netherlands).
Statistical analysis
Statistical analyses were performed using SPSS software version 23.0 (IBM Corporation, New York, NY, USA). Graphs were constructed using GraphPad Prism software version 7 (GraphPad Software, La Jolla, CA, USA). A Fisher’s exact test was performed to analyze differences in HLA-I expression levels between monophasic and biphasic synovial sarcoma and between densely infiltrated and not-densely infiltrated synovial sarcoma. Correlation of expression levels of PRAME as measured by rt-qPCR and mRNA FISH was expressed as a Pearson correlation coefficient.
Supplemental Material
Download MS Word (2.1 MB)Disclosure statement
No potential conflicts of interest were disclosed.
Supplementary material
Supplementary material for this article can be accessed here.
Additional information
Funding
References
- Suurmeijer AJH, De Bruijn D, Geurts van Kessel AH, Miettinen MM. Synovial sarcoma. In: Fletcher CDM, Bridge JA, Hogendoorn PC, Mertens F, editors. WHO classification of tumours of soft tissue and bone 4th. Lyon, France: IARC Press; 2013. 213–215. doi:
- Corey RM, Swett K, Ward WG. Epidemiology and survivorship of soft tissue sarcomas in adults: a national cancer database report. Cancer Med. 2014;3:1404–1415. doi:10.1002/cam4.288.
- Wang S, Song R, Sun T, Hou B, Hong G, Mallampati S, Sun H, Zhou X, Zhou C, Zhang H, et al. Survival changes in patients with synovial sarcoma, 1983–2012. J Cancer. 2017;8:1759–1768. doi:10.7150/jca.17349.
- Sultan I, Rodriguez-Galindo C, Saab R, Yasir S, Casanova M, Ferrari A. Comparing children and adults with synovial sarcoma in the surveillance, epidemiology, and end results program, 1983 to 2005: an analysis of 1268 patients. Cancer. 2009;115:3537–3547. doi:10.1002/cncr.24424.
- Vlenterie M, Jones RL, van der Graaf WT. Synovial sarcoma diagnosis and management in the era of targeted therapies. Curr Opin Oncol. 2015;27:316–322. doi:10.1097/CCO.0000000000000198.
- Kawaguchi S, Tsukahara T, Ida K, Kimura S, Murase M, Kano M, Emori M, Nagoya S, Kaya M, Torigoe T, et al. SYT-SSX breakpoint peptide vaccines in patients with synovial sarcoma: a study from the Japanese musculoskeletal oncology group. Cancer Sci. 2012;103:1625–1630. doi:10.1111/j.1349-7006.2012.02370.x.
- Robbins PF, Kassim SH, Tran TL, Crystal JS, Morgan RA, Feldman SA, Yang JC, Dudley ME, Wunderlich JR, Sherry RM, et al. A pilot trial using lymphocytes genetically engineered with an NY-ESO-1-reactive T-cell receptor: long-term follow-up and correlates with response. Clin Cancer Res. 2015;21:1019–1027. doi:10.1158/1078-0432.CCR-14-2708.
- Roszik J, Wang WL, Livingston JA, Roland CL, Ravi V, Yee C, Hwu P, Futreal A, Lazar AJ, Patel SR, et al. Overexpressed PRAME is a potential immunotherapy target in sarcoma subtypes. Clin Sarcoma Res. 2017;7:11. doi:10.1186/s13569-017-0077-3.
- Amir AL, van der Steen DM, van Loenen MM, Hagedoorn RS, de Boer R, Kester MD, de Ru AH, Lugthart GJ, van Kooten C, Hiemstra PS, et al. PRAME-specific Allo-HLA-restricted T cells with potent antitumor reactivity useful for therapeutic T-cell receptor gene transfer. Clin Cancer Res. 2011;17:5615–5625. doi:10.1158/1078-0432.CCR-11-1066.
- Iura K, Maekawa A, Kohashi K, Ishii T, Bekki H, Otsuka H, Yamada Y, Yamamoto H, Harimaya K, Iwamoto Y, et al. Cancer-testis antigen expression in synovial sarcoma: NY-ESO-1, PRAME, MAGEA4, and MAGEA1. Hum Pathol. 2017;61:130–139. doi:10.1016/j.humpath.2016.12.006.
- Jungbluth AA, Antonescu CR, Busam KJ, Iversen K, Kolb D, Coplan K, Chen YT, Stockert E, Ladanyi M, Old LJ. Monophasic and biphasic synovial sarcomas abundantly express cancer/testis antigen NY-ESO-1 but not MAGE-A1 or CT7. Int J Cancer. 2001;94:252–256. doi:
- Field MG, Decatur CL, Kurtenbach S, Gezgin G, van der Velden PA, Jager MJ, Kozak KN, Harbour JW. PRAME as an independent biomarker for metastasis in uveal melanoma. Clin Cancer Res. 2016;22:1234–1242. doi:10.1158/1078-0432.CCR-15-2071.
- Ikeda H, Lethe B, Lehmann F, van Baren N, Baurain JF, de Smet C, Chambost H, Vitale M, Moretta A, Boon T, et al. Characterization of an antigen that is recognized on a melanoma showing partial HLA loss by CTL expressing an NK inhibitory receptor. Immunity. 1997;6:199–208. doi:
- Orlando D, Miele E, de Angelis B, Guercio M, Boffa I, Sinibaldi M, Po A, Caruana I, Abballe L, Carai A, et al. Adoptive immunotherapy using PRAME-specific T cells in medulloblastoma. Cancer Res. 2018;78:3337–3349. doi:10.1158/0008-5472.CAN-17-3140.
- Szuhai K, Ijszenga M, De Jong D, Karseladze A, Tanke HJ, Hogendoorn PCW. The NFATc2 gene is involved in a novel cloned translocation in a Ewing sarcoma variant that couples its function in immunology to oncology. ClinCancer Res. 2009;15:2259–2268. doi: 1078-0432.CCR-08-2184 [pii];10.1158/1078-0432.CCR-08-2184 [doi]
- Gezgin G, Luk SJ, Cao J, Dogrusoz M, van der Steen DM, Hagedoorn RS, Krijgsman D, van der Velden PA, Field MG, Luyten GPM, et al. PRAME as a potential target for immunotherapy in metastatic uveal melanoma. JAMA Ophthalmol. 2017;135:541–549. doi:10.1001/jamaophthalmol.2017.0729.
- Fernandez JE, Concha A, Aranega A, Ruiz-Cabello F, Cabrera T, Garrido F. HLA class I and II expression in rhabdomyosarcomas. Immunobiology. 1991;182:440–448. doi:10.1016/S0171-2985(11)80208-1.
- Naka N, Takenaka S, Araki N, Miwa T, Hashimoto N, Yoshioka K, Joyama S, Hamada K, Tsukamoto Y, Tomita Y, et al. Synovial sarcoma is a stem cell malignancy. Stem Cells. 2010;28:1119–1131. doi:10.1002/stem.452.
- Kostine M, Briaire-de Bruijn IH, Cleven AHG, Vervat C, Corver WE, Schilham MW, van Beelen E, van Boven H, Haas RL, Italiano A, et al. Increased infiltration of M2-macrophages, T-cells and PD-L1 expression in high grade leiomyosarcomas supports immunotherapeutic strategies. Oncoimmunology. 2018;7:e1386828. doi:10.1080/2162402X.2017.1386828.
- Antonescu CR, Kawai A, Leung DH, Lonardo F, Woodruff JM, Healey JH, Ladanyi M. Strong association of SYT-SSX fusion type and morphologic epithelial differentiation in synovial sarcoma. Diagn Mol Pathol. 2000;9:1–8. doi:
- Fisher C. Synovial sarcoma: ultrastructural and immunohistochemical features of epithelial differentiation in monophasic and biphasic tumors. Hum Pathol. 1986;17:996–1008. doi:
- Allander SV, Illei PB, Chen Y, Antonescu CR, Bittner M, Ladanyi M, Meltzer PS. Expression profiling of synovial sarcoma by cDNA microarrays: association of ERBB2, IGFBP2, and ELF3 with epithelial differentiation. Am J Pathol. 2002;161:1587–1595. doi:10.1016/S0002-9440(10)64437-9.
- Sundara YT, Kostine M, Cleven AH, Bovee JV, Schilham MW, Cleton-Jansen AM. Increased PD-L1 and T-cell infiltration in the presence of HLA class I expression in metastatic high-grade osteosarcoma: a rationale for T-cell-based immunotherapy. Cancer Immunol Immunother. 2017;66:119–128. doi:10.1007/s00262-016-1925-3.
- Kallio MA, Tuimala JT, Hupponen T, Klemela P, Gentile M, Scheinin I, Koski M, Kaki J, Korpelainen EI. Chipster: user-friendly analysis software for microarray and other high-throughput data. BMC Genomics. 2011;12:507. doi:10.1186/1471-2164-12-507.
- Szuhai K, Ijszenga M, Tanke HJ, Rosenberg C, Hogendoorn PC. Molecular cytogenetic characterization of four previously established and two newly established Ewing sarcoma cell lines. Cancer Genet Cytogenet. 2006;166:173–179. doi:10.1016/j.cancergencyto.2005.11.006.
- Manara MC, Perbal B, Benini S, Strammiello R, Cerisano V, Perdichizzi S, Serra M, Astolfi A, Bertoni F, Alami J, et al. The expression of ccn3(nov) gene in musculoskeletal tumors. Am J Pathol. 2002;160:849–859. doi:10.1016/S0002-9440(10)64908-5.
- Ottaviano L, Schaefer KL, Gajewski M, Huckenbeck W, Baldus S, Rogel U, Mackintosh C, De Alava E, Myklebost O, Kresse SH, et al. Molecular characterization of commonly used cell lines for bone tumor research: a trans-European EuroBoNet effort. Genes Chromosomes Cancer. 2010;49:40–51. doi:10.1002/gcc.20717.
- Kawai A, Naito N, Yoshida A, Morimoto Y, Ouchida M, Shimizu K, Beppu Y. Establishment and characterization of a biphasic synovial sarcoma cell line, SYO-1. Cancer Lett. 2004;204:105–113. doi:
- Heemskerk MH, Hagedoorn RS, van der Hoorn MA, van der Veken LT, Hoogeboom M, Kester MG, Willemze R, Falkenburg JH. Efficiency of T-cell receptor expression in dual-specific T cells is controlled by the intrinsic qualities of the TCR chains within the TCR-CD3 complex. Blood. 2007;109:235–243. doi:10.1182/blood-2006-03-013318.
- Heemskerk MH, de Paus RA, Lurvink EG, Koning F, Mulder A, Willemze R, van Rood JJ, Falkenburg JH. Dual HLA class I and class II restricted recognition of alloreactive T lymphocytes mediated by a single T cell receptor complex. Proc Natl Acad Sci U S A. 2001;98:6806–6811. doi:10.1073/pnas.111162298.
- Mehta AM, Jordanova ES, Kenter GG, Ferrone S, Fleuren GJ. Association of antigen processing machinery and HLA class I defects with clinicopathological outcome in cervical carcinoma. Cancer Immunol Immunother. 2008;57:197–206. doi:10.1007/s00262-007-0362-8.
- Zhang L, Conejo-Garcia JR, Katsaros D, Gimotty PA, Massobrio M, Regnani G, Makrigiannakis A, Gray H, Schlienger K, Liebman MN, et al. Intratumoral T cells, recurrence, and survival in epithelial ovarian cancer. N Engl J Med. 2003;348:203–213. doi:10.1056/NEJMoa020177.
- Gorter A, Prins F, van Diepen M, Punt S, van der Burg SH. The tumor area occupied by Tbet+ cells in deeply invading cervical cancer predicts clinical outcome. J Transl Med. 2015;13:295. doi:10.1186/s12967-015-0664-0.