
ABSTRACT
Harnessing the immune system by checkpoint blockade has greatly expanded the therapeutic options for advanced cancer. Since the efficacy of immunotherapies is influenced by the molecular make-up of the tumor and its crosstalk with the immune system, comprehensive analysis of genetic and immunologic tumor characteristics is essential to gain insight into mechanisms of therapy response and resistance. We investigated the association of immune cell contexture and tumor genetics including tumor mutational burden (TMB), copy number alteration (CNA) load, mutant allele heterogeneity (MATH) and specific mutational signatures (MutSigs) using TCGA data of 5722 tumor samples from 21 cancer types. Among all genetic variables, MutSigs associated with DNA repair deficiency and AID/APOBEC gene activity showed the strongest positive correlations with immune parameters. For smoking-related and UV-light-exposure associated MutSigs a few positive correlations were identified, while MutSig 1 (clock-like process) correlated non-significantly or negatively with the major immune parameters in most cancer types. High TMB was associated with high immune cell infiltrates in some but not all cancer types, in contrast, high CNA load and high MATH were mostly associated with low immune cell infiltrates. While a bi- or multimodal distribution of TMB was observed in colorectal, stomach and endometrial cancer where its levels were associated with POLE/POLD1 mutations and MSI status, TMB was unimodal distributed in the most other cancer types including NSCLC and melanoma. In summary, this study uncovered specific genetic-immunology associations in major cancer types and suggests that mutational signatures should be further investigated as interesting candidates for response prediction beyond TMB.
Introduction
During the last five years, the development and use of antibodies directed against checkpoint molecules has considerably changed the therapeutic landscape of many advanced solid cancer types, where treatment options were very limited.Citation1,Citation2 As of now, approximately 2,000 immuno-oncology-related trials are being conducted and with an increasing portfolio of drugs under development, additional studies will enter the clinical arena and expand the spectrum of therapies in the near future.Citation3 While many trials showed highly encouraging data suggesting a cancer-type dependent durable response and prolonged survival in about 10–30% of the patients,Citation2,Citation4 it became evident that even with combinatorial regimens including two checkpoint blockers or chemotherapy and checkpoint inhibitors,Citation5–Citation7 many patients are either resistant at baseline or acquire resistance during therapy.Citation8 In general, high PD-L1 expression levels either in tumor cells or immune cells help to identify subsets of patients that benefit from PD-1 or PD-L1 inhibitors,Citation9,Citation10 but PD-L1 testing is rather coarsely granular and does not account for the complexity of cancer-immune cell interactions.Citation11 While detection of PD-L1 expression levels by immunohistochemistry was approved as companion diagnostic for certain clinical scenarios, the FDA acknowledged these observations by introducing a new class of predictive biomarkers termed complementary diagnostics, which aid clinical decision making but are not a prerequisite for treatment.Citation12
To overcome these limitations, several novel and complementary biomarkers are currently under investigation. Additional to negative predictors of response,Citation13–Citation16 which might play an increasingly important role in the near future, tumor mutational burden (TMB) approximating neo-antigenicityCitation17,Citation18 was observed to predict response to various checkpoint agents in different cancer types.Citation11,Citation19,Citation20 The potential of TMB as biomarker for immune therapy response independent from PD-L1 was demonstrated in phase III non-small cell lung carcinoma (NSCLC) trials including a retrospective analysis of the Checkmate 026 trial and more recent corroborative data obtained from the Checkmate 227 trial.Citation6,Citation21 In keeping with these results and further supporting the conceptual approach, the diagnostic assessment of specific mechanisms that drive TMB and the development of neo-antigens, such as mismatch repair deficiency (dMMR), has a strong clinical utility in patients receiving PD-1 blockade.Citation22,Citation23 These observations led to the recent FDA approval of the microsatellite instability (MSI) status as tumor type agnostic predictive biomarker for pembrolizumab.
However, a more robust and accurate response prediction will be only achieved by assays that reflect the complex and multi-leveled nature of the interaction between components of the tumor microenvironment (TME), cancer cells and tumor genetics. All assays currently used in clinics at best indirectly reflect the immune cell contexture, a hallmark that crucially distinguishes tumors which are likely to respond from those that will not respond to immunotherapy.Citation24 The development of such assays, however, requires a more thorough understanding of the interplay between the genetic make-up and immune cell compositions in specific cancer types – both at baseline and during spatiotemporal development. While several studies on either specific tumor typesCitation25,Citation26 or immune cell activitiesCitation27 have greatly elucidated these interactions also with respect to clinical implications, comprehensive pan-cancer analyses are still limited and were focused on the effect of copy number alterationsCitation28 as well as cancer type-specific immune cell repertoires including the role of B cells.Citation29 Very recently, analyzing the TCGA dataset, Thorsson and co-authors suggested a pan-cancer tumor classification into six main immune subtypes with putative prognostic implications.Citation30
Total TMB can be decomposed into mutational signatures (i.e. different types of base substitutions within a trinucleotide context, MutSigs) as recently introduced by Alexandrov and co-authors.Citation31–Citation33 Specific Mutsigs have been argued to be connected to specific biological processes including exogenous mutagens (e.g. UV-light, smoking), age-related deamination, defects in the DNA repair machinery and APOBEC enzyme expression. Mutant-allele tumor heterogeneity (MATH) is tumor genetic score for clonal diversity that was recently introduced by Mronz and Rocco.Citation34,Citation35
Here, we investigated the association of immune contexture and the expression of immune checkpoints with TMB, copy number alteration (CNA) load, MATH, mutational signatures and specific driver gene mutations across 5722 tumors of 21 cancer types from the TCGA dataset. The correlations analyses with the immune variables are structured as follows: First, we performed a pan-cancer analysis of all genetic variables. Second, we analyzed the global measures of mutational burden (TMB, CNA load and MATH) specifically in each cancer type. Third, we analyzed mutational signatures specifically in each cancer type. Fourth, we analyzed mutations in specific genes in each cancer type.
Results
We correlated 37 tumor microenvironment (TME) parameters including 35 immunological variables and two non-immunological variables (endothelial cells and fibroblasts) with three global measures of mutational burden and 23 mutational signatures (). The investigated cancer types are cited by the acronyms listed in the abbreviation section. For visualization of immunology-genetic correlations, we developed a new kind of heatmap and clustering: columns were clustered in the conventional way, i.e. with respect to the correlation data shown in the heatmap, but rows were clustered with respect to the levels of the immunological variables in the pan-cancer cohort. As a consequence, the order of the immunological variables is the same in all heatmap displays.
Figure 1. Flowchart of data collection and analysis (number of investigated parameters in brackets). Mutation calls, copy number alteration (CNA) and gene expression data were obtained from the cBioPortal. Tumor mutational burden (TMB) and mutant allele tumor heterogeneity (MATH) were calculated from the mutation calls, CNA load was calculated from the GISTIC CNA calls and levels of mutational signatures were obtained from.Citation32 The abundance of cell populations in the tumor microenvironment (TME) was estimated from bulk tissue gene expression data using the bioinformatic methods MCP-counter and CIBERSORT. Cytolytic activity (CYT) as well as PD-L1, PD-1, CTLA4 and IDO1 mRNA expression were also obtained from the bulk tissue gene expression data. Correlation analysis of 37 parameters of TME (35 immunological variables and two non-immunological variables) with 26 parameters of tumor genetics was performed.
Pan-cancer analysis of immune contexture and genetic variables
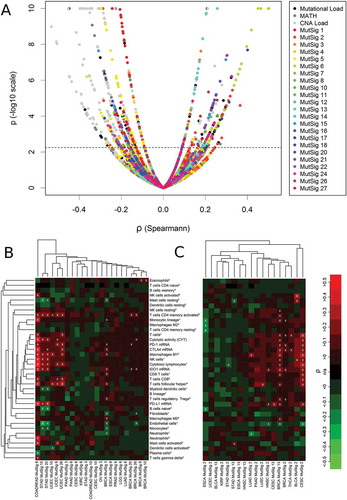
Correlation analysis of TME parameters and genetic variables was performed across 21 cancer types (). We detected a cluster of highly correlating immune variables that we termed “core immune signature” (CIS, mean pairwise correlation = 0.71, highlighted in yellow) including five immune cell populations (T cells, M1 macrophages, NK cells, CD8 + T cells and cytotoxic lymphocytes), cytolytic activity (CYT) as well as CTLA4, PD-1 and IDO1 expression, but not PD-L1 expression.
Figure 2. Pan-cancer (5722 tumors spanning 21 cancer types) correlation analysis of 37 TME parameters (including 35 immunological variables and two non-immunological cell populations) with 26 tumor genetic variables. A core cluster of immunological variables (T cells, CYT, M1 macrophages, NK cells, cytotoxic lymphocytes, CD8 + T cells as well as PD-1, CTLA4 and IDO1 expression) clustered tightly together (yellow box). In the heatmap, 37% of the correlations were significantly positive, 21% were significantly negative (white crosses, FDR< 5%). The abundance of cell populations was estimated by MCP-counter1 and CIBERSORT2. DNA repair deficiency related MutSigs: 3, 6, 10, 15, 20 and 26. APOBEC related MutSigs: 2 and 13.
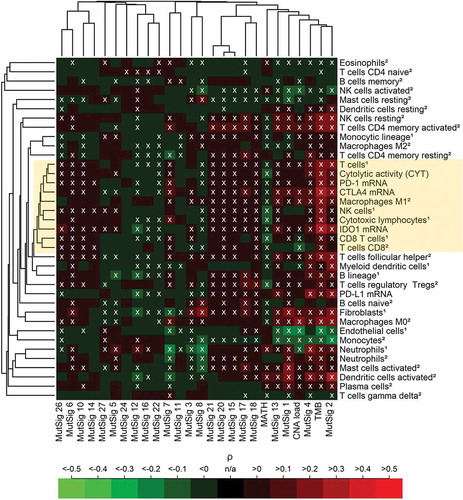
TMB showed the highest positive correlations with the CIS and other immune variables among all genetic variables, CNA load showed mixed positive and negative correlations, while MATH correlated negatively with all variables of the CIS. The two AID/APOBEC related MutSigs 2 and 13 as well as the DNA mismatch repair associated MutSigs 6, 15, 20 and 26 were among the MutSig that correlated most strongly positive with the CIS. Endothelial cells and fibroblasts (serving as non-immunological controls), clustered far away from the CIS and correlated negatively with TMB, CNA load and several of the MutSigs.
Cancer type-specific analysis of immune contexture and TMB
Next, we investigated the correlation of the 37 immunological parameters with TMB within each of the 21 cancer types ()). Cancer types were separated into those with negative or non-significant correlations with the CIS (cluster I, highlighted in blue) and those that correlated positively (cluster II, highlighted in yellow and including LGG, OV, BRCA, LUAD, CESC, UCEC, BLCA, LUSC, and COADREAD). Stomach adenocarcinoma (STAD) clustered separately from clusters I and II and exhibited some significant positive correlations with immunological variables. The strongest correlations of immune variables with TMB were detected in UCEC (follicular helper T cells: ρ = 0.32, M1 macrophages: ρ = 0.29) and COADREAD (cytotoxic lymphocytes: ρ = 0.30, NK cells: ρ = 0.30). PD-L1 expression correlated significantly with TMB only in COADREAD (ρ = 0.28, p = 8.8E-05, q = 0.00097) and STAD (ρ = 0.23, p = 3.2E-05, q = 0.00039).
Figure 3. Immune correlates of TMB in 21 specific cancer types and in the combined pan-cancer cohort. (A) Separation of cancer types in a cluster showing non-significant or negative correlations of TMB with the immune variables (cluster I, blue) and a cluster showing significant positive correlations (cluster II, yellow). Overall, 9% of the correlations were significantly positive, 9% were significantly negative (white crosses, FDR< 5%). (B) Fold changes of hypermutated (TMB ≥ 10 mut/Mb) vs. normal mutated (TMB < 10 mut/Mb) tumors. 13% of the correlations were significantly positive, 7% were significantly negative (white crosses, FDR< 5%). (C) Highly significant correlation of PD-L1 mRNA and TMB in colorectal cancer (COAD). (D) Highly significant correlation of PD-L1 mRNA and TMB in stomach adenocarcinoma (STAD). (E) Significant correlation of TMB and PD-L1 mRNA in uterine corpus endometrial carcinoma (UCEC). The abundance of cell populations was estimated by MCP-counter1 and CIBERSORT2.
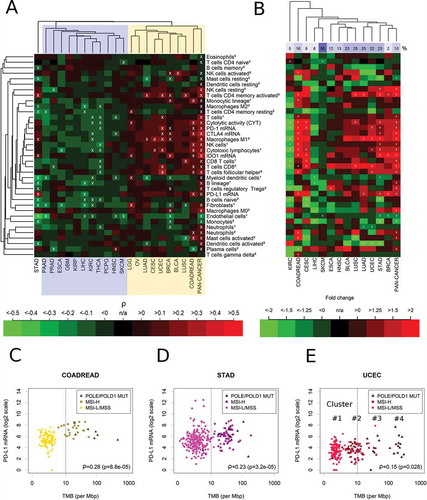
In a recent landmark study on hypermutated cancers, a TMB cutoff point of 10 mut/MB was suggested to separate hypermutated from non-hypermutated tumors.Citation36 Using this definition, we detected strong and significant increases of specific immune cell populations in hypermutated tumors of COADREAD, STAD, UCEC, CESC, BRCA, LGG, BLCA and LUSC ()). Among these cell populations, M1 macrophages were significantly and more than two-fold increased in COAREAD, LUAD, UCED and STAD. Additionally, CD4+ and CD8+ T cells were strongly increased in the hypermutated tumors of many of these cancer types. In contrast, activated dendritic cells were decreased more than two-fold in LUAD, UCEC and STAD. Interestingly, in contrast to all other major cancer types, hypermutation in KIRC was associated with strong decreases of CYT (fold change = -2.7, p = 6.5E-05, q = 0.00076) and many immune cell types, in particular of CD8+ T cells.
Cancer type-specific analysis of PD-L1 expression and TMB/MSI
Scatterplots of the correlation of PD-L1 expression and TMB suggested that the cutoff point TMB = 10 mut/Mb is appropriate for COADREAD and STAD, but not for UCEC (-E), Supplementary Figure 1). For COADREAD and STAD this cutoff point separated almost perfectly between MSI-H or POLE/POLD1 mutated tumors and MSI-L/MSS tumors and PD-L1 was strongly and highly significantly overexpressed in the tumors above the cutoff point of in these cancer types (fold change = 3.8, p = 5.7E-11, q = 1.5E-09 and fold change = 1.8, p = 8.8E-06, q = 0.00013). In UCEC, the analysis revealed a more complex situation of four clusters (ordered by increasing TMB) with most MSI-H tumors located in the 2nd cluster and scattering around TMB = 10 mut/Mb. The first cluster was composed almost exclusively of MSI-L/MSS tumors, while the second cluster was composed almost exclusively of MSI-H tumors and the fourth cluster was composed exclusively of POLE/POLD1 mutated tumors. A bimodal distribution of TMB was observed in BRCA, CESC, KIRC, and LIHC, while an unimodal distribution of TMB was observed in SKCM, LUAD, LUSC and HNSC.
Cancer type specific analysis of immune contexture and CNA load as well as MATH
Correlation analysis of CNA load with immune parameters separated cancer types into two clusters ()): cancer types that correlated negatively with many of the immunological variables (cluster I, highlighted in blue), particularly pronounced for COADREAD, STAD, BLCA, and HNSC, and cancer types with either non-significant or a very few significant positive correlations with immunological variables (cluster II, highlighted in yellow). Significantly positive correlations were detected in LGG, BRCA, KIRC, PCPG, PRAD and KIRP. PAAD clustered far away far away from both clusters and showed significant negative correlations with many of the immune variables in the CIS. In none of the cancer types, significantly positive correlations of PD-L1 expression and CNA load were detected.
Figure 4. Immune correlates of CNA load and MATH in 21 cancer types and in the combined pan-cancer cohort. (A) Separation of cancer types showing a cluster of significant negative correlations of CNA load with the immune variables (cluster I, blue) and a cluster showing significant positive or non-significant correlations (cluster II, yellow). Overall, 6% of the correlations were significantly positive, 25% were significantly negative (white crosses, FDR< 5%). (B) Negative or non-significant correlation of MATH with immune variables in almost all cancer types (except SKCM). 3% of the correlations were significantly positive, 18% were significantly negative (white crosses, FDR< 5%). The abundance of cell populations was estimated by MCP-counter1 and CIBERSORT2.
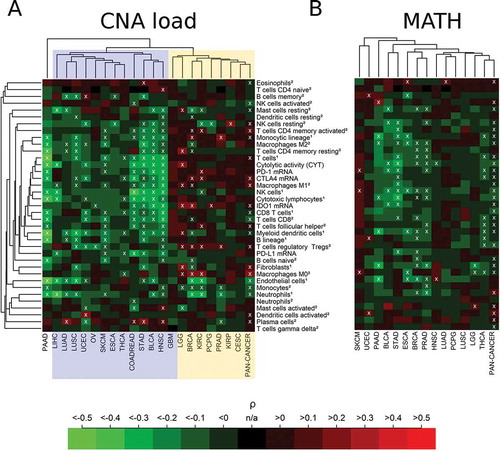
Correlation analysis of MATH showed a uniform result with predominating negative or non-significant correlations in all 14 cancer types for which MATH could by calculated based on existing mutant variant allele frequency data ()). Negative correlations with many immune variables were detected in PAAD, BLCA, STAD, THCA, ESCA, BRCA, PRAD, and THCA. In none of the cancer types, significant positive correlations of PD-L1 expression and MATH were detected. Altogether, the percentage of significant positive correlations with immune infiltrates in the heatmaps decreased from TMB (9%) to CNA (6%) and MATH (3%).
Cancer type specific analysis of immune contexture and mutational signatures
The 37 TME parameters were correlated with TMB, MATH, CNA load as well as 23 mutational signatures in 21 cancer types ()). Correlation strengths ranged between −0.54 and 0.51 with 388 correlations (7.3%) being significantly negative and 163 (3.0%) correlations being significantly positive out of a total of 5346 investigated correlations. The strongest positive correlations of immunological variables and genetic variables were observed for specific mutational signatures (colored points). These were stronger than the ones observed for the summary mutational metrics TMB, CNA Load and MATH (black and grey points). The strongest negative correlations were detected for CNA load, but many strongly negative and highly significant correlations were detected for MutSig 1 and MutSig 5 as well.
Figure 5. Correlations analysis of 37 TME parameters with 26 genetic variables in 21 cancer types. (A) Volcano plot showing 551 significant (above dashed line, FDR< 5%) correlations out of a total number of 5346 analyses. (B) Correlation of immunological variables with mutational signatures associated with failure of DNA repair (MutSigs 6, 15, 20, 26: defective mismatch repair; MutSig 3: defective double strand repair by HR; MutSig 10: POLE mutations): 8% of the correlations were significantly positive, 2% were significantly negative (white crosses, FDR< 5%). (C) Correlation of immunological variables with mutational signatures associated with activity of the AID/APOBEC family of cytidine deaminases: 7% of the correlations were significantly positive, 2% were significantly negative (white crosses, FDR< 5%). The abundance of cell populations was estimated by MCP-counter1 and CIBERSORT2.
For a more detailed interpretation we grouped the mutational signatures according to the putative etiology (-C), Supplementary Figure 2). First, we investigated mutational signatures associated with failure of DNA repair and detected strong significant positive correlations with the CIS in COADREAD, STAD, and UCEC as well as a weaker positive correlation in BRCA ()). Particularly, cytotoxic lymphocytes correlated significantly positive with the four signatures associated with defective DNA mismatch repair: with MutSig 6 in COADREAD (ρ = 0.50), with MutSigs 15 and 20 in STAD (ρ = 0.22 and ρ = 0.24) and with MutSigs 6 and 26 in UCEC (ρ = 0.21 and ρ = 0.22). MutSig3, associated with defective double strand repair by homologous recombination, correlated positively with IDO1 (ρ = 0.18), M0 macrophages (ρ = 0.17) and eight other immune variables in BRCA. MutSig 10, associated with POLE loss-of-function mutations, correlated significantly with M1 macrophages (ρ = 0.26) and follicular T helper cells (ρ = 0.21) in UCEC as well as significantly with eosinophils (ρ = 0.11) in BRCA. PD-L1 expression correlated significantly with MutSig 6 in COADREAD (ρ = 0.50) and MutSigs 15 and 20 in STAD (ρ = 0.30 and ρ = 0.30).
Second, we found significant positive correlations of the two signatures associated with activity of AID/APOBEC enzymes with many immune parameters in CESC and BRCA and with a couple of immune variables in BLCA, THCA and LUSC ()). T cells correlated significantly with MutSig 2 in CESC (ρ = 0.31), with MutSig 2 and MutSig 13 (ρ = 0.09 and ρ = 0.16) in BRCA and with MutSig 2 in THCA (ρ = 0.14). NK cells correlated significantly with MutSig 2 in CESC (ρ = 0.23), with MutSig 13 in BRCA (0.15) and with MutSig 2 in BLCA (ρ = 0.28). In CESC, correlations of immune cell populations with MutSig 2 were stronger than with MutSig13, while this was the other way around in BRCA. PD-L1 expression correlated significantly with MutSig 2 and MutSig 13 in CESC (ρ = 0.28 and ρ = 0.21), with MutSig 13 in BRCA (ρ = 0.17), and with MutSig 2 in HNSC (ρ = 0.18).
Third, positive correlations of immune cell populations with mutational signatures associated with the exposure to exogenous hazards and chemicals were rare and inhomogeneous across cancer types (Supplementary Figure 2b). The strongest among them were correlations of eosinophils with MutSig 22 (aristolochic acid associated) in LIHC (ρ = 0.23), of activated mast cells with MutSig 11 (alkylating agents associated) in SKCM (ρ = 0.23) and of CD4+ activated memory cells with MutSig 4 indicating tobacco smoking in LUAD (ρ = 0.23). No significant positive correlations with PD-L1 expression were observed.
Fourth, correlations of immune variables with MutSig 1 (clock-like process) were absent or negative in the vast majority of cases (99% of analyses, Supplementary Figure 2a). Negative correlations of immune cells with MutSig 1 were observed in in STAD, BRCA and SKCM and to some extend in PRAD. There were a few exceptions of significant positive correlations of immune variables with MutSig1: IDO1 expression and CYT in LGG (ρ = 0.26 and ρ = 0.18), T cells follicular helper cells in LUSC (ρ = 0.23), CD4+ resting memory cells in UCEC (ρ = 0.21), PD-L1 expression and plasma cells in HNSC (ρ = 0.18 and ρ = 0.14) and M0 macrophages in KIRC (ρ = 0.14).
Analysis of PD-L1 and PD-1 expression levels with immune cell contexture
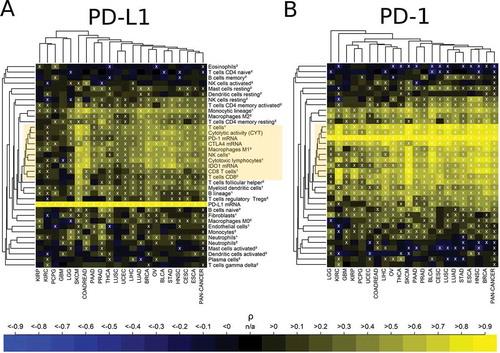
We analyzed the correlation of PD-1 and PD-L1 mRNA expression with the infiltration of immune cell populations in specific cancer types (). For both, PD-L1 and PD-1 the strongest correlations occurred with immune variables in the central immune signature (CIS) associated with T cell und M1 activated macrophage populations as well as CYT (yellow boxes). However, correlations of PD-1 expression with CIS were much higher than the corresponding correlations of PD-L1: As an example, correlations of PD-1 expression with CYT ranged between 0.65 and 0.94 (there were two exceptions with a lower correlation: PCPG ρ = 0.47 and GBM ρ = 0.56)., while correlations of PD-L1 expression with CYT ranged between 0.34 and 0.73 in different cancer types (there were four exceptions with a lower correlation: KIRC ρ = 0.13 PCPG ρ = 0.16, KIRP ρ = 0.17, and GBM ρ = 0.27).
Figure 6. Association of high immune checkpoint expression with the presence of immune cell infiltrates. (A) Strong positive correlation of PD-L1 expression with the immune variables in the central immune signature (CIS, yellow box). 60% of the correlations were significantly positive, 3% were significantly negative (white crosses, FDR< 5%). (B) Very strong positive correlation of PD-1 expression with the immune variables in the central immune signature (CIS, yellow box). 69% of the correlations were significantly positive, 6% were significantly negative (white crosses, FDR< 5%). The abundance of cell populations was estimated by MCP-counter1 and CIBERSORT2.
Analysis of specific genotypes and immune contextures in specific cancers types
Finally, we investigated whether the level of the immune variables were associated with the mutational status of specific genes (). The top twelve genes with the most are significant differences between mutated (mut) and wildtype (wt) tumors are highlighted in rainbow colors. The list of top genes included the tumor suppressor gene TP53 and the oncogene BRAF, but not the oncogene KRAS. Interestingly, we detected only two significant correlations of KRAS mutations with differences of immune parameters: B lineage cells were much lower in KRAS mutant stomach adenocarcinoma (fold change = -2.7, p = 2.7E-04) and endothelial cells were slightly lower in KRAS mutant colorectal carcinoma (fold change = −1.2, p = 2.5E-04).
Figure 7. Association of the levels of 37 TME parameters with mutations in specific genes. For each cancer type, all genes that were mutated in at least 20 tumors were included in the analysis. (A) Volcano plot with rainbow colors highlighting the twelve top genes (TP53, BRAF, IDH1, CDH1, PIK3CA, CIC, CTNNB1, TRRAP, OVGP1, ACVR2A, SI CASP8) that correlated highly significant (p < 1.0E-07) with at least one immune variables in at least one cancer type. (B) Heatmaps showing the fold change (mut vs. wt tumors) pattern of the twelve top genes in the cancer types with at least ten mutated tumors.
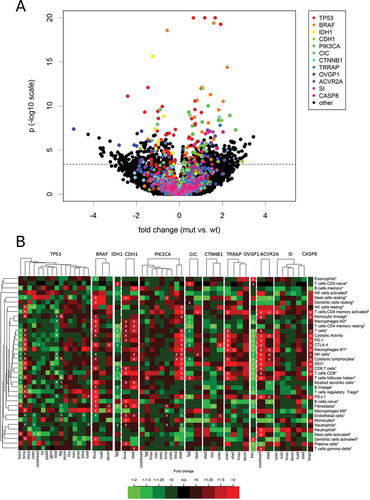
TP53 mutations were associated with increased immunological variables in BRCA, but decreased immunological variables in HNSC and STAD. In TP53 mutated BRCA, monocytic lineage cells (fold change = 1.6, p = 3.1E-22) and M0 macrophages (fold change = 3.8, p = 6.0E-21) showed the highest significances among many other increased cell populations. These changes occurred together with a strong up-regulation of IDO1 (fold change = 3.2) and CTLA4 (fold change = 2.3) as well as a moderate up-regulation of PD-1 (fold change = 1.7) and PD-L1 (fold change = 1.4, all p < 1.0E-05). In TP53 mutated HNSC, the changes of CD8+ T cells were at the top of a list ordered by significances (MCP-counter estimate: fold change = -2.8, p = 8.1E-13; CIBERSORT estimate: fold change = -5.3, p = 7.7E-12). These changes occurred together with a strong down-regulation of PD-1 (fold change = -2.0) and IDO1 (fold change = -3.1) as well as a moderate down-regulation of CTLA4 (fold change = -1.5) and PD-L1 (fold change = -1.4). In STAD, TP53 mutations were associated with a moderate decrease of many immunological variables including cytotoxic lymphocytes (fold change = -1.5, p = 1.1E-05) and cytolytic activity (fold change = -1.6, p = 4.0E-05).
BRAF mutations were associated with many increased immunological variables in THCA, but only a few and weak significant associations were detected in SKCM, while no significant associations were detected in LUAD. In BRAF mutated THCA, Myeloid dendritic cells (fold change = 3.0), M0 macrophages (fold change = 4.7) as well as PD-L1 (fold change = 2.1) and CTLA 4 expression (fold change = 2.7) were increased with the highest significance (all p < 1.0E-11).
In LGG, mutations of IDH1, CIC and NOTCH1 were associated with decreased immune cell infiltration. The cell populations decreased at highest significance were T cells (fold change = -1.7) and resting CD4 memory T cells (fold change = -2.6) in IDH1 mutated tumors and monocyte lineage cells (fold change = -1.9) and monocytes (fold change = -2.4) in CIC mutated tumors. IDH1 mutations and CIC mutations were associated with a significantly decreased PD-L1 expression (fold change −2.0 and −2.0) and PD-1 expression (fold change −1.9 and −1.7).
Discussion
We presented a comprehensive association analysis of immune cell contexture and immune checkpoint expression with global mutational measures including TMB, CNA load and MATH as well as with specific mutational signatures within and across major cancer types. Immune cell populations were estimated based on bulk tumor RNA-Seq data using the two bioinformatic methods MCP-counter and CIBERSORT.Citation37,Citation38 MCP-counter is a mathematically simple and robust approach based on marker genes that are specifically expressed in the cell types under investigation. Because specific marker genes are available only for a limited number of cell types the number of detectable cell population is limited to ten.Citation37 CIBERSORT allows abundance estimation for a higher number 22 cell types and is based on a mathematical more complex and thus more error-prone linear deconvolution of the bulk tissue gene expression profile using ν-SVR. There were two cells types that could be estimated by both methods: CD8 + T cells and neutrophils. For both of them, the MCP-counter and CIBERSORT results clustered together in the pan-cancer correlation analysis supporting the validity of the bioinformatic approaches.
In the cancer type specific analysis of TMB significant positive correlations with TME immune parameters were detected in COADREAD, STAD, UCEC, CESC, BRCA, LGG, BLCA, LUSC and LUAD. In all of these cancer types either mutational signatures associated with defective DNA repair, APOBEC gene family over-expression or exposure to tobacco smoke are detectable in subsets of tumors.
In COADREAD and STAD, a TMB cutoff of 10 mut/Mb separated almost perfect MSI-H or POLE/POLD1 mutated tumors from MSI-L/MSS tumors and was connected with over-expression of PD-L1 in the hypermutated tumors. However, correlations of PD-L1 expression and TMB were moderate in COADREAD and STAD (ρ = 0.28 and ρ = 0.23) and even weaker (and insignificant after multiple testing correction) in all other cancer types. Thus, PD-L1 expression and TMB should be considered as complimentary parameters carrying independent information on tumor biology. In most of the cancer types, there were many tumors with high PD-L1 expression or high TMB but not both. Collectively, these data also have direct clinical implications as they argue that both tests should be considered complimentary rather than exclusive in regard to evaluating patients for immunological treatment. Data of the Checkmate 026 and 227 trials support this notion.Citation6,Citation21 Optimization of the TMB cutoff point for immune checkpoint blockade is still under development. For NSCLC different cutoff points of 158, 200 and 243 per exome have been investigated.Citation19,Citation21,Citation39 Our data revealed different shapes of the TMB and PD-L1 expression distribution in different cancer types and suggest there is no one-fits-all TMB cutoff point and that cutoff optimization needs to be done separately for each cancer type.
Of note, PD-L1 can be expressed by different cell typesCitation40 and the bulk tissue RNA-Seq approach levels used here integrates contributions from different cells types including tumors cells, immune cells, fibroblasts and others. Using this approach, decomposition of PD-L1 expression into contributions from specific cells types is not feasible but would require tissue microdissection and separate gene expression analysis of specific cell fractions. In NSCLC, four of five immune checkpoint blockage companion/complementary diagnostic tests are based on PD-L1 protein expression on tumors cells, while a single test includes both, PD-L1 protein expression on tumor cells and on immune cells.Citation41 In many cancer types, immunohistochemical evaluation of PD-L1 expression remains puzzling and controversial because of several unresolved issues including different staining platform and antibodies as well as different methods and thresholds for PD-L1 counting.
In line with previous data, correlations of immune cell populations with CNA Load were negative or not significant in most cancer types.Citation28 There were only a few exceptions with significant positive correlations in cancer types including BRCA, KIRC and LGG. Interestingly, we detected significant negative correlations of many immune cell populations with subclonal genetic diversity (measured by MATH) in PAAD, BLCA, STAD, ESCA, BRCA, PRAD and THCA. These observations are in keeping with a recent report from Granahan et al.Citation42 suggesting that high clonal, but low subclonal neo-antigen burden is indicative of response to checkpoint blockade in NSCLC and melanoma.
It is a limitation of our study that we cannot exclude an influence of tumor purity of the detection sensitivity of somatic mutations and CNAs. However, only samples with at least 60% tumor nuclei are included in the TCGA cohort. Thus, the influence of tumor purity is restricted to the calling of subclonal mutations and low level CNAs. The consequence of varying tumor purity should be discussed separately for positive and negative immunology-genetics correlations: For positive correlations, imperfect tumor purity can lead to additional noise and lower detection sensitivity for correlations. However, varying tumor purity can significantly bias the results in the case of negative correlations, as low tumor purity can be caused by the presence of immune infiltrates and at the same time can lead to lower mutation and CNA detection sensitivity mimicking negative correlations between immune and genetic variables. Actually, negative correlations with CNA load and MATH were not only detected for immune cells but also for non-immunological cell types in the TME (endothelial cells and fibroblasts). However, two recent studies have shown that negative correlations of immunological activity with CNA load and MATH persisted even after correcting CNA and mutation data for tumor cell content.Citation28,Citation43 The result of negative correlations of immune infiltrates with MATH, here extended to other cancer types beyond breast cancer for the first time, could be explained by mechanisms of immune-editing, clone elimination and thus reduction of mutational diversity in immunological “hot” tumors as pointed out in.Citation43
Of note, some mutational signatures showed stronger correlation with immune cell populations than TMB in specific cancer types. Particularly signatures characterized by C > T and C > G mutations at TpCpN trinucleotides most likely caused by DNA editing induced by cytidine deaminases of the APOBEC familyCitation44 showed high positive correlation with immunological variables compared to all mutational signatures and global mutation measures. These data are in line with reports showing that beyond their ability to directly act on viral genomes, APOBEC-induced deamination can positively modulate immunological response.Citation45–Citation47 The role of the two APOBEC-related MutSigs 2 and 13 was cancer type specific: For example, while we detected many significant associations with both MutSigs in BRCA, much stronger associations were detected for MutSig 2 compared to MutSig 13 in CESC. Similar observations were made for cancers harboring mutational signatures associated with DNA repair deficiency including MSI and POLE-mutations where specific immune cell compositions were associated with each of these deficient repair pathways in a cancer-type specific manner.
In contrast, we noted a cancer type-specific (SKCM, STAT and BRCA) negative correlation of immune cell infiltrates and MutSig 1, which describes age-related mutations due to deamination. Of note, these C > T substitutions at NpCpG trinucleotides can cause classic druggable driver lesions, e.g. EGFR T790M or KRAS mutations. In addition, with rare exceptions pan-cancer analysis showed no significant positive correlations of immune cell patterns with MutSig 1. While further investigation is required to understand why MutSig 1 related mutated clones acquired over lifetime escape immune recognition and e.g. APOBEC-driven tumors display a ‘hot’ immune contexture, these data indicate that beyond the abundance of mutations (as measured by TMB), the quality of TMB, i.e. the composition of TMB by different mutational signatures, likely plays an important role for immunological response.
Explaining the different correlations we observed for different types of MutSigs we believe that, additionally to a possible contribution of the sequence composition, the mutational processes behind the signatures and the associated specific dynamics of mutation accumulation represent an important factor for immunogenicity. Specifically, as the average number of mutations per cell division is higher for fast mutational processes such as MutSig 6 (defective mismatch repair associated) and MutSig2 (APOBEC related) than for slow mutational processes such as MutSig 1 (clock-like process and accumulation of mutations during life time) adaption to evade the immune system might be more difficult when mutations are generated by the former processes. Therefore, MutSigs could help to read out otherwise hidden aspects of tumor evolution and to integrate these in therapy planning.
The correlation of immune cell population with mutations in specific genes was inhomogeneous with respect to different cancer types. For example, TP53 mutations correlated positively with immune cell infiltrates in BRCA, but negatively in HNSC and STAD. Immune cell infiltrates were higher in BRAF mutated THCA and SKCM compared to the corresponding wildtype tumors. In IDH1-mutated LGG immune cell infiltrates were lower than in wildtype LGG. In principle, the association of the immune infiltrations with the mutation status of specific genes can be explained in two ways: (i) the genetic status of prominent driver genes can be directly immunogenic and directly influence immune response and (ii) the immune cells contexture in mutated tumors is not primarily due to the immunogenicity of mutations in the specific gene, but rather a consequence of an immunologically different cancer subtype including the mutated genes under consideration, but also additional other molecular features. The high inhomogeneity we observed across cancer types is in favor of the latter explanation. Our results may have clinical implications as the mutational status of specific genes – in addition to TMB and PD-L1 expression – could provide complementary insight into the responsiveness of a given tumor to immune therapy.
In summary, while high TMB appeared to elicit a favorable immune cell response in many cancer types, CNA load and mutational subclonality (measured by MATH) tended to be associated with low immune cell infiltrates. Additionally and for the first time, our analysis developed a global picture of the impact of specific MutSigs on immune response in specific cancer types.Additional to TMB, MutSigs and specifically MutSigs associated with DNA repair deficiency as well as with AID/APOBEC gene activity, should be further investigated as predictors for immune therapy response.
Patients and methods
Study cohort and data preparation
Somatic mutation, copy number alteration (CNA) and gene expression data of 21 solid cancer types analyzed in the TCGA project were obtained from the cBioPortal (http://www.cbioportal.org). The TCGA data are freely available without restrictions on their use in publications (http://cancergenome.nih.gov/publications/publicationguidelines). Values of the following 26 genetic and 37 TME variables were determined for each of the tumors: TMB was calculated as total number of mutations including all non-synonymous mutations in the exonic regions and mutations at splice sites. The CNA Load was calculated as total number of genes with copy number gains or losses (GISTIC calls −2, −1, 1 or 2). MATH was calculated as quotient of median absolute deviation (mad) and median of the distribution of variant allele frequencies of the detected mutations as described before.Citation34 The levels of 23 specific mutational signatures were obtained from Alexandrov et al.Citation32 For the mutational status of specific genes, non-synonymous mutations in the exonic regions and mutations at splice sites were taken into account. The abundance of 30 specific immune and two non-immune cells types was estimated from RNAseq data using the bioinformatic methods MCP-counter and CIBERSORT.Citation37,Citation38 CIBERSORT was run in the mode of absolute quantification (method: sig score) that is integral part of the R code (available from: http://cibersort.stanford.edu), but different from the relative mode used in the original publication. Cytolytic Activity (CYT) of the local immune infiltrate was estimated as product of GZMA and PRF1 mRNA expression as described before.Citation27 Gene expression of PD-L1, PD-1, CTLA4 and IDO1 were obtained from the RNA-Seq data. Tumors were classified as POLE/POLD1 mutated when having missense mutations or in-frame indels in the proofreading domains (POLE codons 269–471 or POLD1 codons 304–517) or truncating mutations anywhere. The study cohort was comprised of 5722 tumors with the complete set of somatic mutation, mutational signature, RNA-Seq and CNA data available.
Statistical analysis and visualization
Correlation strengths of immune variables and genetic variables were quantified using Spearman’s rank correlation coefficient and assessed for significance as implemented by the cor.test function in the R package stats. Different levels of TME variables in tumors with mutated and wildtype status of specific genes as well as in hypermutated and non-hypermutated tumors were quantified using fold changes and assessed for significance by Welch’s t-test. A special kind of heatmap display was developed to analyze the huge amount of correlation information obtained from correlating immune variables with genetic variables in the entire pan-cancer cohort and specifically in each of the solid cancer types: First, out of the tree categories, immunology, genetics and topography/morphology (cancer type), one variable was fixed. Then, the variables of the remaining two categories were assigned to the x- and y-dimension of the heatmap. Hierarchical clustering of immune variables and genetic variables was performed using the levels in the pan-cancer cohort and Spearman correlations as similarity measure. As a consequence, immunological and genetic variables were ordered in each heatmap in the same way. Hierarchical clustering of cancer types was performed based on the correlation pattern displayed in the heatmap using Euclidean distance as dissimilarity measure. As a consequence, the ordering of cancer types was different in different heatmaps. For both kinds of clustering, the average linkage method was used to calculate distances between clusters. Multiple testing correction was performed specifically for the set of correlations analyses visualized in each of the heatmaps using the Benjamini-Hochberg method and significant (FDR< 5%) correlations were marked by crosses. Both, significances before (p-values) and after multiple testing (q-values) were reported.
Cancer types investigated in this study
Bladder Urothelial Carcinoma (BLCA), Breast invasive carcinoma (BRCA), Cervical squamous cell carcinoma and endocervical adenocarcinoma (CESC), Colorectal adenocarcinoma (COADREAD), Esophageal Carcinoma (ESCA), Glioblastoma multiforme (GBM), Head and Neck squamous cell carcinoma (HNSC), Kidney renal clear cell carcinoma (KIRC), Kidney Renal Papillary Cell Carcinoma (KIRP), Brain Lower Grade Glioma (LGG), Liver hepatocellular carcinoma (LIHC), Lung adenocarcinoma (LUAD), Lung squamous cell carcinoma (LUSC), Ovarian serous cystadenocarcinoma (OV), pancrea-tic adenocarcinoma (PAAD), Pheochromocytoma and Paraganglioma (PCPG), Prostate Adenocarcinoma (PRAD), Skin Cutaneous Melanoma (SKCM), Stomach adenocarcinoma (STAD), Papillary Thyroid Carcinoma (THCA), and Uterine Corpus Endometrial Carcinoma (UCEC).
Abbreviations
Disclosure of interest
The authors report no conflict of interest.
Supplemental Material
Download Zip (5.7 MB)Supplementary Material
Supplementary data for this article can be accessed here.
Additional information
Funding
Related Research Data
References
- Ribas A, Wolchok JD. Cancer immunotherapy using checkpoint blockade. Science. 2018;359(6382);1350–1355. doi:10.1126/science.aar4060.
- Pardoll DM. The blockade of immune checkpoints in cancer immunotherapy. Nat Rev Cancer. 2012;12(4);252–264. doi:10.1038/nrc3239.
- Vanpouille-Box C, Lhuillier C, Bezu L, Aranda F, Yamazaki T, Kepp O, Fucikova J, Spisek R, Demaria S, Formenti SC, et al. Trial watch: immune checkpoint blockers for cancer therapy. Oncoimmunology. 2017;6(11):e1373237. doi:10.1080/2162402X.2017.1373237.
- McDermott D, Lebbe C, Hodi FS, Maio M, Weber JS, Wolchok JD, Thompson JA, Balch CM. Durable benefit and the potential for long-term survival with immunotherapy in advanced melanoma. Cancer Treat Rev. 2014;40(9);1056–1064. doi:10.1016/j.ctrv.2014.06.012.
- Kroemer G, Galluzzi L. Combinatorial immunotherapy with checkpoint blockers solves the problem of metastatic melanoma-An exclamation sign with a question mark. Oncoimmunology. 2015;4(7);e1058037. doi:10.1080/2162402X.2015.1008371.
- Hellmann MD, Ciuleanu TE, Pluzanski A, Lee JS, Otterson GA, Audigier-Valette C, Minenza E, Linardou H, Burgers S, Salman P, et al. Nivolumab plus ipilimumab in lung cancer with a high tumor mutational burden. N Engl J Med. 2018. doi:10.1056/NEJMoa1801946.
- Gandhi L, Rodriguez-Abreu D, Gadgeel S, Esteban E, Felip E, de Angelis F, Domine M, Clingan P, Hochmair MJ, Powell SF, et al. Pembrolizumab plus chemotherapy in metastatic non-small-cell lung cancer. N Engl J Med. 2018. doi:10.1056/NEJMoa1801005.
- Nishino M, Ramaiya NH, Hatabu H, Hodi FS. Monitoring immune-checkpoint blockade: response evaluation and biomarker development. Nat Rev Clin Oncol. 2017;14(11);655–668. doi:10.1038/nrclinonc.2017.88.
- Rimm DL, Han G, Taube JM, Yi ES, Bridge JA, Flieder DB, Homer R, West WW, Wu H, Roden AC, et al. A prospective, multi-institutional, pathologist-based assessment of 4 immunohistochemistry assays for PD-L1 Expression in non-small cell lung cancer. JAMA Oncol. 2017;3(8):1051–1058. doi:10.1001/jamaoncol.2017.0013.
- Rosenberg JE, Hoffman-Censits J, Powles T, van der Heijden MS, Balar AV, Necchi A, Dawson N, O’Donnell PH, Balmanoukian A, Loriot Y, et al. Atezolizumab in patients with locally advanced and metastatic urothelial carcinoma who have progressed following treatment with platinum-based chemotherapy: a single-arm, multicentre, phase 2 trial. Lancet. 2016;387(10031):1909–1920. doi:10.1016/S0140-6736(16)00561-4.
- Chen DS, Mellman I. Elements of cancer immunity and the cancer-immune set point. Nature. 2017;541(7637);321–330. doi:10.1038/nature21349.
- Scheerens H, Malong A, Bassett K, Boyd Z, Gupta V, Harris J, Mesick C, Simnett S, Stevens H, Gilbert H, et al. Current status of companion and complementary diagnostics: strategic considerations for development and launch. Clin Transl Sci. 2017;10(2):84–92. doi:10.1111/cts.12455.
- Zaretsky JM, Garcia-Diaz A, Shin DS, Escuin-Ordinas H, Hugo W, Hu-Lieskovan S, Torrejon DY, Abril-Rodriguez G, Sandoval S, Barthly L, et al. Mutations associated with acquired resistance to PD-1 blockade in melanoma. N Engl J Med. 2016;375(9):819–829. doi:10.1056/NEJMoa1604958.
- Kato S, Kurzrock R. Genomics of immunotherapy-associated hyperprogressors-response. Clin Cancer Res. 2017;23(20);6376. doi:10.1158/1078-0432.CCR-17-1990.
- Jenkins RW, Barbie DA, Flaherty KT. Mechanisms of resistance to immune checkpoint inhibitors. Br J Cancer. 2018;118(1);9–16. doi:10.1038/bjc.2017.434.
- Budczies J, Bockmayr M, Klauschen F, Endris V, Frohling S, Schirmacher P, Denkert C, Stenzinger A. Mutation patterns in genes encoding interferon signaling and antigen presentation: A pan-cancer survey with implications for the use of immune checkpoint inhibitors. Genes Chromosomes Cancer. 2017;56(8);651–659. doi:10.1002/gcc.22468.
- Schumacher TN, Schreiber RD. Neoantigens in cancer immunotherapy. Science. 2015;348(6230);69–74. doi:10.1126/science.aaa4971.
- Bloy N, Garcia P, Laumont CM, Pitt JM, Sistigu A, Stoll G, Yamazaki T, Bonneil E, Buque A, Humeau J, et al. Immunogenic stress and death of cancer cells: contribution of antigenicity vs adjuvanticity to immunosurveillance. Immunol Rev. 2017;280(1):165–174. doi:10.1111/imr.12582.
- Rizvi NA, Hellmann MD, Snyder A, Kvistborg P, Makarov V, Havel JJ, Lee W, Yuan J, Wong P, Ho TS, et al. Cancer immunology. Mutational landscape determines sensitivity to PD-1 blockade in non-small cell lung cancer. Science. 2015;348(6230):124–128. doi:10.1126/science.aaa1348.
- Teo MY, Seier K, Ostrovnaya I, Regazzi AM, Kania BE, Moran MM, Cipolla CK, Bluth MJ, Chaim J, Al-Ahmadie H, et al. Alterations in DNA damage response and repair genes as potential marker of clinical benefit from PD-1/PD-L1 Blockade in advanced urothelial cancers. J Clin Oncol. 2018;36(17):1685–1694. doi:10.1200/JCO.2017.75.7740.
- Carbone DP, Reck M, Paz-Ares L, Creelan B, Horn L, Steins M, Felip E, van Den Heuvel MM, Ciuleanu TE, Badin F, et al. First-line nivolumab in stage IV or recurrent non-small-cell lung cancer. N Engl J Med. 2017;376(25):2415–2426. doi:10.1056/NEJMoa1613493.
- Chabanon RM, Pedrero M, Lefebvre C, Marabelle A, Soria JC, Postel-Vinay S. Mutational landscape and sensitivity to immune checkpoint blockers. Clin Cancer Res. 2016;22(17);4309–4321. doi:10.1158/1078-0432.CCR-16-0903.
- Le DT, Durham JN, Smith KN, Wang H, Bartlett BR, Aulakh LK, Lu S, Kemberling H, Wilt C, Luber BS, et al. Mismatch repair deficiency predicts response of solid tumors to PD-1 blockade. Science. 2017;357(6349):409–413. doi:10.1126/science.aan6733.
- Spranger S. Mechanisms of tumor escape in the context of the T-cell-inflamed and the non-T-cell-inflamed tumor microenvironment. Int Immunol. 2016;28(8);383–391. doi:10.1093/intimm/dxw014.
- Galon J, Fox BA, Bifulco CB, Masucci G, Rau T, Botti G, Marincola FM, Ciliberto G, Pages F, Ascierto PA, et al. Immunoscore and Immunoprofiling in cancer: an update from the melanoma and immunotherapy bridge 2015. J Transl Med. 2016;14:273. doi:10.1186/s12967-016-0867-z.
- Mlecnik B, Van Den Eynde M, Bindea G, Church SE, Vasaturo A, Fredriksen T, Lafontaine L, Haicheur N, Marliot F, Debetancourt D, et al. Comprehensive intrametastatic immune quantification and major impact of immunoscore on survival. J Natl Cancer Inst. 2018;110(1). doi:10.1093/jnci/djx216.
- Rooney MS, Shukla SA, Wu CJ, Getz G, Hacohen N. Molecular and genetic properties of tumors associated with local immune cytolytic activity. Cell. 2015;160(1–2);48–61. doi:10.1016/j.cell.2014.12.033.
- Davoli T, Uno H, Wooten EC, Elledge SJ. Tumor aneuploidy correlates with markers of immune evasion and with reduced response to immunotherapy. Science. 2017;355(6322). doi:10.1126/science.aaf8399.
- Iglesia MD, Parker JS, Hoadley KA, Serody JS, Perou CM, Vincent BG. Genomic analysis of immune cell infiltrates across 11 tumor types. J Natl Cancer Inst. 2016;108(11). doi:10.1093/jnci/djw144.
- Thorsson V, Gibbs DL, Brown SD, Wolf D, Bortone DS, Ou Yang TH, Porta-Pardo E, Gao GF, Plaisier CL, Eddy JA, et al. The immune landscape of cancer. Immunity. 2018;48(4):812–830. e814 doi:10.1016/j.immuni.2018.03.023.
- Alexandrov LB, Nik-Zainal S, Wedge DC, Aparicio SA, Behjati S, Biankin AV, Bignell GR, Bolli N, Borg A, Borresen-Dale AL, et al. Signatures of mutational processes in human cancer. Nature. 2013;500(7463):415–421. doi:10.1038/nature12477.
- Alexandrov LB, Jones PH, Wedge DC, Sale JE, Campbell PJ, Nik-Zainal S, Stratton MR. Clock-like mutational processes in human somatic cells. Nat Genet. 2015;47(12);1402–1407. doi:10.1038/ng.3441.
- Alexandrov LB, Ju YS, Haase K, Van Loo P, Martincorena I, Nik-Zainal S, Totoki Y, Fujimoto A, Nakagawa H, Shibata T, et al. Mutational signatures associated with tobacco smoking in human cancer. Science. 2016;354(6312):618–622. doi:10.1126/science.aag0299.
- Mroz EA, Rocco JW. MATH, a novel measure of intratumor genetic heterogeneity, is high in poor-outcome classes of head and neck squamous cell carcinoma. Oral Oncol. 2013;49(3);211–215. doi:10.1016/j.oraloncology.2012.09.007.
- Rocco JW. Mutant allele tumor heterogeneity (MATH) and head and neck squamous cell carcinoma. Head Neck Pathol. 2015;9(1);1–5. doi:10.1007/s12105-015-0617-1.
- Campbell BB, Light N, Fabrizio D, Zatzman M, Fuligni F, de Borja R, Davidson S, Edwards M, Elvin JA, Hodel KP, et al. Comprehensive analysis of hypermutation in human cancer. Cell. 2017;171(5):1042–1056. e1010 doi:10.1016/j.cell.2017.09.048.
- Becht E, Giraldo NA, Lacroix L, Buttard B, Elarouci N, Petitprez F, Selves J, Laurent-Puig P, Sautes-Fridman C, Fridman WH, et al. Estimating the population abundance of tissue-infiltrating immune and stromal cell populations using gene expression. Genome Biol. 2016;17(1):218. doi:10.1186/s13059-016-1070-5.
- Newman AM, Liu CL, Green MR, Gentles AJ, Feng W, Xu Y, Hoang CD, Diehn M, Alizadeh AA. Robust enumeration of cell subsets from tissue expression profiles. Nat Methods. 2015;12(5);453–457. doi:10.1038/nmeth.3337.
- Hellmann MD, Nathanson T, Rizvi H, Creelan BC, Sanchez-Vega F, Ahuja A, Ni A, Novik JB, Mangarin LMB, Abu-Akeel M, et al. Genomic features of response to combination immunotherapy in patients with advanced non-small-cell lung cancer. Cancer Cell. 2018;33(5):843–852. e844 doi:10.1016/j.ccell.2018.03.018.
- Patel SP, Kurzrock R. PD-L1 Expression as a predictive biomarker in cancer immunotherapy. Mol Cancer Ther. 2015;14(4);847–856. doi:10.1158/1535-7163.MCT-14-0983.
- Teixido C, Vilarino N, Reyes R, Reguart N. PD-L1 expression testing in non-small cell lung cancer. Ther Adv Med Oncol. 2018;10:1758835918763493. doi:10.1177/1758835918763493.
- McGranahan N, Furness AJ, Rosenthal R, Ramskov S, Lyngaa R, Saini SK, Jamal-Hanjani M, Wilson GA, Birkbak NJ, Hiley CT, et al. Clonal neoantigens elicit T cell immunoreactivity and sensitivity to immune checkpoint blockade. Science. 2016;351(6280):1463–1469. doi:10.1126/science.aaf1490.
- Karn T, Jiang T, Hatzis C, Sanger N, El-Balat A, Rody A, Holtrich U, Becker S, Bianchini G, Pusztai L. Association between genomic metrics and immune infiltration in triple-negative breast cancer. JAMA Oncol. 2017;3(12);1707–1711. doi:10.1001/jamaoncol.2017.2140.
- Venkatesan S, Rosenthal R, Kanu N, McGranahan N, Bartek J, Quezada SA, Hare J, Harris RS, Swanton C. Perspective: APOBEC mutagenesis in drug resistance and immune escape in HIV and cancer evolution. Ann Oncol. 2018;29(3);563–572. doi:10.1093/annonc/mdy003.
- Norman JM, Mashiba M, McNamara LA, Onafuwa-Nuga A, Chiari-Fort E, Shen W. Collins KL: The antiviral factor APOBEC3G enhances the recognition of HIV-infected primary T cells by natural killer cells. Nat Immunol. 2011;12(10);975–983. doi:10.1038/ni.2087.
- Casartelli N, Guivel-Benhassine F, Bouziat R, Brandler S, Schwartz O Moris A. The antiviral factor APOBEC3G improves CTL recognition of cultured HIV-infected T cells. J Exp Med. 2010;207(1);39–49. doi:10.1084/jem.20091933.
- Beck-Engeser GB, Winkelmann R, Wheeler ML, Shansab M, Yu P, Wunsche S, Walchhutter A, Metzner M, Vettermann C, Eilat D, et al. APOBEC3 enzymes restrict marginal zone B cells. Eur J Immunol. 2015;45(3):695–704. doi:10.1002/eji.201445218.