
ABSTRACT
Immune checkpoint blockade has greatly improved the clinical outcomes of many patients with metastatic melanoma, however, almost half do not respond. Whether the interspatial distribution of immune and tumor cells predicts response to anti-PD-1-based therapies and patient outcomes in any cancer, including melanoma, is currently unknown. Here, we examined the spatial distribution of immune and tumor cells via multiplex immunofluorescence. Pre-treatment melanoma specimens from 27 patients (n = 18 responders; n = 9 non-responders) treated with anti-PD-1 monotherapy and 34 patients (n = 22 responders; n = 12 non-responders) treated with combined ipilimumab and anti-PD-1 immunotherapy were studied. Responders displayed significantly higher densities of CD8+ tumor-infiltrating lymphocytes within a 20 µM distance from a melanoma cell compared to non-responders in both anti-PD-1 alone (p = .0024) and combination-treated patients (p = .0096), that were associated with improved progression-free survival for both therapies (anti-PD-1 p = .0158; combination therapy p = .0088). In multivariate analysis, the best model for 12-month progression-free survival for anti-PD-1 monotherapy included PD-L1+ cells within proximity to tumor cells and intratumoral CD8+ density (AUC = 0.80), and for combination therapy included CD8+ cells in proximity to tumor cells, intratumoral PD-L1+ density and LDH (AUC = 0.85). Assessment of the spatial distribution of immune cells in relation to tumor cells provides insight into their role in modulating immune response and highlights their potential role as predictors of response to anti-PD-1 based therapies.
Introduction
The immune checkpoint inhibitors anti-PD-1 and anti-CTLA-4 are the most effective treatment options for metastatic melanoma, with response rates ranging from 44% with anti-PD-1 monotherapy to 58% with the combination of anti-PD-1 and anti-CTLA-4.1 Such response rates are usually durable. While this is a major advance for many patients, there remains a large proportion of patients who do not respond. Biomarkers that predict response are required to direct those who will not respond to anti-PD-1 based therapies to alternate treatments.
There is substantial evidence supporting the importance of pre-treatment immune cell infiltration in eliciting anti-tumor responses with anti-PD-1/anti-CTLA-4 immunotherapy across cancer.Citation2 At present, the only approved biomarker of response to anti-PD-1 is immunohistochemical staining of the PD-1 ligand (PD-L1) in non-small cell lung cancer. In melanoma, studies have found the response rate for those positive for PD-L1 expression is higher compared to those with PD-L1 negative tumors, however, PD-L1 negative patients still respond (12–37%) and the assay is not predictive in the setting of combination anti-PD-1/anti-CTLA-4.Citation3,Citation4 Many studies have found a correlation between immune infiltrates and patient’s response using quantitative pathology, Citation2 with increased infiltrates of proliferating PD-1+/Ki67+ immune cells correlating with response to anti-PD-1 in a small number of patients (n = 15).Citation5 In addition, higher densities of regulatory T-cells (Tregs) have been associated with poor prognosis and response to immunotherapy.Citation6 However, tumor heterogeneity for PD-L1 expression is highCitation7 and many patients with high TILs and/or high PD-L1 expression fail to respond to immunotherapies.Citation8,Citation9 Consequently, there remains an urgent need to identify more robust biomarkers of response and resistance to immunotherapies.
The distribution of immune cells relative to each other as well as to tumor cells may influence not only melanoma disease progression, but also a response to immunotherapy. Several studies have demonstrated the association between the spatial distribution of immune cells and prognosis in various cancers.Citation10,Citation11 The distribution of T-cells in close proximity (≤10 µM) to the tumor periphery has been associated with improved overall survival in patients with liver metastases from colorectal cancer.Citation10 In non-small cell lung cancer, the intercellular interactions between tumor cells and regulatory T-cells (Tregs) were associated with poor survival, while the interaction between CD8 T-cells and Tregs correlated with improved survival.Citation11 However, the intercellular spatial distribution of immune cells and their association with survival and response to anti-PD-1-based immunotherapies have not yet been studied in detail.
In this study, we explored the spatial distribution of immune cells within the pre-treatment metastatic melanoma specimens from patients treated with anti-PD-1 monotherapy or combined anti-CTLA-4 and anti-PD-1 immunotherapy. Using highly quantitative multiplex immunofluorescence, the spatial distribution of immune and melanoma cells were quantified and correlated with clinicopathologic characteristics, response and progression-free survival.
Methods
Patient cohorts
A cohort of 27 patients (n = 18 responders; n = 9 non-responders) who were treated with anti-PD-1 monotherapy and 34 patients (n = 22 responders; n = 12 non-responders) treated with combined ipilimumab and anti-PD-1 immunotherapy with available baseline formalin-fixed, paraffin-embedded (FFPE) melanoma tissue were examined. Baseline biopsies taken prior to treatment with immunotherapies were used in this study and samples were acquired with written informed consent from all patients and the Melanoma Biospecimen Tissue Bank. This study was conducted in accordance with the Declaration of Helsinki, and with ethical approval from the Sydney Local Health District Human Research Ethics Committee (Protocol No. X15-0454 and HREC/11/RPAH/444). Patient response was determined using the RECIST 1.1 criteria.Citation12 Patients who achieved a complete response, partial response or stable disease of greater than 6 months were classified as responders, while patients with progressive disease or stable disease of less than or equal to 6 months before disease progression were categorized as non-responders, as previously described.Citation13
Multiplex immunofluorescence
Multiplex immunofluorescence was performed on baseline FFPE specimens, as previously described.Citation13 Briefly, 4µM FFPE sections were deparaffinized in xylene and subsequently run through graded ethanols. Antigen retrieval was performed using pH 9 buffer (Perkin Elmer) in a microwave, and then cooled on the bench in TBST before commencing staining using the DAKO Autostainer Plus. Slides were sequentially stained with the primary antibodies for PD-1 (Cell Marque, 1:500), FOXP3 (Abcam, 1:2000), SOX10 (Biocare Medical, 1:800), PD-L1 (Cell Signaling Technology, 1:2000), and CD8 (Sigma-Aldrich, 1:500). Antibodies were detected using the MACH3 HRP-Polymer detection kits, and visualized using the Opal TSA fluorophores (Perkin Elmer; 1:50). Following all stains, sections were counterstained with DAPI and slides were coverslipped using the VectaShield Hardset mounting media.
Image analysis
Slides were imaged using the Vectra 3.0 slide scanner and visualized in Phenochart whole slide viewer (Perkin Elmer). Twenty multispectral images per each tumor biopsy were acquired using the 20X objective (200X absolute magnification), with core biopsies, and specimens with less than 20 fields of view or a peritumoral area of less than 350,000 µm2 excluded from the analyses (n = 24/85). Image analysis was performed using the Inform quantitative pathology software (Perkin Elmer) to identify cells, their spatial location and the expression of the above markers on a cell by cell basis. Cell phenotypes were assigned using the quantitative pathology module of TIBCO® Spotfire® 6.0.0 software.
Spatial distribution analysis
Spatial distribution analysis was performed on the cell segmentation data in the R environment. Distances between immune cell phenotypes (T-cells (CD8+), Tregs (FOXP3+), PD-1+ and PD-L1 (PD-L1+/SOX10−) immune cells) and tumor cells (SOX10+) were calculated using the Phenoptr R package, as previously described.Citation14 Briefly, the nearest-neighbor analysis function was used to compute the distance of each individual cell to the nearest cell for each of the above predefined phenotypes in the merged dataset produced via inForm. The subsequent cell phenotype and intracellular spatial location file with the newly added cell-to-cell distances was then used to calculate the median distances between cells, and the number of cells within 20 µM intervals of each phenotype using TIBCO® Spotfire® 6.0.0. Immune cells within 20 µM of a melanoma cell were quantified as densities to take into account the intratumoral and peritumoral tissue areas, and reported as cells per mm2. The 20 µM intervals were selected to build upon prior work in the field and to account for the larger cell size of the melanoma cells.Citation15
Statistical analysis
Kaplan-Meier log-rank analyses were performed using Graphpad Prism 7.0 to determine associations between cell-to-cell distances, and progression-free and overall survival. The optimal cutoffs for Kaplan-Meier analyses were determined using Cutoff Finder.Citation16 A univariate Cox proportional hazards (Cox PH) model was used to assess the association of each of the factors (number of intratumoral immune cells with 20 µM of a SOX10+ melanoma cell) with progression-free survival. Factors for which the hazard ratios were statistically significant at the level of significance 0.2 were then included in a multivariate Cox PH model performed using SAS. In order to eliminate factors that do not impact progression-free survival, the final regression model was determined using the backward elimination technique which included only those variables with statistically significant hazard ratios at the level of 5% (P ˂ 0.05). Receiver operating characteristic (ROC) curve analyses were performed using R. All other statistical analyses were performed using Graphpad Prism 7.0. These involved the Mann–Whitney U test and one-way ANOVA. A P value of less than 0.05 was considered statistically significant.
Results
Patient characteristics
This study included baseline FFPE melanoma samples from 27 metastatic melanoma patients treated with anti-PD-1 monotherapy and 34 patients treated with combination anti-PD-1 and anti-CTLA-4 immunotherapy. Patients were classified as responders and non-responders, as previously described.Citation13 The median age of the anti-PD-1 monotherapy cohort was 67 y, with elevated LDH in 44% of patients and BRAF mutation in 26% (). Median progression-free survival for the anti-PD-1 monotherapy cohort was 19.4 months (ranging from 0.3 to 52.7 months) and median overall survival was 28.9 months (ranging from 1.9 to 52.7 months). There was no significant association between response and patient sex, LDH, BRAF mutation status, drug type, or M stageCitation17 ().
Table 1. Clinicopathologic characteristics of the anti-PD-1 monotherapy cohort
In the combination therapy cohort, the median age was 57 y, with elevated LDH and BRAF mutation in 26% and 47% of the cohort, respectively (). There was a significant association between LDH and response (P = .04), with elevated LDH in 14% of responders and 50% of non-responders. There was no significant correlation between response and patient sex, BRAF mutation, or type of drug therapy. Median progression-free and overall survival were not yet reached for the combination therapy cohort ().
Table 2. Clinicopathologic characteristics of the combination anti-PD-1 and anti-CTLA-4 immunotherapy cohort
Median distance between immune and tumor cells does not correlate with response
We calculated the shortest distance from each immune cell phenotype to the nearest melanoma cell in the intratumoral and peritumoral regions. The median distance of the immune cell phenotypes to the nearest melanoma cell displayed very little variability across the entire study, particularly in the intratumoral region, with a median of less than 8µM for the majority of phenotypes and both response groups. No significant differences were observed between responders and non-responders in the median distance of immune cells to the nearest SOX10+ tumor cell in either the anti-PD-1 monotherapy (Supplementary Figure 1(a)), or the combination treatment cohort (Supplementary Figure 1(b)). However, this analysis did not account for differences in the numbers of immune cells in proximity to the tumor cells () and ).
Figure 1. Spatial profiling of responders and non-responders treated with anti-PD-1 monotherapy. (a) Representative multiplex immunofluorescent images of intratumoral and peritumoral regions stained with CD8, FOXP3, PD-1, PD-L1, SOX10 and DAPI, from a responder and non-responder to anti-PD-1 alone. (b) Scatter plots illustrating the number of CD8+ immune cells within proximity to a melanoma cell at 20 µM intervals, in a single representative image from a responding and non-responding patient. (c) Bar graphs showing the differences in the number of intratumoral and peritumoral CD8+ cells within proximity to a SOX10+ melanoma cell between responders and non-responders at 20 µM intervals. (d) Box plots comparing the number of immune cells within 20 µM of a SOX10+ tumor cell in responders and non-responders. Error bars represent SD
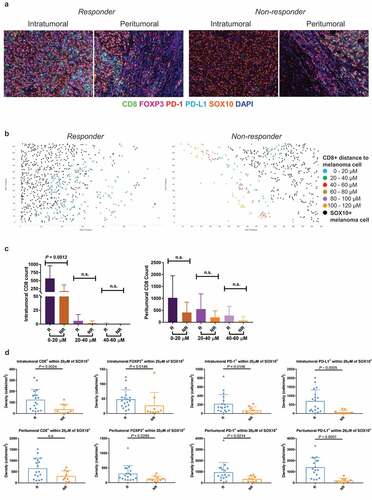
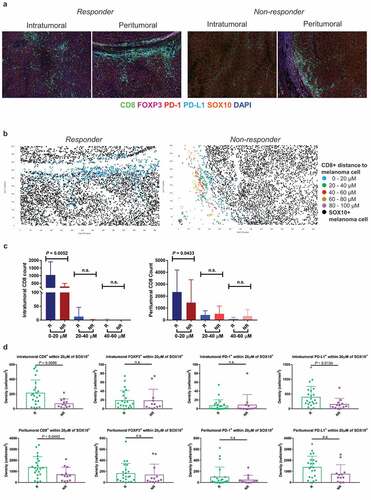
Figure 2. Spatial profiling of responders and non-responders treated with combination therapy. (a) Representative multiplex immunofluorescent images of intratumoral and peritumoral regions stained with CD8, FOXP3, PD-1, PD-L1, SOX10 and DAPI, from a responder and non-responder to combination anti-PD-1 and anti-CTLA-4 immunotherapy. (b) Scatter plots illustrating the number of CD8+ immune cells within proximity to a melanoma cell at 20 µM intervals, in a single representative image from a responding and non-responding patient. (c) Bar graphs showing the differences in the number of intratumoral and peritumoral CD8+ cells within proximity to a SOX10+ melanoma cell between responders and non-responders at 20 µM intervals. (d) Box plots comparing the number of immune cells within 20 µM of a SOX10+ tumor cell in responders and non-responders. Error bars represent SD
Density of immune cells within 20 µm of a melanoma cell is significantly associated with response
We therefore investigated whether the density of immune cells within a specific distance to a SOX10+ melanoma cell would differ between responders and non-responders to anti-PD-1 based immunotherapies. The number of immune cells within each phenotype was calculated at 20 µM intervals from the nearest melanoma cell () and ). To determine which distance showed the greatest differences between responders and non-responders, the number of CD8+ T cells in proximity to a melanoma cell was compared between the two groups at each 20 µM interval. A significant difference in the number of CD8+ T cells was observed only at the 0–20 µM distance from a melanoma cell for both the monotherapy ()) and combination therapy ()) cohorts. Therefore, this distance was selected for further analysis.
In the anti-PD-1 monotherapy cohort, responders displayed significantly higher densities of intratumoral immune cells (CD8+, FOXP3+, PD-1+ and PD-L1+) within 20 µM of a SOX10+ tumor cell compared to non-responders ()). In the peritumoral regions, significantly higher densities of FOXP3+, PD-1+ and PD-L1+ cells were observed in responders compared to non-responders. There was no significant difference in CD8+ T-cell density within 20 µM of a melanoma cell between responders and non-responders ()).
In the combination therapy cohort, the intratumoral CD8+ T-cell density and PD-L1+ density within 20 µM of a melanoma cell was significantly higher in responders compared to non-responders (P = .0096 and P = .0134, respectively; )). Furthermore, responders displayed a significantly higher density of peritumoral CD8+ T cells within this same distance compared to non-responding patients (P = .0443; )).
We investigated the relationship between the numbers of intratumoral CD8+ T cells within 20 µM of a melanoma cell in the various sites of melanoma metastases for both treatments (Supplementary Figure 1(c)). The highest counts were observed in visceral sites (n = 3 lung, n = 1 brain, n = 1 bowel, and n = 1 abdomen; mean = 147.5, SD = 128.8), followed by lymph mode metastases (n = 18, mean = 144, SD = 118.2) and subcutaneous metastases (n = 37, mean = 129.4, SD = 148.7). Similar trends were observed in the peritumoral regions, however there was no significant difference between the CD8+ densities at different biopsy sites in both the intratumoral and peritumoral regions (Supplementary Figure 1(c)).
Density of immune cells within 20 µm of a melanoma cell is associated with progression-free survival
In univariate analyses, higher densities of intratumoral CD8+, FOXP3+, PD-1+, PD-L1+, CD8+FOXP3+ and CD8+PD-1+ cells within the 20 µM distance to SOX10+ melanoma cells in anti-PD-1 monotherapy patients were significantly associated with longer progression-free survival () and ). Factors for which the hazard ratios were statistically significant (P ≤ 0.2) were then included in a multivariate Cox PH model. Final multivariate analyses using the backward elimination technique revealed that a higher density of total CD8+ cells, and higher density of PD-L1+ cells within 20 µM of a melanoma cell were associated with significantly longer progression-free survival (P = .0877, HR = 0.40, 95% CI = 0.14, 1.14, and P = .0145, HR = 0.26, 95% CI = 0.09, 0.76, respectively; ).
Table 3. Univariate and multivariate Cox regression analysis for progression-free survival in anti-PD-1 monotherapy
Figure 3. Spatial distribution of immune cells correlates with progression-free survival in anti-PD-1 based therapies. (a) Kaplan–Meier curves demonstrating significantly longer progression-free survival in anti-PD-1 monotherapy treated patients with numbers of immune cells within 20 µM of a melanoma cell that are above the cutoff. (b) Kaplan–Meier curves demonstrating significantly longer progression-free survival in combination-treated patients with numbers of immune cells within 20 µM of a melanoma cell that are above the cutoff. (c) ROC curves demonstrating the area under the curve for the final regression model for 12 months progression-free survival with anti-PD-1 monotherapy, including factors remaining significant following multivariate analysis (d) ROC curves demonstrating the area under the curve for the final regression model for 12 months progression-free survival with combination therapy, including factors remaining significant following multivariate analysis
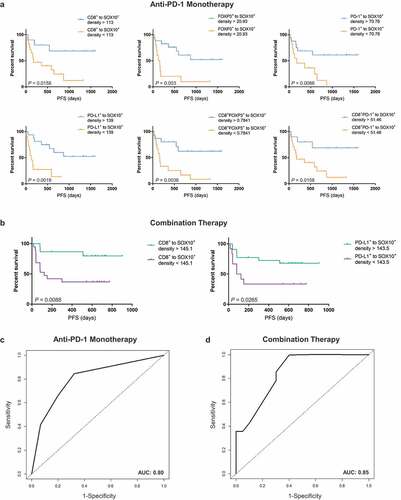
In univariate analyses for the combined immunotherapy cohort, higher densities of intratumoral CD8+ and PD-L1+ cells within 20 µM of SOX10+ cells were associated with longer progression-free survival (P = .0088 and P = .0265, respectively; )). Furthermore, elevated baseline LDH levels were associated with significantly shorter progression-free survival (P = .0015, HR = 5.44, 95% CI = 1.91, 15.51; ). In the final multivariate analyses using the backward elimination technique, a higher density of total PD-L1+ cells (P = .1295, HR = 0.37, 95% CI = 0.10, 1.34; ), a higher density of CD8+ cells within 20 µM of a melanoma cell (P = .0329, HR = 0.24, 95% CI = 0.07, 0.89), and normal LDH (P = .0027, HR = 5.47, 95% CI = 1.81, 16.56) were associated with longer progression-free survival.
Table 4. Univariate and multivariate Cox regression analysis for progression-free survival in combination therapy
ROC curve analysis for the multivariate regression models identified via the backward elimination method revealed an area under the curve (AUC) of 0.80 for 12 months progression-free survival in anti-PD-1 monotherapy ()), and an AUC of 0.85 for 12 months progression-free survival in combination anti-PD-1 and anti-CTLA-4 immunotherapy ()).
Discussion
As far as we are aware, this is the first study in any cancer that has used precise quantitation of the spatial distribution of tumor and immune cells to predict response in patients treated with combination immunotherapy. We investigated the spatial profiles of immune and melanoma cells in tumor biopsies from patients with metastatic melanoma treated with anti-PD-1 monotherapy or the combination anti-CTLA-4 and anti-PD-1 immunotherapy. Our study revealed that while there was no association between response to anti-PD-1 based immunotherapies and the median distance between immune and SOX10+ melanoma cells, the densities of immune cells within 20 µM of a melanoma cell significantly correlated with response and progression-free survival. Finally, regression models associated with progression-free survival combining these immune factors with clinical parameters were established. These findings have implications for the selection and treatment of patients with metastatic melanoma using anti-PD-1 based therapies.
The application of the quantitative multiplex immunofluorescence platform has become increasingly useful for the performance of spatial distribution analysis of immune and tumor cells in various cancers, including breast cancer, pancreatic cancer, and colorectal cancer.Citation10,Citation15,Citation18 The densities of PD-1+ and PD-L1+ expressing cells in the tumor microenvironment positively correlated with response to anti-PD-1 monotherapy in patients with Merkel cell carcinoma.Citation19 In metastatic melanoma, patients expressing high PD-1/PD-L1 demonstrated significantly improved progression-free survival and overall survival, and were more likely to respond to anti-PD-1 monotherapy.Citation20
In the current study, we demonstrated significant associations between the densities of different immune cell populations within 20 µM of a melanoma cell, and response to anti-PD-1 based immunotherapies. Furthermore, these numbers were significantly associated with progression-free survival. The spatial interactions between immune and tumor cells greatly impact the overall tumor ecosystem and have significant influence over the development of metastases and therapy response.Citation21,Citation22 In pancreatic cancer, the infiltration of specific T-cell subpopulations, and the levels of cytotoxic T-cells within a 20 µM radius of a cancer cell was significantly correlated with improved patient survival.Citation15 These findings suggest that, in addition to densities of various immune cell populations, it is also critical to consider the geographical locations of these immune cells in relation to tumor cells when determining the most appropriate form of therapy for melanoma (and other cancer) patients.
Our study revealed a regression model associated with progression-free survival in anti-PD-1 monotherapy, which included the density of PD-L1+ cells within 20 µM of a melanoma cell and the total CD8+ density, and was independent of the clinical factors LDH and M stage. This is in line with a recent study showing that PD-L1+ expression on both melanoma cells and macrophages correlated with significantly higher levels of intratumoral CD8+ cells, but not with intratumoral CD4+ Tregs.Citation23 Importantly, a comparison of the hazard ratios and P values between the two factors in our final multivariate model showed that the density of PD-L1+ cells within proximity to a melanoma cell had a greater impact on outcome compared to CD8+ density alone. Additionally, the type, density and location of immune cells were found to have better prognostic values for disease-free and overall survival compared to standard histopathologic classifications in colorectal cancer.Citation24
In the current study, we also demonstrated a model for progression-free survival in combination treatment, including the number of intratumoral CD8+ cells within 20 µM of a melanoma cell, PD-L1+ density and LDH. Similar to the monotherapy cohort, a comparison of the hazard ratios and P values between these factors revealed that the spatial distribution of CD8+ cells in relation to melanoma cells has a greater impact on outcome compared to PD-L1+ density alone. Spatial distribution analysis in primary melanomas revealed that the diffuse localization of CD8+ T cells was associated with significantly longer melanoma-specific survival and disease-free survival, compared to the marginal localization of CD8+ cells.Citation25 Furthermore, baseline LDH was significantly associated with an impaired overall survival in metastatic melanoma patients treated with combination anti-CTLA-4 and anti-PD-1.Citation1,Citation26,Citation27 These findings highlight the need for assessment of immune parameters along with clinical and histopathologic factors for the administration of personalized therapies for patients with metastatic melanoma.
One of the limitations of this study is the small sample size for each treatment cohort, particularly of the non-responding patients. The requirement for a total of 20 fields of view per sample, including both intratumoral and peritumoral tissue regions, limited the use of core biopsies as well as other samples lacking sufficient peritumoral tissue, hence reducing the number of samples included in the study. Future studies are required to investigate the accuracy of spatial immune-tumor locations in small melanoma biopsies, such as core biopsies, in predicting patient response to immunotherapies. Due to the small cohort sizes only two clinical factors, LDH and M stage, were included in the multivariate Cox regression analyses. In addition, due to the limited sample size, patients were grouped into two categories, responders versus non-responders, where the latter also included patients with stable disease of less than 6-months duration, which might be biologically distinct from the non-responding patients with progressive disease. Thus, it will be necessary to validate our findings in a larger independent cohort, and to include other clinical variables in the multivariate analysis.
Furthermore, our study utilized SOX10 as a melanoma marker to calculate the spatial distances of the immune cell populations to melanoma cells. While the melanoma cells in our study were all homogenously positive for SOX10, it has been shown that de-differentiation in melanomas is linked to loss of SOX10 during treatment with small molecule BRAF inhibitorsCitation28 and de-differentiation has been associated with immunotherapy resistance.29 Therefore, heterogeneous melanoma expression of SOX10 should be considered when applying the techniques outlined in this study, particularly during treatment with targeted or immunotherapies.
In conclusion, our study investigating the spatial profiles of metastatic melanoma patients reveals the importance of the density of immune cells in close proximity to melanoma cells in determining response to anti-PD-1 immunotherapies. Furthermore, we establish regression models for progression-free survival including the intratumoral cell-to-cell distances and clinical factors for each form of immunotherapy. Our findings suggest that the quantitative spatial profiling of immune markers via multiplex immunofluorescence could be a useful tool for treatment selection and add to the current ongoing investigations seeking to determine the most accurate biomarkers for single-agent or combination immunotherapy in melanoma patients.
Disclosure of potential conflicts of interest
G.V.L. receives consultant advisor fees from Aduro, BMS, Array, Pierre Fabre, Novartis, MSD, and Roche, outside the submitted work. A.M.M. is on the advisory board of BMS, Merck (MSD), Novartis, Roche, and Pierre Fabre. M.S.C. is an advisory board member for MSD, BMS, Novartis and Amgen. J.F.T has participated in advisory boards for Provectus, MSD, GlaxoSmithKline and BMS. R.P.M.S receives honoraria for advisory boards for Novartis and MSD. All remaining authors declare no conflicts of interest.
Supplemental Material
Download ()Acknowledgments
This work was supported by Melanoma Institute Australia, the New South Wales Department of Health, NSW Health Pathology, National Health and Medical Research Council of Australia (NHMRC) and Cancer Institute NSW. This research was also supported through funding by Ray and Penni Jones. G.V.L., J.S.W. and R.A.S. are supported by NHMRC Fellowships. J.F.T and G.V.L. are supported by the Melanoma Foundation of the University of Sydney through the University of Sydney Medical Foundation. T.N.G. is supported by the University of Sydney and the Janet Ferguson MIA PhD Scholarship. A.M.M. is supported by a Cancer Institute NSW Fellowship.
Supplementary material
Supplemental data for this article can be accessed on the publisher’s website.
References
- Wolchok JD, Chiarion-Sileni V, Gonzalez R, Rutkowski P, Grob -J-J, Cowey CL, Lao CD, Wagstaff J, Schadendorf D, Ferrucci PF, et al. Overall survival with combined nivolumab and ipilimumab in advanced melanoma. New Engl J Med. 2017;377:1345–11. doi:10.1056/NEJMoa1709684.
- Vilain RE, Menzies AM, Wilmott JS, Kakavand H, Madore J, Guminski A, Liniker E, Kong BY, Cooper AJ, Howle JR, et al. Dynamic changes in PD-L1 expression and immune infiltrates early during treatment predict response to PD-1 blockade in melanoma. Clin Cancer Res. 2017;23:5024–5033. doi:10.1158/1078-0432.CCR-16-0698.
- Gandini S, Massi D, Mandala M. PD-L1 expression in cancer patients receiving anti PD-1/PD-L1 antibodies: A systematic review and meta-analysis. Crit Rev Oncol Hematol. 2016;100:88–98. doi:10.1016/j.critrevonc.2016.02.001.
- Carlino MS, Long GV, Schadendorf D, Robert C, Ribas A, Richtig E, Nyakas M, Caglevic C, Tarhini A, Blank C, et al. Outcomes by line of therapy and programmed death ligand 1 expression in patients with advanced melanoma treated with pembrolizumab or ipilimumab in KEYNOTE-006: A randomised clinical trial. Eur J Cancer. 2018;101:236–243. doi:10.1016/j.ejca.2018.06.034.
- Tumeh PC, Harview CL, Yearley JH, Shintaku IP, Taylor EJ, Robert L, Chmielowski B, Spasic M, Henry G, Ciobanu V, et al. PD-1 blockade induces responses by inhibiting adaptive immune resistance. Nature. 2014;515:568–571. doi:10.1038/nature13954.
- Simeone E, Gentilcore G, Giannarelli D, Grimaldi AM, Caracò C, Curvietto M, Esposito A, Paone M, Palla M, Cavalcanti E, et al. Immunological and biological changes during ipilimumab treatment and their potential correlation with clinical response and survival in patients with advanced melanoma. Cancer Immunol Immunother. 2014;63:675–683. doi:10.1007/s00262-014-1545-8.
- Madore J, Vilain RE, Menzies AM, Kakavand H, Wilmott JS, Hyman J, Yearley JH, Kefford RF, Thompson JF, Long GV, et al. PD-L1 expression in melanoma shows marked heterogeneity within and between patients: implications for anti-PD-1/PD-L1 clinical trials. Pigm. Cell Melanoma Res. 2015;28:245–253. doi:10.1111/pcmr.12340.
- Robert C, Long GV, Brady B, Dutriaux C, Maio M, Mortier L, Hassel JC, Rutkowski P, Mcneil C, Kalinka-Warzocha E, et al. Nivolumab in Previously untreated melanoma without BRAF mutation. New Engl J Med. 2015;372:320–330. doi:10.1056/NEJMoa1412082.
- Carlino M, Ribas A, Gonzalez R, Hoeller C, Bar-Sela G, Barrow C, Chao D, Wolter P, Berking C, Straume O, Abstract CT004: KEYNOTE-006: PD-L1 expression and efficacy in patients (Pts) treated with pembrolizumab (pembro) vs ipilimumab (IPI) for advanced melanoma. Cancer Res. 2016;76:CT004–CT004.
- Berthel A, Zoernig I, Valous NA, Kahlert C, Klupp F, Ulrich A, Weitz J, Jaeger D, Halama N. Detailed resolution analysis reveals spatial T cell heterogeneity in the invasive margin of colorectal cancer liver metastases associated with improved survival. Oncol Immunol. 2017;6:e1286436. doi:10.1080/2162402X.2017.1286436.
- Barua S, Fang P, Sharma A, Fujimoto J, Wistuba I, Rao AUK, Lin SH. Spatial interaction of tumor cells and regulatory T cells correlates with survival in non-small cell lung cancer. Lung Cancer. 2018;117:73–79. doi:10.1016/j.lungcan.2018.01.022.
- Eisenhauer EA, Therasse P, Bogaerts J, Schwartz LH, Sargent D, Ford R, Dancey J, Arbuck S, Gwyther S, Mooney M, et al. New response evaluation criteria in solid tumours: revised RECIST guideline (version 1.1). Eur J Cancer. 2009;45:228–247. doi:10.1016/j.ejca.2008.10.026.
- Gide TN, Quek C, Menzies AM, Tasker AT, Shang P, Holst J, Madore J, Lim SY, Velickovic R, Wongchenko M, et al. Distinct immune cell populations define response to anti-PD-1 monotherapy and anti-PD-1/Anti-CTLA-4 combined therapy. Cancer Cell. 2019;35:238–255.e6. doi:10.1016/j.ccell.2019.01.003.
- Johnson KS (2018). phenoptr: inForm helper functions. R package version 0.1.3.
- Carstens JL, Correa De Sampaio P, Yang D, Barua S, Wang H, Rao A, Allison JP, Lebleu VS, Kalluri R. Spatial computation of intratumoral T cells correlates with survival of patients with pancreatic cancer. Nat Commun. 2017;8:15095. doi:10.1038/ncomms15095.
- Budczies J, Klauschen F, Sinn BV, Gyorffy B, Schmitt WD, Darb-Esfahani S, Denkert C. Cutoff finder: a comprehensive and straightforward web application enabling rapid biomarker cutoff optimization. PLoS One. 2012;7:e51862. doi:10.1371/journal.pone.0051862.
- Gershenwald JE, Scolyer RA, Hess KR, Sondak VK, Long GV, Ross MI, Lazar AJ, Faries MB, Kirkwood JM, Mcarthur GA, et al. Melanoma staging: evidence-based changes in the American joint committee on cancer eighth edition cancer staging manual. CA Cancer J. Clin. 2017;67:472–492. doi:10.3322/caac.21409.
- Mani NL, Schalper KA, Hatzis C, Saglam O, Tavassoli F, Butler M, Chagpar AB, Pusztai L, Rimm DL. Quantitative assessment of the spatial heterogeneity of tumor-infiltrating lymphocytes in breast cancer. Breast Cancer Res. 2016;18:78. doi:10.1186/s13058-016-0737-x.
- Giraldo NA, Nguyen P, Engle EL, Kaunitz GJ, Cottrell TR, Berry S, Green B, Soni A, Cuda JD, Stein JE, et al. Multidimensional, quantitative assessment of PD-1/PD-L1 expression in patients with merkel cell carcinoma and association with response to pembrolizumab. J Immunother Cancer. 2018;6:99. doi:10.1186/s40425-018-0404-0.
- Johnson DB, Bordeaux J, Kim JY, Vaupel C, Rimm DL, Ho TH, Joseph RW, Daud AI, Conry RM, Gaughan EM, et al. Quantitative spatial profiling of PD-1/PD-L1 Interaction and HLA-DR/IDO-1 predicts improved outcomes of anti-PD-1 therapies in metastatic melanoma. Clin Cancer Res. 2018;24:5250–5260. doi:10.1158/1078-0432.CCR-18-0309.
- Greaves M, Maley CC. Clonal evolution in cancer. Nature. 2012;481:306–313. doi:10.1038/nature10762.
- Fridman WH, Pages F, Sautes-Fridman C, Galon J. The immune contexture in human tumours: impact on clinical outcome. Nat Rev Cancer. 2012;12:298–306. doi:10.1038/nrc3245.
- Halse H, Colebatch AJ, Petrone P, Henderson MA, Mills JK, Snow H, Westwood JA, Sandhu S, Raleigh JM, Behren A, et al. Multiplex immunohistochemistry accurately defines the immune context of metastatic melanoma. Sci Rep. 2018;8:11158. doi:10.1038/s41598-018-28944-3.
- Galon J, Costes A, Sanchez-Cabo F, Kirilovsky A, Mlecnik B, Lagorce-Pagès C, Tosolini M, Camus M, Berger A, Wind P, et al. Type, density, and location of immune cells within human colorectal tumors predict clinical outcome. Science. 2006;313:1960–1964. doi:10.1126/science.1129139.
- Donizy P, Biecek P, Kaczorowski M, Halon A, Maciejczyk A, Matkowski R. Contrary effect of two types of spatial distribution (diffuse versus marginal) of CD8-positive lymphocytes on clinical outcome in melanoma patients. Int J Clin Exp Pathol. 2016;9:8415–8423.
- Wagner NB, Forschner A, Leiter U, Garbe C, Eigentler TK. S100B and LDH as early prognostic markers for response and overall survival in melanoma patients treated with anti-PD-1 or combined anti-PD-1 plus anti-CTLA-4 antibodies. Br J Cancer. 2018;119:339–346. doi:10.1038/s41416-018-0167-x.
- Larkin J, Chiarion-Sileni V, Gonzalez R, Grob JJ, Cowey CL, Lao CD, Schadendorf D, Dummer R, Smylie M, Rutkowski P, et al. Combined nivolumab and ipilimumab or monotherapy in untreated melanoma. New Engl J Med. 2015;373:23–34. doi:10.1056/NEJMoa1504030.
- Tsoi J, Robert L, Paraiso K, Galvan C, Sheu KM, Lay J, Wong DJL, Atefi M, Shirazi R, Wang X, et al. Multi-stage differentiation defines melanoma subtypes with differential vulnerability to drug-induced iron-dependent oxidative stress. Cancer Cell. 2018;33:890–904.e5. doi:10.1016/j.ccell.2018.03.017.
- Yin C, Zhu B, Zhang T, Liu T, Chen S, Liu Y, Li X, Miao X, Li S, Mi X, et al. Pharmacological targeting of STK19 inhibits oncogenic NRAS-driven melanomagenesis. Cell. 2019;176:1113–1127.e16. doi:10.1016/j.cell.2019.01.002.