
ABSTRACT
Although anti-programmed death-1 (PD-1) treatment has shown remarkable anti-tumor efficacy, immune-related adverse events (irAEs) develop with heterogeneous clinical manifestations. However, the immunological understanding of irAEs is currently limited. In the present study, we analyzed peripheral blood T cells obtained from cancer patients who received anti-PD-1 treatment to determine the immunological characteristics of irAEs. This study included 31 patients with refractory thymic epithelial tumor (TET) who were enrolled in a phase II trial of pembrolizumab (NCT02607631) and 60 patients with metastatic non-small cell lung cancer (NSCLC) who received pembrolizumab or nivolumab. T-cell profiling was performed by multicolor flow cytometry using peripheral blood obtained before treatment and 7 days after the first dose of anti-PD-1 antibodies. irAEs developed in 21 TET patients and 24 NSCLC patients. Severe (≥ grade 3) irAEs occurred in 7 TET patients (22.6%) and 6 NSCLC patients (10.0%). Patients with severe irAEs exhibited a significantly lower fold increase in the frequency of effector regulatory T (eTreg) cells after anti-PD-1 treatment, a higher ratio of T helper-17 (Th17) and T helper-1 cells at baseline, and a higher percentage of Ki-67+ cells among PD-1+CD8+ T cells posttreatment. In clustering analysis using the T-cell parameters, patients with irAEs were grouped into four distinct subtypes: Th17-related, TNF-related, CD8-related Treg-compensated, and CD8-related Treg-uncompensated. The T-cell parameters showed a predictive value for the development of each subtype of severe irAEs. In conclusion, severe irAEs after anti-PD-1 treatment were clustered into four immunological subtypes, and potential biomarkers for early prediction of severe irAEs were proposed.
Immune checkpoint inhibitors (ICIs) have shown remarkable clinical benefit in patients with various types of cancer.Citation1,Citation2 ICIs increase the activity of the immune system by blocking inhibitory signals of T-cell activation. Inhibitory immune checkpoint receptors, such as programmed death-1 (PD-1) and cytotoxic T lymphocyte antigen-4 (CTLA-4), serve important regulatory roles in self-tolerance. Therefore, ICIs can facilitate autoimmune and inflammatory responses.Citation3,Citation4
Anti-PD-1-treated patients may develop diverse forms of immune-related adverse events (irAEs). IrAEs commonly present as colitis, hepatitis, pneumonitis, endocrinopathies, arthritis, rash, pruritis, and fever, but may uncommonly involve the heart, kidney, and nervous system.Citation3,Citation4 Autoantibodies,Citation5,Citation6 tissue-infiltrating T cells,Citation7 cytokines,Citation8 early changes in B cells,Citation9 and the microbiomeCitation10 have been proposed to be associated with irAEs, but the underlying pathophysiology of irAEs has not been fully elucidated. Such a broad spectrum of clinical presentation and associated factors suggests that irAEs are not caused by a single mechanism, but by heterogeneous mechanisms.
Most patients recover from irAEs with corticosteroids or immunosuppressive drugs, but severe cases can lead to treatment discontinuation, and even mortality.Citation4 For fatal cases, early detection and intervention are important for a proper management. However, clinically available biomarkers predicting severe irAEs have not been developed. A majority of severe irAEs occur as early as 1 or 2 months after starting anti-PD-1 treatment.Citation3,Citation4 It indicates that irAE-related immunological changes may begin shortly after treatment, allowing the development of severe irAE-predictive biomarkers that are measured early after anti-PD-1 treatment.
In the present study, we performed a detailed assessment of the immunological parameters in patients treated with anti-PD-1 blocking antibodies to provide important insights into the underlying mechanisms that cause irAEs. Considering the crucial role of regulatory T (Treg) cells, T helper-17 (Th17) cells, and CD8+ T cells in autoimmune and chronic inflammatory responses,Citation11–Citation13 we investigated the relative frequency and phenotype of different subsets of peripheral blood T cells in patients with non-small cell lung cancer (NSCLC) or thymic epithelial tumor (TET) who were treated with pembrolizumab or nivolumab. Early T-cell changes were analyzed 7 days posttreatment, when the proliferative response of CD8+ T cells has been shown to peak.Citation14,Citation15 We clustered patients with irAEs into four distinct immunological subtypes according to peripheral blood T-cell parameters and suggest potential biomarkers for the prediction of severe irAEs.
Results
Patient characteristics
The baseline characteristics of the patients included in the study are summarized in . All patients with TET (n = 31) received pembrolizumab, and 42 and 18 patients with NSCLC received pembrolizumab and nivolumab, respectively. None of the patients were treated previously with ICI agents. In addition, none of the patients had evidence of active autoimmune disease. One patient with thymoma had a prior history of myasthenia gravis but did not have any sign of active disease and did not receive immunosuppressive treatment for more than 1 year before administration of pembrolizumab.
Table 1. Baseline characteristics of patients with thymic epithelial tumor (TET) and non-small cell lung cancer (NSCLC)
Peripheral blood T-cell profiling before and after anti-PD-1 treatment
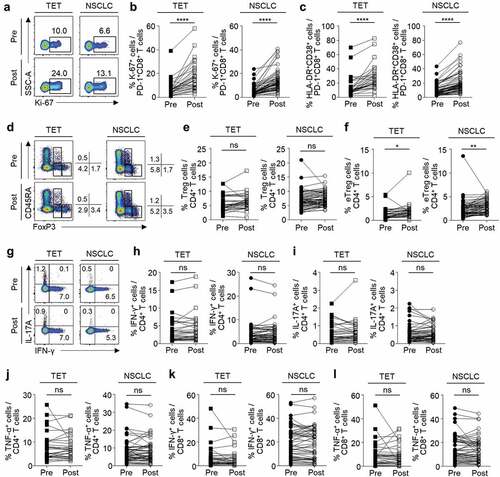
We examined the phenotypes and relative frequency of subpopulations in peripheral blood CD8+ and CD4+ T cells at baseline and 7 days posttreatment. The gating strategies in flow cytometric analyses are presented in Supplementary Figure S1. First, we examined PD-1+CD8+ T cells for their expression of a proliferation marker (Ki-67) and activation markers (HLA-DR and CD38). The percentage of Ki-67+ cells ( and B) and HLA-DR+CD38+ cells () among PD-1+CD8+ T cells significantly increased after anti-PD-1 treatment in patients with TET and NSCLC. We also evaluated the relative frequency of CD4+CD25+CD127loFoxP3+ Treg cells and their subpopulations such as naïve Treg cells (CD45RA+FoxP3lo), effector Treg cells (eTreg or activated Treg cells; CD45RA–FoxP3hi), and non-suppressive cells (CD45RA–FoxP3lo) ().Citation16,Citation17 Though the percentage of Treg cells among CD4+ T cells did not change with anti-PD-1 treatment (), the percentage of eTreg cells was significantly increased by anti-PD-1 treatment () in both TET and NSCLC patients. The percentage of naïve Treg cells or non-suppressive cells did not change (data not shown). We evaluated the production of effector cytokines by CD4+ T cells by intracellular cytokine staining following anti-CD3 stimulation (). In both TET and NSCLC patients, the percentage of IFN-γ+ (), IL-17A+ (), or TNF-α+ () cells among CD4+ T cells did not significantly change with anti-PD-1 treatment. Similarly, the percentage of IFN-γ+ and TNF-α+ cells among CD8+ T cells did not significantly change ( and L).
Figure 1. Changes in peripheral blood T cells following anti-PD-1 treatment
Immune-related adverse events
At a median follow-up of 16.3 months (range, 6.5–28.9 months), irAEs developed in 45 patients (). Grade 1/2 irAEs developed in 14 TET patients (32.3%) and 18 NSCLC patients (30.0%), and severe (grade ≥3) irAEs developed in 7 TET patients (22.6%) and 6 NSCLC patients (10.0%). Some irAEs such as myasthenia gravis, myocarditis, and nephritis were only observed in TET patients (). The severe irAEs are summarized in . The median time to severe irAEs was 4 weeks (range, 1–28 weeks) and 11 patients developed severe irAEs within 3 months (). Treatment was discontinued in 11 patients due to severe irAEs and a median of two cycles (range, 1–24 cycles) were administered, whereas patients that did not develop severe irAEs received a median of seven cycles of treatment (range, 1–53 cycles). Eleven patients with severe irAEs fully recovered from the events by discontinuation of anti-PD-1 agents and administration of immunosuppressive agents. One NSCLC patient experienced grade 5 pneumonitis and one patient with TET died from superimposed cytomegalovirus infection during immunosuppressive treatment.
Table 2. Immune-related adverse events in patients with TET and NSCLC
Table 3. Characteristics of patients who experienced severe immune-related adverse events (irAEs)
Baseline clinicopahological characteristics of patients with TET were not significantly different except that those who developed severe irAEs had significantly higher proportion of patients with thymoma and PD-L1-positive tumors compared to patients with grade 1/2 irAEs or no irAEs (Supplementary Table S1). No significant differences in the baseline clinicopathological characteristics were observed between patients with grade 1/2 irAEs, severe irAEs, or no irAEs, in the NSCLC cohort (Supplementary Table S2).
In the combined cohort of TET and NSCLC patients, the development of grade 1/2 or severe irAEs, was not significantly associated with objective response rate (ORR; Supplementary Table S3), PFS (Supplementary Figure S2A), and OS (Supplementary Figure S2B). Among patients with TET, the development of grade 1/2 or severe irAEs was not predictive of superior ORR (Supplementary Table S3), PFS (Supplementary Figure S2C), or OS (Supplementary Figure S2D). However, in NSCLC patients, the development of grade 1/2 irAEs was associated with significantly higher ORR (Supplementary Table S3) and PFS (Supplementary Figure S2E), but not OS (Supplementary Figure S2F) compared to patients who did not develop irAEs. However, patients with severe irAEs did not exhibit a significant difference in ORR, PFS, and OS with patients who did not experience irAEs (Supplementary Table S3 and Supplementary Figures S2A-F).
Peripheral blood T-cell parameters that correlate with severe irAEs
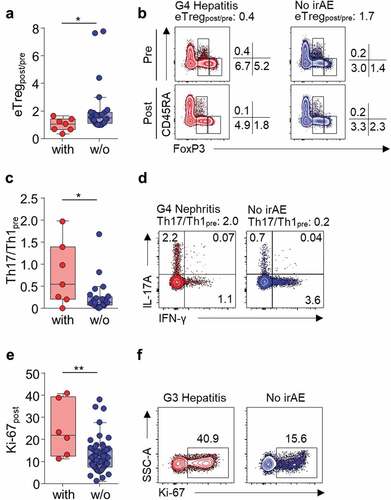
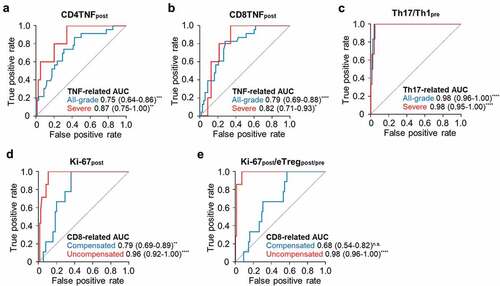
Next, we attempted to find T-cell parameters correlating with grade 1/2 irAEs or severe irAEs in each cohort of patients with TET and NSCLC. Parameters exhibiting both a significant difference among patients with and without irAEs and a significant association with irAEs in the univariate logistic regression analysis were selected. None of the T-cell parameters were significantly associated with the development of grade 1/2 irAEs in the total cohort (Supplementary Table S4 and S7), TET cohort (Supplementary Table S5 and S7), or NSCLC cohort (Supplementary Table S6 and S7). Next, we compared the patients with or without severe irAEs. In the total cohort, percentage of Ki-67+ among PD-1+CD8+ T cells posttreatment (Ki-67post; odds ratio [OR] 1.06, 95% confidence interval [CI] 1.01–1.11, P = .027), fold change in eTreg frequency posttreatment (eTregpost/pre; OR 0.14, 95% CI 0.03–0.75, P = .021), percentage of posttreatment Treg cells (OR 0.71, 95% CI 0.52–0.97, P = .032) and eTreg cells (OR 0.45, 95% CI 0.23–0.89, P = .022) among CD4+ T cells were significantly associated with development of severe irAEs (Supplementary Table S8 and S11). eTregpost/pre, percentage of posttreatment Treg cells, and eTreg cells are correlated and therefore, we used eTregpost/pre for further analysis due to its strongest association with the development of severe irAEs (Supplementary Table S11). In TET patients, eTregpost/pre (OR 0.06, 95% CI 0.00–0.95, P = .046; Supplementary Table S9 and S11, ) and baseline ratio of IL-17A+ cells and IFN-γ+ cells among CD4+ T cells (Th17/Th1pre; OR 6.52, 95% CI 1.09–39.22, P = .040; Supplementary Table S9 and S11, ) were significantly associated with the development of severe irAEs. In NSCLC patients, Ki-67post (OR 1.12, 95% CI 1.03–1.22, P = .008; Supplementary Table S10 and S11, and F) was significantly associated with the development of severe irAEs.
Figure 2. Severe irAE-associated peripheral blood T-cell parameters
Clustering of severe irAEs into distinct subtypes
Because eTregpost/pre, Th17/Th1pre, and Ki-67post were identified as T-cell parameters correlating with severe irAEs, we performed unsupervised clustering analysis with these parameters in the 13 patients with severe irAEs. In this first-round clustering analysis, we found that the patients with severe irAEs were clustered into four distinct subgroups: Th17-related, CD8-related, Treg-related, and not otherwise specified (NOS) (). The Th17-related subgroup had a high Th17/Th1pre value (), the CD8-related subgroup had a high Ki-67post value (), the Treg-related subgroup had a low eTregpost/pre ratio (), and the NOS subgroup had none of the three risk parameters. We further analyzed the T-cell parameters listed in Supplementary Table S2 and S3 to find risk parameters associated with the NOS subgroup. The posttreatment percentage of TNF-α+ cells among CD4+ (CD4TNFpost; ) and CD8+ (CD8TNFpost; ) T cells were significantly higher in the NOS subgroup than in all other patients.
Figure 3. Clustering of patients with severe irAEs based on peripheral blood T-cell parameters
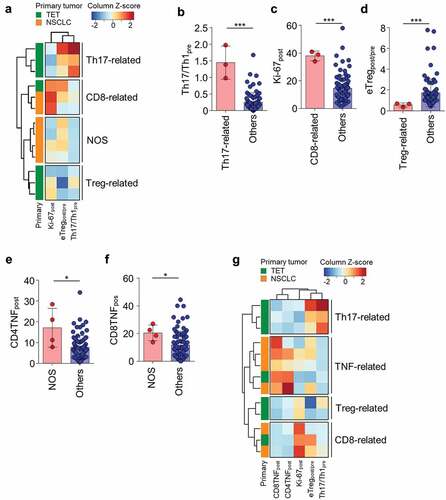
Finally, we performed clustering analysis again with the five significant parameters, including eTregpost/pre, Th17/Th1pre, Ki-67post, CD4TNFpost, and CD8TNFpost, in the 13 patients with severe irAEs. Re-clustering analysis revealed four distinct subgroups: Th17-related (high Th17/Th1pre), TNF-related (high CD4TNFpost and CD8TNFpost), Treg-related (low eTregpost/pre), and CD8-related (high Ki-67post) ( and ). Each risk parameter was specific to each subgroup, and none of the subgroups had multiple features of high Th17/Th1pre, high CD4TNFpost and CD8TNFpost, low eTregpost/pre, or high Ki-67post. Of note, the Th17-related and Treg-related subgroups were restricted to patients with TET, and the TNF-related subgroup mostly consisted of NSCLC patients (). PFS and OS of the patients of the different subgroups of severe irAEs did not significantly differ (Supplementary Figure S3).
Clustering analysis of patients with all-grade irAEs
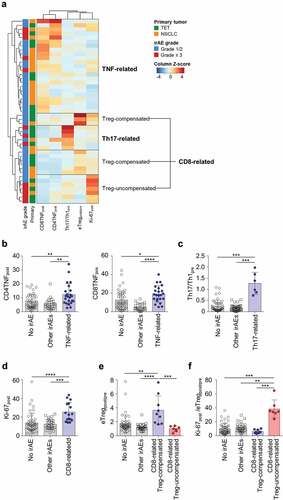
Considering the distinct properties of different subgroups of severe irAEs, we reasoned that this may be also the case with grade 1/2 irAEs, and further performed clustering analysis using the five T-cell parameters, eTregpost/pre, Th17/Th1pre, Ki-67post, CD4TNFpost, and CD8TNFpost, in the 45 patients with all-grade irAEs (). Including all-grade irAEs showed a similar subgroup pattern () compared to the analysis that included only the severe cases (). The irAEs included in each subgroup are summarized in Supplementary Table S12. The TNF-related subgroup exhibited a higher value of CD4TNFpost and CD8TNFpost compared to other subgroups and patients without irAEs ( and B). The Th17-related subgroup exhibited a higher value of Th17/Th1pre compared to other subgroups and patients without irAEs (). Patients with irAEs not included neither in the TNF-related nor the Th17-related cluster exhibited a higher value of Ki-67post ( and D), which is similar to the CD8-related subgroup found in the clustering analysis with severe irAEs (). In addition, we found two subclusters in the CD8-related subgroup which are the Treg-compensated subgroup and Treg-uncompensated subgroup (). The Treg-compensated subgroup had a significantly higher eTregpost/pre value compared to the Treg-uncompensated subgroup and other subgroups (). The ratio of Ki-67post and eTregpost/pre (Ki-67post/eTregpost/pre) was significantly higher in the Treg-uncompensated subgroup than the Treg-compensated subgroup, other subgroups, and patients without irAEs (). However, Ki-67post/eTregpost/pre was not significantly different between the Treg-compensated subgroup and other subgroups or patients without irAEs (). No severe cases were included in the Treg-compensated subgroup, while five of the seven patients in the Treg-uncompensated subgroup experienced severe irAEs. PFS and OS were not significantly different among the patients of the different subgroups of irAEs (Supplementary Figure S4).
Figure 4. Clustering of patients with any grade irAEs based on peripheral blood T-cell parameters
Predictive values of T-cell parameters for each subgroup of irAEs
Since high CD4TNFpost and CD8TNFpost, high Th17/Th1pre, high Ki-67post features, and Ki-67post/eTregpost/pre, were only present in the corresponding Th17-related, TNF-related, CD8-related, and CD8-related Treg-uncompensated subgroups, respectively, we evaluated predictive values of each parameter in predicting each subgroup of irAEs.
CD4TNFpost and CD8TNFpost significantly predicted all-grade or severe TNF-related irAEs ( and B). In addition, Th17/Th1pre significantly predicted all-grade or severe Th17-related irAEs (). Ki-67post was predictive of both CD8-related Treg-compensated and CD8-related Treg-uncompensated irAEs (), but Ki-67post/eTregpost/pre only significantly predicted CD8-related Treg-uncompensated irAEs ().
Figure 5. Predictive values of T-cell parameters for each subgroup of irAEs
Discussion
In this study, we demonstrated that the development of irAEs is associated with the baseline T-cell profile or early T-cell response after anti-PD-1 therapy. In addition, we showed the heterogeneity of irAEs based on the immune phenotype of the patients. Four clusters of patients with irAEs were identified with distinct features of peripheral blood T-cell phenotypes.
The Th17-related subgroup was characterized by a high baseline Th17 to Th1 ratio. The role of Th17 cells has been demonstrated in multiple autoimmune diseases.Citation12,Citation18 Th17 cells secrete a highly inflammatory cytokine, IL-17A, which plays protective roles in host defense against bacterial and fungal pathogens at epithelial and mucosal barriers. Dysregulated production of IL-17A can result in autoimmunity and tissue damage. In addition, previous studies have suggested that the balance between Th17 and Th1 is associated with autoimmune disease.Citation19,Citation20 Recently, an IL-17A blocking antibody was developed and introduced for the treatment of psoriasis,Citation21 psoriatic arthritis,Citation22 and ankylosing spondylitis.Citation23 Intriguingly, IL-17A blocking antibody was also tried in the management anti-PD-1-induced irAEs.Citation24,Citation25
In the TNF-related subgroup, the percentage of TNF-α+ cells among the CD4+ and CD8+ T cell populations was typically high posttreatment. The role of TNF-α in autoimmune disease has been well described, and TNF-α blockers are currently used in clinics.Citation26 Infliximab, a TNF-α blocking antibody drug, is also recommended for the management of severe irAE patients who do not respond to corticosteroids.Citation27 Clinical identification of TNF-related patients with severe irAEs will be important for the appropriate management of patients using TNF-α blockers, such as infliximab.
In the CD8-related subgroup, the percentage of Ki-67+ cells among PD-1+CD8+ T cells was typically high posttreatment. PD-1 blockade may enhance the activation of not only tumor antigen-specific CD8+ T cells, but also autoreactive CD8+ T cells, resulting in breaking self-tolerance. Recent reports have shown abundant CD8+ T cell infiltration in the affected organs of patients who experienced irAEs after anti-PD-1 treatment or combined immune checkpoint blockade.Citation7,Citation28 Future studies evaluating the infiltration of CD8+ T cells into the affected organs of patients in the CD8-related subgroup may further confirm the role of CD8+ T cells in these patients.
Wtihin the CD8-related subgroup, we found two distinct subtypes according to the fold increase of eTreg frequency (eTregpost/pre). The first subtype, Treg-compensated group, exhibited a high eTregpost/pre value and consisted of patients with only grade 1 or 2 irAEs. However, the second subtype, Treg-uncompensated group, did not show an increase in eTreg frequency following treatment and exhibited a significantly higher Ki-67post to eTregpost/pre ratio (Ki-67post/eTregpost/pre) compared to other subgroups. Most of the patients in the Treg-uncompensated subgroup experienced severe irAEs. eTreg cells are highly suppressive activated Treg cells,Citation29 and their frequency was significantly increased 1-week after anti-PD-1 treatment. Although the precise mechanism of the early increase in the frequency of eTreg cells is unknown, we hypothesize that it may be a counter-mechanism to balance the increased activity of effector T cells after PD-1 blockade. Considering the suppressive role of eTreg cells, the decrease or poor increase in this population can be assumed to break immune homeostasis and facilitate autoimmune responses.
Some of the irAEs such as myocarditis were only present in a specific subgroup, while hepatitis, pneumonitis, and hypothyroidism were present in multiple subgroups. Due to the small number of events we were not able to conclude whether a specific irAE is associated with a particular immunological subgroup. However, irAEs present in multiple subgroups implies that the underlying immunological mechanisms may be different even in patients with similar clinical manifestations. If this is the case, a personalized approach in managing severe irAEs may be needed.
The development of irAEs after anti-PD-1/PD-L1 treatment has been proposed to be positive prognostic factors.Citation6,Citation30–Citation32 In our study, we also found that NSCLC patients with grade 1/2 irAEs had significantly higher ORR and PFS. The occurrence of irAEs may be a sign of more robust immune response after PD-1 blockade which may lead to better treatment outcome. Therefore, it should be taken into account that anti-inflammatory strategies to treat irAEs may have protumoral effects as shown from a previous report.Citation24 Thus, the benefit by controlling the symptoms of irAEs by anti-inflammatory strategies and their risk of protumoral effects should be carefully weighed for each patient when managing irAEs.
In our study, severe irAEs occurred at a median time of 4 weeks after treatment initiation and mostly within 3 months. A previous study also reported that severe irAEs after anti-PD-1/PD-L1 treatment occurred at median 40 days after treatment onset,Citation4 indicating that irAE-related immunological changes may begin early after anti-PD-1 treatment. In our study, we obtained peripheral blood samples at baseline and 7 days after treatment. Each T-cell parameter used for clustering analysis had a predictive value for each subgroup of severe irAEs, suggesting potential biomarkers that may be used to identify patients at higher risk of developing severe irAEs. However, the immunological change early after treatment may not entirely reflect the relevant immunological changes associated with irAEs that develop months later. Blood samples drawn at the time of irAEs may be helpful to further investigate the immunological changes of these late-occurring irAEs.
The current study has some limitations. First, we included patients with TET in the present study. TET is well-known to accompany autoimmune diseases, such as myasthenia gravis, even without anti-PD-1 treatment. Moreover, recent studies have reported that severe irAEs are more common after anti-PD-1 treatment in TET patients than patients with other types of cancer.Citation33,Citation34 In addition, the Th17-related and Treg-related subgroups were restricted to patients with TET in the current study. Due to the unique features of TET, further investigation is required to validate our findings in other types of cancer. Second, although we focused on T cells, recent reports have claimed the role of B cells, autoantibodies, and serum cytokines.Citation5,Citation6,Citation9 Analysis of all peripheral blood components will be required to comprehensively understand the pathophysiology of irAEs. Third, some late-onset irAEs were observed and further investigation is required to explain the long latent period between the immunological change and clinical manifestation. Fourth, although 91 patients were recruited in the current study, only 13 patients with severe irAEs could be analyzed for the clustering of subtypes. Therefore, the current findings need to be validated in larger cohorts with various types of cancer. Furthermore, patient recruitment periods were different between the TET and NSCLC patients, and more experience with the detection and management of adverse events may have had an impact on the severity of the irAEs.
In this preliminary, hypothesis-generating study, we found peripheral blood T-cell parameters associated with the development of irAEs after anti-PD-1 therapy and describe four distinct subgroups of patients: Th17-related, TNF-related, CD8-related Treg-compensated, and CD8-related Treg-uncompensated. Our findings suggest there may be distinct underlying immunological mechanisms for different subtypes of irAEs. In addition, early evaluation of the immunological responses may have clinical implications in the prediction of irAEs. Further prospective validation in a more homogeneous population with a larger number of patients is essential to better guide prediction and management of irAEs after anti-PD-1 treatment.
Materials and methods
Patients and sample collection
This study included 31 patients with TET who were enrolled in a phase II trial (NCT02607631)Citation33 that evaluated the safety and efficacy of pembrolizumab (200 mg every 3 weeks). In addition, we prospectively recruited 60 patients with metastatic NSCLC treated with pembrolizumab (200 mg every 3 weeks; n = 42) or nivolumab (2 mg/kg every 2 weeks; n = 18). TET patients were enrolled from March 2016 through June 2016, and NSCLC patients were enrolled between April 2016 and February 2018. Patients with active autoimmune disease who required systemic treatment within 1 year, interstitial lung disease, active infection requiring systemic therapy, known history of human immunodeficiency virus infection, active hepatitis B or hepatitis C virus infection, or received systemic chemotherapy or radiotherapy within 2 weeks were not included in this study. Peripheral blood was collected immediately before treatment and 7 days after the first dose of anti-PD-1 agents to detect the peak immune response after treatment and investigate for early biomarkers to predict severe irAEs. Previous reports have shown that the proliferative response of T cells peaks at 7 days posttreatment and gradually decrease during the following treatment period.Citation14,Citation15 Furthermore, irAEs can develop before the second dose of treatment, and therefore early evaluation is needed. Peripheral blood mononuclear cells (PBMCs) were isolated from whole blood by standard Ficoll-Paque (GE Healthcare, Uppsala, Sweden) density gradient centrifugation. This study was approved by the Institutional Review Board of Samsung Medical Center and was conducted in accordance with the Helsinki Declaration. All patients provided informed consent before inclusion in the study.
Clinical assessment
Physical examination and laboratory tests were performed every 2 or 3 weeks. IrAEs were defined as adverse events of clinical interest with potentially drug-related immunological causes. All adverse events were graded in accordance with the National Cancer Institute Common Terminology Criteria for Adverse Events version 4.0. Grade 3 or higher irAEs were defined as severe irAEs. Anti-PD-1 treatment was withheld if patients presented evidence of severe irAEs, and treatment was discontinued if the adverse events did not resolve within 12 weeks from the last dose or if corticosteroid could not be reduced to ≤10 mg per day (or equivalent dose of prednisone per day) within 12 weeks.
The tumor response was assessed according to the Response Evaluation Criteria In Solid Tumors (RECIST), version 1.1. An objective response was defined as a radiologically confirmed complete or partial response. Patients were suspicious of pseudopregression at first response evaluation that were clinically stable continued treatment and were reevaluated with a new CT scan 4 weeks later to confirm progression. Progression-free survival (PFS) was defined as the time from the start of anti-PD-1 treatment to either disease progression (according to RECIST v1.1) or death from any cause. Overall survival (OS) was defined as the time from the start of anti-PD-1 treatment to death from any cause.
Multi-color flow cytometry
The following fluorochrome-conjugated monoclonal antibodies were used in multicolor flow cytometry: anti-CD8 (SK1 and RPA-T8), anti-CD3 (UCTH1 or SK7), anti-CD45RA (HI100), anti-CD4 (SK3), anti-CD25 (M-A251), anti-granzyme B (GB11) (all from BD Biosciences, San Jose, CA); anti-PD-1 (EH.12.2H7), anti-Ki-67 (Ki-67), anti-CD38 (HB7), anti-CD127 (A019D5) (all from Biolegend, San Diego, CA); anti-HLA-DR (LN3), anti-FoxP3 (PCH101), anti-CD14 (61D3), anti-CD19 (HIB19) (all from eBioscience, San Diego, CA); and anti-human IgG4 Fc (HP6025, Southern Biotech). Dead cells were stained using the LIVE/DEAD Fixable Red Dead Cell Stain Kit (Invitrogen, Carlsbad, CA) and excluded from the analysis. Intracellular Ki-67, granzyme B, and FoxP3 were stained using a FoxP3 transcription factor staining buffer set (eBioscience, San Diego, CA) and specific antibodies. All stained samples were counted on an LSR II flow cytometer (BD Biosciences, San Jose, CA) and the data analyzed using FlowJo software version 10.4.0 (Treestar, San Carlos, CA).
Intracellular cytokine staining
For intracellular cytokine staining, PBMCs were stimulated with an anti-CD3 antibody (1 μg/mL; OKT3, eBioscience) for 6 h. Brefeldin A (GolgiPlug, BD Biosciences) was added 1 h after anti-CD3 stimulation. Cytokine production was analyzed by intracellular staining using anti-interferon (IFN)-γ (B27), anti-tumor necrosis factor (TNF)-α (MAb11), and anti-interleukin (IL)-17A (N49-653) (all from BD Biosciences, San Jose, CA) antibodies.
Statistical methods
Continuous and categorical variables were compared as indicated in the figure legends. Univariate logistic regression was used to evaluate the correlation of severe irAEs and T-cell parameters. Unsupervised hierarchical clustering was performed and a heatmap was generated using pheatmap package version 1.0.12. Two-sided P-values <0.05 were considered significant. All statistical analyses were performed with Prism software version 6.0 (GraphPad, La Jolla, CA) and R statistical software version 3.2.2 (R Foundation for Statistical Computing, Vienna, Austria).
Disclosure of Potential Conflicts of Interest
No potential conflicts of interest were disclosed.
Supplemental Material
Download ()Supplementary material
Supplemental data for this article can be accessed on the publisher’s website.
Additional information
Funding
References
- Ribas A, Wolchok JD. Cancer immunotherapy using checkpoint blockade. Science. 2018;359(6382):1350–12. doi:10.1126/science.aar4060.
- Wei SC, Duffy CR, Allison JP. Fundamental mechanisms of immune checkpoint blockade therapy. Cancer Discov. 2018;8(9):1069–1086. doi:10.1158/2159-8290.CD-18-0367.
- Postow MA, Sidlow R, Hellmann MD. Immune-related adverse events associated with immune checkpoint blockade. N Engl J Med. 2018;378(2):158–168. doi:10.1056/NEJMra1703481.
- Wang DY, Salem JE, Cohen JV, Chandra S, Menzer C, Ye F, Zhao S, Das S, Beckermann KE, Ha L, et al. Fatal toxic effects associated with immune checkpoint inhibitors: a systematic review and meta-analysis. JAMA Oncol. 2018;4(12):1721–1728. doi:10.1001/jamaoncol.2018.3923.
- Osorio JC, Ni A, Chaft JE, Pollina R, Kasler MK, Stephens D, Rodriguez C, Cambridge L, Rizvi H, Wolchok JD, et al. Antibody-mediated thyroid dysfunction during T-cell checkpoint blockade in patients with non-small-cell lung cancer. Ann Oncol. 2017;28(3):583–589. doi:10.1093/annonc/mdw640.
- Toi Y, Sugawara S, Sugisaka J, Ono H, Kawashima Y, Aiba T, Kawana S, Saito R, Aso M, Tsurumi K, et al. Profiling preexisting antibodies in patients treated with anti-PD-1 therapy for advanced non-small cell lung cancer. JAMA Oncol. 2018. doi:10.1001/jamaoncol.2018.5860.
- Johnson DB, Balko JM, Compton ML, Chalkias S, Gorham J, Xu Y, Hicks M, Puzanov I, Alexander MR, Bloomer TL, et al. Fulminant myocarditis with combination immune checkpoint blockade. N Engl J Med. 2016;375(18):1749–1755. doi:10.1056/NEJMoa1609214.
- Lim SY, Lee JH, Gide TN, Menzies AM, Guminski A, Carlino MS, Breen EJ, Yang JYH, Ghazanfar S, Kefford RF, et al. Circulating cytokines predict immune-related toxicity in melanoma patients receiving anti-PD-1-based immunotherapy. Clin Cancer Res. 2018. doi:10.1158/1078-0432.CCR-18-2795.
- Das R, Bar N, Ferreira M, Newman AM, Zhang L, Bailur JK, Bacchiocchi A, Kluger H, Wei W, Halaban R, et al. Early B cell changes predict autoimmunity following combination immune checkpoint blockade. J Clin Invest. 2018;128(2):715–720. doi:10.1172/JCI96798.
- Dubin K, Callahan MK, Ren B, Khanin R, Viale A, Ling L, No D, Gobourne A, Littmann E, Huttenhower C, et al. Intestinal microbiome analyses identify melanoma patients at risk for checkpoint-blockade-induced colitis. Nat Commun. 2016;7:10391. doi:10.1038/ncomms10391.
- Wing K, Sakaguchi S. Regulatory T cells exert checks and balances on self tolerance and autoimmunity. Nat Immunol. 2010;11(1):7–13. doi:10.1038/ni.1818.
- Bettelli E, Oukka M, Kuchroo VK. T(H)-17 cells in the circle of immunity and autoimmunity. Nat Immunol. 2007;8(4):345–350. doi:10.1038/ni0407-345.
- Walter U, Santamaria P. CD8+ T cells in autoimmunity. Curr Opin Immunol. 2005;17(6):624–631. doi:10.1016/j.coi.2005.09.014.
- Huang AC, Orlowski RJ, Xu X, Mick R, George SM, Yan PK, Manne S, Kraya AA, Wubbenhorst B, Dorfman L, et al. A single dose of neoadjuvant PD-1 blockade predicts clinical outcomes in resectable melanoma. Nat Med. 2019;25(3):454–461. doi:10.1038/s41591-019-0357-y.
- Kim KH, Cho J, Ku BM, Koh J, Sun JM, Lee SH, Ahn JS, Cheon J, Min YJ, Park SH, et al. The first-week proliferative response of peripheral blood PD-1(+)CD8(+) T cells predicts the response to anti-PD-1 therapy in solid tumors. Clin Cancer Res. 2019;25(7):2144–2154. doi:10.1158/1078-0432.CCR-18-1449.
- Miyara M, Yoshioka Y, Kitoh A, Shima T, Wing K, Niwa A, Parizot C, Taflin C, Heike T, Valeyre D, et al. Functional delineation and differentiation dynamics of human CD4+ T cells expressing the FoxP3 transcription factor. Immunity. 2009;30(6):899–911. doi:10.1016/j.immuni.2009.03.019.
- Jung MK, Shin EC. Regulatory T cells in hepatitis B and C virus infections. Immune Netw. 2016;16(6):330–336. doi:10.4110/in.2016.16.6.330.
- Yang J, Sundrud MS, Skepner J, Yamagata T. Targeting Th17 cells in autoimmune diseases. Trends Pharmacol Sci. 2014;35(10):493–500. doi:10.1016/j.tips.2014.07.006.
- Shah K, Lee WW, Lee SH, Kim SH, Kang SW, Craft J, Kang I. Dysregulated balance of Th17 and Th1 cells in systemic lupus erythematosus. Arthritis Res Ther. 2010;12(2):R53. doi:10.1186/ar2964.
- Kobayashi T, Okamoto S, Hisamatsu T, Kamada N, Chinen H, Saito R, Kitazume MT, Nakazawa A, Sugita A, Koganei K, et al. IL23 differentially regulates the Th1/Th17 balance in ulcerative colitis and Crohn’s disease. Gut. 2008;57(12):1682–1689. doi:10.1136/gut.2007.135053.
- Langley RG, Elewski BE, Lebwohl M, Reich K, Griffiths CE, Papp K, Puig L, Nakagawa H, Spelman L, Sigurgeirsson B, et al. Secukinumab in plaque psoriasis–results of two phase 3 trials. N Engl J Med. 2014;371(4):326–338. doi:10.1056/NEJMoa1314258.
- Mease PJ, McInnes IB, Kirkham B, Kavanaugh A, Rahman P, van der Heijde D, Landewe R, Nash P, Pricop L, Yuan J, et al. Secukinumab inhibition of interleukin-17A in patients with psoriatic arthritis. N Engl J Med. 2015;373(14):1329–1339. doi:10.1056/NEJMoa1412679.
- Baeten D, Sieper J, Braun J, Baraliakos X, Dougados M, Emery P, Deodhar A, Porter B, Martin R, Andersson M, et al. Secukinumab, an interleukin-17A inhibitor, in ankylosing spondylitis. N Engl J Med. 2015;373(26):2534–2548. doi:10.1056/NEJMoa1505066.
- Esfahani K, Miller WH Jr. Reversal of autoimmune toxicity and loss of tumor response by interleukin-17 blockade. N Engl J Med. 2017;376(20):1989–1991. doi:10.1056/NEJMc1703047.
- Johnson DH, Patel AB, Uemura MI, Trinh VA, Jackson N, Zobniw CM, Tetzlaff MT, Hwu P, Curry JL, Diab A. IL17A blockade successfully treated psoriasiform dermatologic toxicity from immunotherapy. Cancer Immunol Res. 2019. doi:10.1158/2326-6066.CIR-18-0682.
- Tracey D, Klareskog L, Sasso EH, Salfeld JG, Tak PP. Tumor necrosis factor antagonist mechanisms of action: a comprehensive review. Pharmacol Ther. 2008;117(2):244–279. doi:10.1016/j.pharmthera.2007.10.001.
- Haanen J, Carbonnel F, Robert C, Kerr KM, Peters S, Larkin J, Jordan K, Committee EG. Management of toxicities from immunotherapy: ESMO clinical practice guidelines for diagnosis, treatment and follow-up. Ann Oncol. 2017;28(suppl_4):iv119–iv42. doi:10.1093/annonc/mdx225.
- Martinez-Calle N, Rodriguez-Otero P, Villar S, Mejias L, Melero I, Prosper F, Marinello P, Paiva B, Idoate M, San-Miguel J. Anti-PD1 associated fulminant myocarditis after a single pembrolizumab dose: the role of occult pre-existing autoimmunity. Haematologica. 2018;103(7):e318–e21. doi:10.3324/haematol.2017.185777.
- Sakaguchi S, Yamaguchi T, Nomura T, Ono M. Regulatory T cells and immune tolerance. Cell. 2008;133(5):775–787. doi:10.1016/j.cell.2008.05.009.
- Haratani K, Hayashi H, Chiba Y, Kudo K, Yonesaka K, Kato R, Kaneda H, Hasegawa Y, Tanaka K, Takeda M, et al. Association of immune-related adverse events with nivolumab efficacy in non-small-cell lung cancer. JAMA Oncol. 2018;4(3):374–378. doi:10.1001/jamaoncol.2017.2925.
- Weber J, Mandala M, Del Vecchio M, Gogas HJ, Arance AM, Cowey CL, Dalle S, Schenker M, Chiarion-Sileni V, Marquez-Rodas I, et al. Adjuvant nivolumab versus ipilimumab in resected stage III or IV melanoma. N Engl J Med. 2017;377(19):1824–1835. doi:10.1056/NEJMoa1709030.
- Teraoka S, Fujimoto D, Morimoto T, Kawachi H, Ito M, Sato Y, Nagata K, Nakagawa A, Otsuka K, Uehara K, et al. Early immune-related adverse events and association with outcome in advanced non-small cell lung cancer patients treated with nivolumab: a prospective cohort study. J Thorac Oncol. 2017;12(12):1798–1805. doi:10.1016/j.jtho.2017.08.022.
- Cho J, Kim HS, Ku BM, Choi YL, Cristescu R, Han J, Sun JM, Lee SH, Ahn JS, Park K, et al. Pembrolizumab for patients with refractory or relapsed thymic epithelial tumor: an open-label phase II trial. J Clin Oncol. 2018. doi:10.1200/JCO.2017.77.3184.JCO2017773184.
- Giaccone G, Kim C, Thompson J, McGuire C, Kallakury B, Chahine JJ, Manning M, Mogg R, Blumenschein WM, Tan MT, et al. Pembrolizumab in patients with thymic carcinoma: a single-arm, single-centre, phase 2 study. Lancet Oncol. 2018;19(3):347–355. doi:10.1016/S1470-2045(18)30062-7.