
ABSTRACT
The T-cell inhibitory molecule PD-L1 is expressed on a fraction of breast cancer cells. The distribution of PD-L1 on the different subpopulations of breast cancer cells is not well-defined. Our aim was to study the expression level of PD-L1 on breast cancer stem-like (CSC-like) cells and their differentiated-like counterparts. We used multi-parametric flow cytometry to measure PD-L1 expression in different subpopulations of breast cancer cells. Pathway inhibitors, quantitative immunofluorescence, cell sorting, and western blot were used to investigate the underlying mechanism of PD-L1 upregulation in CSC-like cells. Specifically, PD-L1 was overexpressed up to three folds on breast CSC-like cells compared with more differentiated-like cancer cells. Functional in vitro and in vivo assays show higher stemness of PD-L1hi as compared with PD-L1lo cells. Among different pathways examined, PD-L1 expression on CSCs was partly dependant on Notch, and/or PI3K/AKT pathway activation. The effect of Notch inhibitors on PD-L1 overexpression in CSCs was completely abrogated upon mTOR knockdown. Specific knockdown of different Notch receptors shows Notch3 as a mediator for PD-L1 overexpression on CSCs and important for maintaining their stemness. Indeed, Notch3 was found to be overexpressed on PD-L1hi cells and specific knockdown of Notch3 abolished the effect of notch inhibitors and ligands on PD-L1 expression as well as mTOR activation. Our data demonstrated that overexpression of PD-L1 on CSCs is partly mediated by the notch pathway through Notch3/mTOR axis. We propose that these findings will help in a better design of anti-PD-L1 combination therapies to treat breast cancer effectively.
Background
Breast cancer is the most common malignant disease and the second leading cause of death in women around the world.Citation1 Recent years have witnessed significant advances in the treatment of breast cancer. However, mortality remains high mainly in the subtype that lacks the expression of estrogen, progesterone, and Her2/neu receptors and thus it is called triple-negative breast cancer (TNBC).
Immunotherapy is one of the most promising modality to treat TNBC. Recently, high enthusiasm is generated with the initial success of the anti-PD-L1 therapy, in combination with chemotherapy.Citation2 However, like most Immuno-oncology therapeutic agents, only a fraction of patients benefits from treatment. Failure of treatment is likely due to a subpopulation of resistant tumor cells. Which cancer cell subset specifically express or overexpress PD-L1 and what is the best combination to target these cells is not well-defined.
TNBC cells are enriched with a subset of cells that have the ability of self-new, a feature of stem cells, thus called Cancer Stem Cells (CSCs). Furthermore, CSCs are therapy-resistant, and are able to re-grow and metastasize, (Reviewed inCitation3). CSCs can be generated via a process called epithelial-to-mesenchymal transition (EMT) whereby epithelial cells lose their cell-to-cell junctions and gain features of mesenchymal cells.Citation4 There is evidence that CSCs are not just resistant to chemotherapy but also immunotherapy.Citation5,Citation6 This is consistent with the evidence that EMT promote the immune escape of breast cancer cells.Citation7–Citation8 We have shown previously that PD-L1 expression is specifically upregulated upon EMT induction,Citation9 which suggests a link between PD-L1 and CSCs. In a subsequent study, we have demonstrated the association between PD-L1 expression and CSCs maintenance via upregulation of the embryonic self-renewal factors: OCT4 and Nanog.Citation10 However, how PD-L1 is maintained specifically on CSCs is not well-defined yet.
In this report, we have found that CSCs upregulate PD-L1 on their cell surface as compared to their differentiated counterparts. PD-L1 upregulation on CSCs was partially due to higher activity of Notch3 on mTOR signaling pathway. Combinations targeting PD-L1 and notch3 molecules could be a promising therapeutic approach.
Results
Breast CSCs overexpress PD-L1
The association between CSCs and PD-L1 expression has been described by our group and others.Citation10 However, how CSCs upregulate PD-L1 on their surface is not well-described. To investigate this further, we used several breast cancer cell lines (all TNBC) available in our laboratory that express PD-L1. Multi-parametric flow cytometry was used to check for the expression of PD-L1 on the surface of cells having CSCs phenotype (called here as CSC-like cells) and their differentiated counterparts (supplementary Figure 1). PD-L1 was overexpressed 2–3 folds on cells having the common CSCs phenotype (CD44high/CD24low/Ep-CAM+/high) compared with more-differentiated-like cells (). Similar results were obtained when CD90, another stem-cell maker,Citation11 was used to identify CSC-like cells. CD90high/Ep-CAM+/high cells expressed around two fold higher PD-L1 than their differentiated-like counterparts ().
Figure 1. PD-L1 is overexpressed in CSCs subpopulation of breast cancer cells. PD-L1 expression level in both CSC-like subpopulation and their differentiated-like counterparts in five breast cancer cell lines as identified by phenotype using two different sets of markers: a) commonly used CSCs set of markers: EP-CAM+/CD44high/CD24low to identify CSC-like cells and CD44low/CD24high for differentiated-like cells and b) the alternative phenotype Ep-CAM+/CD90high to identify CSC-like and CD90low for differentiated-like cells. Results are displayed as the average of Mean florescence intensity (MFI) of four independent experiments ± SEM. * indicates statistical significance (p < .05)
We sorted PD-L1hi and PD-L1lo from breast cancer cell lines using at least 3 times difference in PD-L1 expression level between the two subpopulations (supplementary Figure 2). qPCR was used to assess the expression of CD44 and CD24 in sorted cells and the expression of PD-L1 was used as a control for the quality/specificity of cell sorting (). Expression of stem-cell-related genes (CD44 & CD24) confirmed that PD-L1hi cells have significantly higher expression of CD44, with the exception of BT-549, and lower expression of CD24 molecules. As expected, PD-L1 expression was higher in PD-L1hi and vice versa in PD-L1lo cells confirming the accuracy of cell sorting. Results of Ep-CAM were not consistent between cell lines (supplementary figure 3). PD-L1hi fraction had a higher expression level of Ep-CAM in SUM149 cells and lower in MDA-MB-231 cells while BT-549 cells showed no significant difference in Ep-CAM expression between PD-L1hi and PD-L1lo fractions. Altogether, based on CD44 and CD24 expression, results indicate that PD-L1hi cells have CSC-like phenotype, while PD-L1lo cells have differentiated-like phenotype in breast cancer cells.
Figure 2. PD-L1hi cells have stem-like features Stemness features of PD-L1hi and PD-L1lo cells sorted MDA-MB-231 cells were assessed by qPCR (a) using CD44 and CD24 expression levels as markers of CSCs and PD-L1 was used as a control for the cell sorting, or functionally by either (B&C) tumorsphere formation ability in vitro or (d) tumor formation and growth in Nude mice. In A, B & C results were normalized on PD-L1lo cells. Experiments were conducted at least three times and displayed as mean ± SEM. *,** indicates statistical significance * = p value <.05, ** = p value <.001. For limiting dilution tumor formation assay (D), three different cell dilutions (5,100,500) of sorted PD-L1hi and PD-L1lo cells were injected into Nude mice. After injection, both tumor formation and tumor sizes were monitored for 9 weeks starting from week5, when the tumor became noticeable
To functionally test the stemness of PD-L1hi cells, we examined their ability to grow in an anchorage-independent fashion and form tumorspheres, an in vitro feature of CSCs. PD-L1hi cells formed significantly higher tumorspheres than their PD-L1lo counterparts (). Due to heterogeneity of CSCs, we assumed that not all CSC-like cells (based on the phenotype) are CSCs. Therefore, we have further fractionated CSC-like or differentiated-like cell populations into PD-L1hi and PD-L1lo cells. Even within CSC-like, PD-L1hi cells formed more tumorspheres than the PD-L1lo cells ( and Supplementary figure 4). Similar trend of increased tumorsphere formation by PD-L1hi cells was seen in the differentiated-like cell population.
Figure 3. PD-L1 is overexpressed in breast cancer cells though Notch, MAPK/ERK, and/or PI3K/AKT pathways. a) PD-L1 expression level, as measured by flow cytometry, in CSC-like cell subpopulation and their differentiated-like counterparts of MDA-MB-231 breast cancer cells upon treatment with specific inhibitors for stem cell-related pathways. Results are displayed as the mean MFI of, at least, five independent experiments (Mean± SEM) of PD-L1 expression after 24-h incubation with pathway inhibitors. *,** indicates statistical significance * = p value <.05, ** = p value <.001. Significance was tested using paired student T-test for difference in PD-L1 expression upon treatment with pathway inhibitors as compared with untreated cells. b) PD-L1 expression in CSC-like cell subpopulation and their differentiated-like counterparts upon treatment with notch inhibitor in two additional breast cancer cell lines: SUM149 and HCC1937 as well as normal-like human mammary luminal (HMLE) cells. c) Tumorsphere formation assay for sorted PD-L1hi and PD-L1lo upon treatment with notch inhibitor as compared with untreated control. d&e) PD-L1 expression level, as measured by flow cytometry after treatment with notch pathway inhibitor II (RO4929097) (d) or treatment with specific notch ligands (DLL-1, 1500 nM or Jag1, 1 µg/mL) (e) as compared with untreated control. Results in b, c, d & e are displayed as the mean of at least three independent experiments (Mean± SEM) of PD-L1 expression after 24-h incubation with inhibitor. * = p value <.05. Significance was tested for difference in PD-L1 expression in CSC-like subpopulations upon treatment as compared with untreated cells
We validated stemness of PD-L1hi cells in vivo by injecting sorted PD-L1hi and PD-L1lo MDA-MB-231 breast cancer cells at different inoculation densities (5, 100, and 500 cells/mice) in 6 mice for each injection group. Results show that PD-L1hi cells formed larger tumors than their PD-L1lo counterparts indicating their relative enrichment with CSCs (). ELDA test shows a two-fold enrichment of CSCs in PD-L1hi group compared to PD-L1lo cells, although it did not reach to statistical significance (). Altogether, the above data show that cells with CSCs phenotype have a higher level of PD-L1 expression.
Table 1. Cancer stem cell-related pathways inhibitors
From this point, we used the MDA-MB-231 cell line for further analysis as they had a high differential expression of PD-L1 between CSC-like cells and their differentiated-like counterparts, and higher level of PD-L1 expression (measured as mean fluorescence intensity in flow cytometry ().
The overexpression of PD-L1 on CSC-like cells is partially mediated through the activation of the notch pathway
To gain insight into the mechanism of PD-L1 upregulation selectively on CSCs, PD-L1 expression was measured in CSC-like cells or their differentiated-like counterparts upon treatment of MDA-MB-231 breast cancer cells with different inhibitors for pathways known to regulate stemness of CSCs or PD-L1 expression in general. Notch, MAPK/ERK, and PI3K/AKT pathway inhibitors were the only tested agents that significantly downregulated PD-L1 on CSC-like cells (). For Notch and MAPK/ERK, the effect was significant on both CSC-like cells and their differentiated-like cells. However, the notch inhibitor had the highest differential effect on CSC-like cells as compared to differentiated-like cells.
Addition of MAPK/ERK or PI3K/AKT inhibitor to notch inhibitor did not further downregulate PD-L1 on CSCs as compared to Notch inhibitor alone (data not shown) suggesting a degree of interaction between these pathways.
To validate the role of Notch pathway on PD-L1 expression in CSC-like cells, we used two other breast cancer cells lines, SUM149, and HCC1937. Similar to the effect on MDA-MB-231, Notch pathway inhibition suppressed PD-L1 expression on CSC-like cells of SUM149 and HCC1937 breast cancer cell lines (). Interestingly, notch inhibition had no significant effect on PD-L1 expression in stem-like cells of the normal-like, human mammary luminal epithelial cells (HMLE).
To functionally test the critical role of Notch pathway on PD-L1 expression in CSC-like cells, tumorsphere formation ability was performed on sorted PD-L1hi cells after treatment with Notch Inhibitor. Treated as well as untreated MDA-MB-231 cells were sorted into PD-L1hi and PD-L1lo subpopulation. Results show that the differential expression of PD-L1 on CSC-like as compared to differentiated-like cells was totally abrogated when Notch inhibitor was used ().
To confirm the dose-dependent effect of notch pathway inhibitor on PD-L1, we tested the effect of suboptimal doses of the notch inhibitor on CSC-like cell expression level of PD-L1. Indeed, there was a dose-dependent effect of the Notch pathway inhibitor on PD-L1 expression on CSC-like cells but not their differentiated counterparts except at 20 µM where there was a significant effect on differentiated-like cells, albeit relatively minor (Supplementary figure 5).
We then used another notch inhibitor (Notch Inhibitor II, RO4929097) to confirm the effect of notch pathway on PD-L1 expression in CSC-like cells. Similar to the previously used (notch inhibitor, FLI-06), notch inhibitor II also inhibited PD-L1 expression in CSCs-like cells with minor effects on PD-L1 expression in differentiated-like cells ().
On the other hand, triggering the Notch pathway with specific ligands (DLL1 and Jag1) increased PD-L1 expression in CSC-like cells ().
Canonical notch pathway activation is known to promote the expression of several downstream target genes of HES/HEY family. We examined the gene expression of some of these key downstream targets. There was no significant difference in notch downstream targets between PD-L1hi and PD-L1lo cells (supplementary figure 6).
Altogether, results indicate that non-canonical notch pathway activation is involved in the overexpression of PD-L1 on CSC-like cells.
Notch3 partially mediates PD-L1 expression on CSC-like cells
Notch has multiple receptors (Notch 1, 2, 3 and 4). Initially, we checked for the expression of these notch receptors in PD-L1hi and PD-L1lo cells. Notch3 was overexpressed in PD-L1hi compared to PD-L1lo cells (). Notch4 expression was barely detectable in MDA-MB-231 cells and therefore was not investigated further. To screen which of these receptors mediates the Notch-dependent upregulation of PD-L1, we knocked down each of these receptors using specific SiRNA. Only Notch 3 knockdown significantly decreased PD-L1 expressed in MDA-MB-231 breast CSC-like cells by 20% (). When normalizing with a transfection efficiency of ~ 57% (based on knocking down PDL1 using specific SiRNA, data not shown), knocking Notch3 could decrease PDL1 by up to ~37%.
Figure 4. PD-L1 is expressed on CSC-like cells through Notch3 activation. a) Expression levels of Notch 1, 2 and 3 in PD-L1hi and PD-L1lo sorted fractions of MDA-MB-231 cells as measured by qPCR. Results are from at least two independent sortings, error bars represent mean ± SEM. b&c) PD-L1 expression in different cell subpopulations of MDA-MB-231 upon knockdown of different notch receptors using specific SiRNA (b) or knockdown of notch3 (c) in the presence/absence of the notch ligand Jag1 or notch II inhibitor. Significance was tested for a difference in PD-L1 expression in CSC-like subpopulations as compared with untreated control cells (Si Cont). d) Western blot showing Notch3 expression in PD-L1hi and PD-L1lo sorted MDA-MB-231 cells. Cells were collected from multiple sortings to generate a blot. Results are displayed as the mean of six independent experiments (Mean± SEM). E) PD-L1 expression in subpopulations of MDA-MB-231 cells transfected either with GFP-tagged notch3 ORF or GFP tag empty vector (EV). Data are displayed as means of five different experiments ± SEM. * = p value <.05 and indicated statistical significance. Representative dotplots for one of the experiments are presented in supplementary figure 8
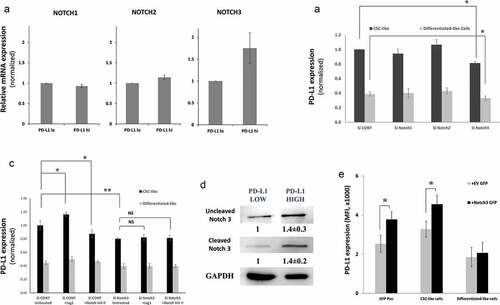
To further confirm the role of Notch3 on PD-L1 overexpression on CSC-like cells, we tested the effect of Notch3 expression in the presence or absence of Jag1, a notch ligand, or notch inhibitor II. Indeed, while Jag1 increased the PD-L1 expression in CSC-like cells, its effect on PD-L1 expression was abrogated upon Notch3 knockdown (). In consistence, the effect of notch inhibitor II or Jag1 was totally abrogated upon notch3 knockdown suggesting that Notch inhibitor indeed is downregulating PD-L1 in CSCs by inhibiting the activity of notch3. To visualize the overexpression and activation of Notch3 in PD-L1hi cells, we sorted PD-L1hi and PD-L1lo cells of MDA-MB-231 cells and measured notch3 expression by western blot. Indeed, both total and cleaved notch3 were overexpressed in PD-L1hi cells (). We further measured the level of the notch3 ligand, Jag1 in PD-L1hi and PD-L1lo cells. Indeed, Jag1 expression was higher in PD-L1hi subpopulation of MDA-MB-231 cells as compared with PD-L1lo cells (supplementary figure 7).
We then asked whether the overexpression of Notch3 in MDA-MB-231 would increase PD-L1 expression. We used a GFP tagged Notch3 to track cells overexpressing Notch3.
We gated on GFP low/medium rather than GFP high cells as high notch3 tagged GFP cells were unstable and tended to disappear in continuous culture as compared with the control in consistence with previously reported data.Citation12
GFP positive cells had a higher level of PD-L1 as compared with control-transfected cells (GFP tagged vector lacking Notch3 (EV)) ( and Supplementary figure 8). Interestingly, this increase in PD-L1 expression upon Notch3 transfection was also seen in CSC-like gated cells compared with the control but not in differentiated-like cell population. Interestingly, the Notch3 overexpressing cells were mainly of CD44high/CD24low, the CSC-like phenotype (Supplementary figure 8), further supporting the effect of notch3 on CSCs.
Altogether, Notch3 overexpression in CSC-like cells is at least partially accountable for PD-L1 overexpression in CSC-like cells.
To test the relevance of notch3 to CSC-like cells, we tested the effect of notch3 expression on the stemness of breast cancer cells. To this end, we measured the tumorsphere forming ability of MDA-MB-231 breast cancer cells upon Notch3 knockdown. Indeed, Notch3 knockdown dramatically decreased the ability of MDA-MB-231 cells to form tumorsphere indicating its essential role in maintaining the stemness of these cells (Supplementary figure 9). Altogether, we concluded that Notch3 expression on CSCs upregulates PD-L1 expression while maintaining their stemness as well.
Notch pathway upregulates PD-L1 through mTOR pathway
We then explored the mechanism by which notch3 regulates PD-L1 expression on CSC-like cells. Notch is not known to bind PD-L1 promoter and therefore we hypothesized that notch can modulate PD-L1 expression indirectly. There is evidence that Notch can regulate c-Myc, Stat3 and mTOR, all of which are known to regulate PD-L1 expression.Citation13–Citation15 We thus theorized that one of these factors might be the link between notch and PD-L1 expression. To check if any of these factors actually regulate PD-L1 expression in MDA-MB-231 cells, we used specific and validated SiRNA (supplementary figure 10) to knockdown the expression of these factors. While knocking down STAT3 and c-Myc had no significant inhibitory effect on PD-L1 expression in either CSC-like or differentiated-like cells, knocking down mTOR downregulated PD-L1 expression in both CSC-like and differentiated-like cells (). To further confirm that c-Myc and STAT3 expression had no effect on PD-L1 expression in CSC-like cells, we knocked down c-Myc and STAT3 using validated and specific shRNA (supplementary figure 11) targeting c-Myc and STAT3 expression. Consistent with SiRNA results, ShRNA showed no significant effect of c-Myc or STAT3 knockdown on PD-L1 expression in CSC-like cells in MDA-MB-231 cells.
Figure 5. Notch upregulates PD-L1 through mTOR pathway. a) PD-L1 expression assessed by flow cytometry (MFI) in different cell subpopulation of MDA-MB-231 cells upon STAT3, c-Myc or mTOR knockdown using specific SiRNA. B&C) mTOR pathway activation upon treatment with notch inhibitor, MAPK/ERK inhibitor or PI3K/AKT inhibitor measured by: b) quantitative immunofluorescence of phosphorylated mTOR with representing images on top. c) phosphorylated and total 4E-BP1, S6 or ERK proteins as measured by western blot (left) with quantification (mean ± SEM) of blots from 3 different experiments (right). d) PD-L1 expression in different cell subpopulations of mTOR knocked down MDA-MB-231 breast cancer cells (Si-mTOR) compared with the scrambled ShRNA control (Sh-CONT) cells in the presence or absence of notch inhibitor
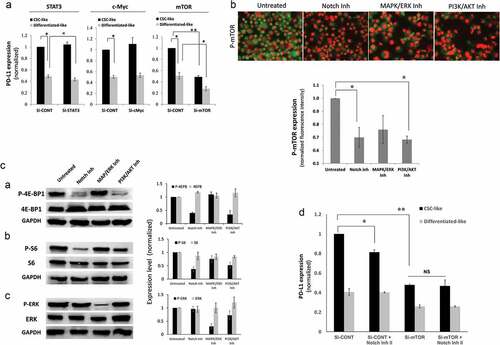
To examine if notch inhibitors can modulate mTOR in MDA-MB-231 breast cancer cells, we checked for mTOR phosphorylation while using the MAPK/ERK and PI3K/AKT pathway inhibitors as controls. Indeed, the notch inhibitor decreased the phosphorylation of mTOR significantly in a similar fashion to the PI3K/AKT inhibitor (). We further checked for the phosphorylation of the mTOR downstream targets 4E-BP1 and S6 by western blot. Indeed, notch inhibitor downregulated 4E-BP1 and S6 phosphorylation in a similar fashion to the PI3K/AKT inhibitor. MAPK/ERK inhibitor had a minor effect on S6 phosphorylation and no effect on 4E-BP1 phosphorylation (). As a control, MAPK/ERK inhibitor and to a lesser extent PI3K/AKT inhibitor downregulated phosphorylation of ERK as expected. To further confirm that the dependence of PD-L1 expression on Notch activation is mediated through mTOR, we treated mTOR knockdown MDA-MB-231 cells with notch inhibitor. Indeed, the effect of notch inhibitor was completely abrogated, upon mTOR knockdown, in CSC-like cells (). Altogether, the Notch pathway modulates PD-L1 overexpression through mTOR activity.
Since Notch3 was the only receptor that modulated PD-L1 expression we tested whether notch3 specifically could modulate mTOR activity. Therefore, the phosphorylation of the mTOR downstream target (S6) was tested upon notch3 knockdown in the presence or absence of notch inhibitor. Indeed, there was a decrease in S6 phosphorylation with Notch3 knockdown or treatment with a notch inhibitor. The effect of notch inhibitor was totally abrogated in notch3 knockdown cells (a&b).
Figure 6. Notch3 upregulates PD-L1 through mTOR pathway. a) Bar graph showing the expression level (measured as MFI) of phosphorylated (S235/236) ribosomal protein S6 of MDA-MB-231 cells upon treatment with notch inhibitor II (RO4929097) in Notch3 knockdown (Si-Notch3) or scrambled control SiRNA (Si-Cont) as measured by immunofluorescence and quantified using BD pathway 855 system. b) Representative immunofluorescence images of cells (at x200 magnification) from one of the replicates in A
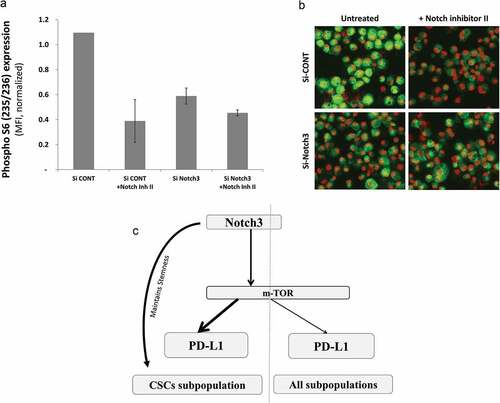
Altogether, Notch3 activation that is important for maintaining the stemness of CSC-like cells, upregulates PD-L1 expression by modulating mTOR activity ().
Discussion
It is believed that resistance to therapy and tumor reoccurrence is due to the presence of a subpopulation of cells within the tumor known as CSCs. PD-L1 expression on CSCs and other different subpopulations of breast cancer cells has not been well-studied. Results in this study showed for the first time that PD-L1 is overexpressed in breast CSCs as compared to their differentiated counterparts. PD-L1 overexpression on CSCs was partly due to Notch3/mTOR signaling pathway activation.
Several studies have showed PD-L1 overexpression in CSCs. PD-L1 is overexpressed on CD44 positive cells in head and neck squamous cell carcinoma,Citation16 while Yupeng et al. group has also showed PD-L1 overexpression on gastric CSCs.Citation17 In prior studies, PD-L1 has been shown to be overexpressed on melanoma and glioma CSCs.Citation18,Citation19 Just very recently PD-L1 expression in breast CSCs has got such attention. To this end, we have studied PD-L1 expression in the different subpopulations of unmanipulated breast cancer cells. Our results show that while Notch and PI3K/AKT pathways regulate PD-L1 on CSCs, MAPK/ERK pathway regulate PD-L1 expression on both CSCs and differentiated-like cells with a more pronounced effect on differentiated-like cells.
There are multiple demonstrated markers for breast CSCs. We have shown that PD-L1 correlated with Ep-CAM+/CD44high/CD24lowCitation20 as well as Ep-CAM+/CD90+ CSC-like cells.Citation11 While ALDHhi cells are commonly used to enrich for breast CSCs,Citation21 we did not see a significant increase in PD-L1 expression in ALDHhi cells (data not shown). Recently, it has been proposed that CSCs are heterogeneous with multiple types and different EMT status.Citation22,Citation23 Our results suggested that PD-L1 correlate with more mesenchymal-like CSCs rather than epithelial-like CSCs. This is consistent with lack of correlation with Ep-CAM expression and previous findings, including ours, showing PD-L1 upregulation upon EMT.Citation8,Citation9
Several CSC related pathways have been proposed to maintain the stemness and self-renewability of breast cancer cells including Notch, Wnt, and hedgehog pathways. It is well-established that the notch pathway activation contribute to the stemness of breast CSCs.Citation24–Citation26 Based on our findings, such activation drives PD-L1 expression and maintains the stemness of these cells. Similar relationship between Notch pathway and PD-1, a receptor for PD-L1 on lymphocytes, has been reported previously in septic shock patients, where inhibition of Notch pathway significantly decreased PD-1 expressions.Citation27 Moreover, it has been shown that Notch is required for PD-1 upregulation during CD8 + T-cell activation.Citation28 Likewise, PD-L1 was upregulated through a notch in human primary monocytes.Citation29 In this study, we showed for the first time that Notch signaling pathway is critical for PD-L1 expression on breast CSCs.
While writing this manuscript, Castagnoli et al.Citation30 and Hsu et al.Citation31 reported a role for Wnt signaling in regulating PD-L1 expression on breast CSCs. We did not see such an effect of the Wnt pathway on PD-L1 expression in our model of CSCs when we used the inhibitor ICG-001, which is supposed to block the Wnt pathway downstream by preventing the CBP/β-catenin activation. It is possible that PD-L1 is regulated by non-CBP regulated β-catenin mediated Wnt pathway activation as knocking down beta-catenin in these cells did not alter PD-L1 expression (data not shown).
Notch pathway has four receptors, Notch1, Notch2, Notch3, and Notch4 expressed on “receiver” cells, which bind to ligands (DLL1, DLL3, DLL4, Jagged1, or Jagged2) on adjacent “sender” cells. Activation of different Notch receptors could have different downstream effects.Citation32 Our results showed that only downregulating the expression of Notch3 decrease the expression of PD-L1 in breast cancer cells. Interestingly, both Notch3 and PD-L1 are associated with higher cell proliferationCitation33-Citation35 as well as interaction with PI3K/AKT/mTOR pathway.Citation10,Citation36
There is strong evidence for notch3 relationship with stemness. In the human breast, Notch3 expression was found in highly clonogenic as well as transiently quiescent mammary luminal progenitor cells.Citation37 Moreover, Notch3 was found to control the self-renewal of mammosphere forming stem/progenitor cells.Citation38 In breast cancer, Notch3 expression controls the self-renewal and therapy resistance of metastatic breast cancer cells. Our results are consistent with above-mentioned studies and showed a decrease in tumorsphere forming ability upon notch3 knockdown (supplementary figure 9). Clinically, aberrant Notch3 expression is linked to shorter overall survival in claudin-low breast cancer.Citation39 In addition, there is emerging evidence that Notch signaling blockage is necessary in combination with PI3K/AKT or EGR pathway inhibitors for better eradication of CSCs and avoidance of therapy resistance.Citation40,Citation41 Multiple Notch targeting therapeutic agents are available including Tarextumab, which targets both Notch2 and Notch3.Citation42 However, Notch2 has a positive anti-tumor immune-boosting effect in CD8 T-cellsCitation43 and its expression on dendritic cells is important for their survival.Citation44 On the other hand, Notch3 induces regulatory T-cell generationCitation44 and therefore it is possible that agents able to selectively target Notch3 would be more successful in the treatment of cancer.
Non-canonical Notch signaling has been well described in cancer and immunity, to trigger cascades like PI3K/AKT/mTOR pathway (Reviewed inCitation45). Our findings that notch activity is dependent on active mTOR is consistent with several types of cancers, where notch signals were demonstrated to go through the mTOR pathway. For instance, it has been shown that notch signals positively regulate activity of mTOR in T-cell leukemia.Citation18 This study is consistent with our findings showing decreased mTOR signaling with Notch inhibitor (,). More specifically, mTOR was inhibited when notch3 was silenced. Notch3 has been shown to drive the development and progression of cholangiocarcinoma through PI3/AKT/mTOR pathway.Citation46 In breast cancer, notch3 plays a crucial role in the proliferation of Her2/neu negative breast cancer cells.Citation33,Citation35 On the other hand, our data is consistent with Hsu et al.Citation31 in terms of PD-L1 expression on CSCs being regulated through posttranscriptional regulation. Indeed, mTOR is well known to regulate the expression of PD-L1 on posttranscriptional level.Citation15
Previous data shows Jag1 being an important ligand for notch3 signaling in breast cancer,Citation35 which is consistent with our observed increase in Jag1 in PD-L1hi compared to PD-L1lo breast cancer cells. Indeed, there is evidence that Jag1 activation of notch3 upregulates Jag1 expression to reinforce further notch signaling.Citation47 Moreover, notch induced upregulation of Jag1, but not DLL, leads to the formation of cells that works as both sender and receiver (S/R hybrid) leading to the expansion of CSCs in non-cell autonomous manner.Citation48 This is consistent with our finding showing both notch3 and Jag1 to be upregulated in PD-L1hi cell population. In fact, among notch ligands, Jag1 is believed to be a target for anti-tumor therapy as it maintains CSCs, promote cell survival, metastasis and indirectly affects tumor microenvironment (Reviewed in Li et al.Citation49).
How Notch3 specifically modulate mTOR activity is still not clear. In Leukemia, Notch1 modules PI3K/AKT/mTOR through PTEN.Citation18 In breast cancer, Notch 1&3 can regulate mTOR through IL-6/JAK/STAT-3 pathway.Citation50 In our study, silencing either IL-6 or STAT-3 did not inhibit PD-L1 expression in MDA-MB-231 (data not shown and , respectively). In cholangiocarcinoma, notch3 can module mTOR through its effect on PI3K/AKT pathway.Citation46 Importantly, in the current study only Notch3 upregulated PD-L1 expression in CSC-like cells, while Notch1 did not have any significant effect. Therefore, it is likely that a mechanism unique to Notch3 is involved in PD-L1 upregulation in breast cancer cells.
In conclusion, this report shows that PD-L1 is overexpressed on CSCs through Notch3/mTOR pathway which is also important for maintaining the stemness of these cells. This finding open the door for combinatorial targeting of PD-L1 and notch/mTOR axis for better treatment outcome.
Methods and materials
Cell culture and treatments
Cells lines were obtained from ATCC (USA) except SUM149PT (SUM149), which was obtained from Asterand (USA). MDA-MB-231 cells were cultured in DMEM medium while Hs578T, BT-549 and SUM-149 breast cancer cell lines were maintained in DMEM/F12 medium. Culture media were supplemented with 10% fetal bovine serum (FBS) and 1% Anti-biotic Anti-mycotic (ABM) (all from Invitrogen). For SUM149 cells, the medium was further supplemented with 5 μg/ml insulin and 500ng/ml hydrocortisone (Sigma). Regular mycoplasma screening was performed using a PCR-based kit (iNtRON, Korea) on each cell line to ensure that they were mycoplasma-free.
Inhibition of CSC related pathways was conducted using several established pathway inhibitors ().
Table 2. Cancer stem cell-related pathways inhibitors
Gene knockdown or overexpression
Notch3, c-Myc, STAT3, mTOR, and PD-L1 were knocked down using specific SiRNA (supplementary Table 1) and the transfection reagent Lipofectamine RNAiMAX reagent (Life technologies, USA) as per manufacturer’s instructions. Briefly, cells were plated 1 day before transfection in regular medium. Transfection was done in Optimum medium (Life technologies, USA) serum-free. Medium was supplemented with 8% serum 48 h after transfection. Cells were harvested 72 h after transfection.
STAT3 and c-Myc were also downregulated using specific ShRNA from OriGene (USA) in lentiviral vectors, (TL301348V, and TL311323V, respectively, using pGFP-C-ShLenti vector) as previously describedCitation9 (supplementary Table 2). Among the four plasmids (A, B, C, and D) provided by the company for each gene knockdown, plasmids (B) were the most effective in downregulating c-Myc and STAT3 in MDA-MB-231 cells (supplementary figure 11).
Notch3 was overexpressed by transfection with GFP-tagged Notch3 ORF in pCMV6-AC-GFP plasmid (cat# RG224711) obtained from Origene (Rochville, MD, USA). pCMV6-AC-GFP plasmid lacking the ORF (empty vector = EV) was used as a transfection control. Transfection was done using Lipofectamine LTX (Invitrogen, USA) and selection was done with G418 (Sigma, USA).
Flow cytometry and cell sorting
Breast cancer cell lines were harvested by trypsinization, washed with PBS and incubated for 30 min at 4°C with directly labeled antibodies (supplementary table 3). The CSC-like cell subpopulation was identified by gating initially on Ep-CAM+ cells followed by subgating on CD44high/CD24low cells.Citation51,Citation52 Differentiated-like cells were identified as CD44low/CD24low cells (Supplementary Figure 1). Alternatively, CD90high/Ep-CAM+ was used as an alternative phenotype for CSC-like cells and CD90low for differentiated-like cells. The level of PD-L1 in CSC-like cells was analyzed using LSR II flow cytometer and BD FACSDiva operating software (Becton Dickinson, Mountain View, CA).
PD-L1hi and PD-L1lo cells were sorted based on their PD-L1 expression (at least three times difference in fluorescence between the two populations) after gating for single viable cells using dapi (supplementary Figure 2). Cell sorting was performed using FACSAria (Becton Dickinson, Mountain View, CA).
Intracellular staining for Jag1 was done as per the manufacturer’s instructions (Cell signaling). Briefly, cells were fixed with formaldehyde for 15 min followed by permeabilization with ice-cold methanol for 10 min before washing with permeabilization buffer (ebioscience, USA) three times. Primary antibody was incubated for 1 h on ice followed by pacific blue labeled goat anti-rabbit antibody (Molecular Probes, USA).
RNA extraction, cdna synthesis, and real time-PCR
Sorted cells (PD-L1hi and PD-L1lo) were washed in 1 ml PBS by centrifugation (12,000 RPM) for 5 min at 4°C. RNA was then extracted from sorted cells using Qiagen RNeasy kit. Measuring PD-L1 mRNA level was performed to validate the sorting results. Gene expression measured by qPCR was performed using Predesigned TaqMan™ assays (supplementary table 4) and Applied Biosystems 7500 Fast detection system. The mRNA relative expression was measured relative to GAPDH, analyzed using 2−ΔΔCT equation and normalized against the control sample (PD-L1lo).Citation53
Tumorsphere formation assay
Cells were seeded in ultra-low attachment 96 well plates (flat bottom) at a density of 1000 cells/well in MEBM medium supplemented with 1% ABM, 2% B27, 20 ng/mL EGF, 500 ng/ml hydrocortisone and 5µg/ml insulin as previously described by Dontu et al.Citation54 Cells were then incubated at 37°C, CO2 incubator for 7 to 10 days. Tumorspheres were counted using digital inverted microscope (EVOS XL, Life Technologies, USA).
Western blotting
Western blotting was done as previously reported.Citation55 Briefly, 30–50 μg of protein was loaded on 10% SDS-PAGE gel. The Trans-Blot® Turbo™ transfer system was used to transfer proteins on a PVDF membrane (Bio-Rad®). Membrane was blocked in 5% skimmed milk prepared in 0.05% PBS-Tween20 for 45 min at room temperature. Membrane was washed and incubated with the desired primary antibody (all obtained from Cell Signaling) diluted in PBS-Tween-20 overnight at 4°C followed by HRP-conjugated secondary antibody, diluted in 1% skimmed milk and incubated for 1 h at room temperature. Chemiluminescence was used to detect the developed bands and images were detected using ImageQuant LAS 4000. Bands were quantified and analyzed using Quantity One Software.
Immunofluorescence
Immunofluorescence labeling was done as per the antibody provider instructions (cell signaling) as previously described in details.Citation10 Briefly, cytospin attached cells were air-dried and cells were fixed in 4% paraformaldehyde. Primary antibody was added overnight at 4ºC, followed by an appropriate Alexa conjugated secondary antibody. Cells were imaged using Zeiss Axioimager Z2 (Zeiss, Germany) before immunofluorescence quantitation using BD pathway 855 image analyzer (Becton Dickenson, USA).
Quantification of fluorescence intensity was done using BD pathway 855 system and a 20X objective (Olympus, NA 0.75) as previously described in details.Citation10 Briefly, pre-defined analysis protocols (macros) were formed using a montage of 3 × 3 which had at least 2000 cells per montaged image.
Mouse xenotransplantation studies
Animal work, including anesthesia and euthanasia, was done in accordance with protocols and ethics approved by the institutional animal care and use committee (IACUC). MDA-MB-231 breast cancer cells were sorted into PD-L1hi and PD-L1lo then injected into nude (NU/J) mice at three different dilutions 5, 100 and 500. Mice were monitored weekly for tumor formation or signs of weakness before they were sacrificed after 9 weeks of injection. Tumor volume was calculated as ½ (length × widthCitation2).
Statistical analysis
Student t-test was used to assess significance. * = p value <.05, ** = p value <.001. Error bars represented SEM.
Abbreviations
PD-L1: programmed death ligand-1; CSC-like: Cancer stem cell-like cells (identified by phenotype), CSCs: cancer stem cell
Author Contribution
FM: Collected and analyzed/Interpreted data (cell sorting, cell culture, mammosphere assays, cloning, western blot, and qPCR). AA: Collected and analyzed/Interpreted data (cell sorting and flow cytometry). MA: Performed data analysis and interpretation and edited the manuscript. HG (The principal investigator): Conceived and designed the study, collected and analyzed data, performed data analysis and interpretation, and wrote the manuscript. ALL authors read and approved the manuscript. All contributing authors approved the submission of this version of the manuscript and asserted that the document represents valid work. All contributing authors had no disclosures to make.
Disclosure of Potential Conflicts of Interest
All authors declare no conflict of interest.
Acknowledgments
This work was under an institutionally approved King Faisal Specialist Hospital and Research Centre project (RAC# 2140-001). We thankfully acknowledge the financial support of King Abdulaziz City for Science and Technology (KACST) for Fatmah A. Mansour graduate studies (M.Sc.) grant# 1-17-03-023-0004. We would like to thank Dr. Dilek Colak for some bioinformatics searches, Mr. Pulicant S. Manogaran for acquiring/analyzing some of the FACS data and Abdulrahman Al-Tabbaa for performing some preliminary experiments related to Notch SiRNA experiments.
Supplementary material
Supplemental data for this article can be accessed on the publisher’s website.
Additional information
Funding
References
- Siegel RL, Miller KD, Jemal A. Cancer statistics, 2019. CA Cancer J Clin. 2019;69:7-34.
- Schmid P, Adams S, Rugo HS, Schneeweiss A, Barrios CH, Iwata H, Diéras V, Hegg R, Im S-A, Shaw Wright G, et al. Atezolizumab and Nab-Paclitaxel in advanced triple-negative breast cancer. N Engl J Med. 2018;379:2108–11. doi:10.1056/NEJMoa1809615.
- Nicolini A, Giardino R, Carpi A, Ferrari P, Anselmi L, Colosimo S, Conte M, Fini M, Giavaresi G, Berti P, et al. Metastatic breast cancer: an updating. Biomed Pharmacother. 2006;60:548–556. doi:10.1016/j.biopha.2006.07.086.
- Mani SA, Guo W, Liao MJ, Eaton EN, Ayyanan A, Zhou AY, Brooks M, Reinhard F, Zhang CC, Shipitsin M, et al. The epithelial-mesenchymal transition generates cells with properties of stem cells. Cell. 2008;133:704–715. doi:10.1016/j.cell.2008.03.027.
- Ghebeh H, Al-Alwan M. Do cancer stem cells have an immunomodulatory role different from the bulk of tumor cells? Carcinog Mutagen. 2013;S14:1–5.
- Reiman JM, Knutson KL, Radisky DC. Immune promotion of epithelial-mesenchymal transition and generation of breast cancer stem cells. Cancer Res. 2010;70:3005–3008. doi:10.1158/0008-5472.CAN-09-4041.
- Akalay I, Janji B, Hasmim M, Noman MZ, Andre F, De Cremoux P, Bertheau P, Badoual C, Vielh P, Larsen AK, et al. Epithelial-to-mesenchymal transition and autophagy induction in breast carcinoma promote escape from T cell-mediated lysis. Cancer Res. 2013;73:2418–2427. doi:10.1158/0008-5472.CAN-12-2432.
- Dongre A, Rashidian M, Reinhardt F, Bagnato A, Keckesova Z, Ploegh HL, Weinberg RA. Epithelial-to-mesenchymal transition contributes to immunosuppression in breast carcinomas. Cancer Res. 2017;77:3982–3989. doi:10.1158/0008-5472.CAN-16-3292.
- Alsuliman A, Colak D, Al-Harazi O, Fitwi H, Tulbah A, Al-Tweigeri T, Al-Alwan M, Ghebeh H. Bidirectional crosstalk between PD-L1 expression and epithelial to mesenchymal transition: significance in claudin-low breast cancer cells. Mol Cancer. 2015;14:149. doi:10.1186/s12943-015-0421-2.
- Almozyan S, Colak D, Mansour F, Alaiya A, Al-Harazi O, Qattan A, Al-Mohanna F, Al-Alwan M, Ghebeh H. PD-L1 promotes OCT4 and Nanog expression in breast cancer stem cells by sustaining PI3K/AKT pathway activation. Int J Cancer. 2017;141:1402–1412. doi:10.1002/ijc.v141.7.
- Lu H, Clauser KR, Tam WL, Frose J, Ye X, Eaton EN, Reinhardt F, Donnenberg VS, Bhargava R, Carr SA, et al. A breast cancer stem cell niche supported by juxtacrine signalling from monocytes and macrophages. Nat Cell Biol. 2014;16:1105–1117. doi:10.1038/ncb3041.
- Chen CF, Dou XW, Liang YK, Lin HY, Bai JW, Zhang XX, Wei X-L, Li Y-C, Zhang G-J. Notch3 overexpression causes arrest of cell cycle progression by inducing Cdh1 expression in human breast cancer cells. Cell Cycle. 2016;15:432–440. doi:10.1080/15384101.2015.1127474.
- Casey SC, Tong L, Li Y, Do R, Walz S, Fitzgerald KN, Gouw AM, Baylot V, Gutgemann I, Eilers M, et al. MYC regulates the antitumor immune response through CD47 and PD-L1. Science. 2016;352:227–231. doi:10.1126/science.aac9935.
- Marzec M, Zhang Q, Goradia A, Raghunath PN, Liu X, Paessler M, Wang HY, Wysocka M, Cheng M, Ruggeri BA, et al. Oncogenic kinase NPM/ALK induces through STAT3 expression of immunosuppressive protein CD274 (PD-L1, B7-H1). Proc Natl Acad Sci U S A. 2008;105:20852–20857. doi:10.1073/pnas.0810958105.
- Parsa AT, Waldron JS, Panner A, Crane CA, Parney IF, Barry JJ, Cachola KE, Murray JC, Tihan T, Jensen MC, et al. Loss of tumor suppressor PTEN function increases B7-H1 expression and immunoresistance in glioma. Nat Med. 2007;13:84–88. doi:10.1038/nm1517.
- Lee Y, Shin JH, Longmire M, Wang H, Kohrt HE, Chang HY, Sunwoo JB. CD44+ cells in head and neck squamous cell carcinoma suppress T-cell-mediated immunity by selective constitutive and inducible expression of PD-L1. Clin Cancer Res. 2016;22:3571–3581. doi:10.1158/1078-0432.CCR-15-2665.
- Yang YP, Wu K, Zhao ED, Li W, Shi L, Xie GC, JIANG B, WANG Y, LI R, ZHANG P, et al. B7-H1 enhances proliferation ability of gastric cancer stem-like cells as a receptor. Oncol Lett. 2015;9:1833–1838. doi:10.3892/ol.2015.2949.
- Chan SM, Weng AP, Tibshirani R, Aster JC, Utz PJ. Notch signals positively regulate activity of the mTOR pathway in T-cell acute lymphoblastic leukemia. Blood. 2007;110:278–286. doi:10.1182/blood-2006-08-039883.
- Schatton T, Murphy GF, Frank NY, Yamaura K, Waaga-Gasser AM, Gasser M, Zhan Q, Jordan S, Duncan LM, Weishaupt C, et al. Identification of cells initiating human melanomas. Nature. 2008;451:345–349. doi:10.1038/nature06489.
- Al-Hajj M, Wicha MS, Benito-Hernandez A, Morrison SJ, Clarke MF. Prospective identification of tumorigenic breast cancer cells. Proc Natl Acad Sci U S A. 2003;100:3983–3988. doi:10.1073/pnas.0530291100.
- Ginestier C, Hur MH, Charafe-Jauffret E, Monville F, Dutcher J, Brown M, Jacquemier J, Viens P, Kleer CG, Liu S, et al. ALDH1 is a marker of normal and malignant human mammary stem cells and a predictor of poor clinical outcome. Cell Stem Cell. 2007;1:555–567. doi:10.1016/j.stem.2007.08.014.
- Bocci F, Jolly MK, George JT, Levine H, Onuchic JN. A mechanism-based computational model to capture the interconnections among epithelial-mesenchymal transition, cancer stem cells and Notch-Jagged signaling. Oncotarget. 2018;9:29906–29920. doi:10.18632/oncotarget.v9i52.
- Liu S, Cong Y, Wang D, Sun Y, Deng L, Liu Y, Martin-Trevino R, Shang L, McDermott S, Landis M, et al. Breast cancer stem cells transition between epithelial and mesenchymal states reflective of their normal counterparts. Stem Cell Rep. 2014;2:78–91. doi:10.1016/j.stemcr.2013.11.009.
- Bolos V, Mira E, Martinez-Poveda B, Luxan G, Canamero M, Martinez AC, Mañes S, de la Pompa JL. Notch activation stimulates migration of breast cancer cells and promotes tumor growth. Breast Cancer Res. 2013;15:R54. doi:10.1186/bcr3447.
- Farnie G, Clarke RB, Spence K, Pinnock N, Brennan K, Anderson NG, Bundred NJ. Novel cell culture technique for primary ductal carcinoma in situ: role of Notch and epidermal growth factor receptor signaling pathways. J Natl Cancer Inst. 2007;99:616–627. doi:10.1093/jnci/djk133.
- Stylianou S, Clarke RB, Brennan K. Aberrant activation of notch signaling in human breast cancer. Cancer Res. 2006;66:1517–1525. doi:10.1158/0008-5472.CAN-05-3054.
- Pan TT, Liu ZJ, Yin JY, Zhou TY, Liu JL, Qu HP. Notch signaling pathway was involved in regulating programmed cell death 1 expression during sepsis-induced immunosuppression. Mediat Inflamm. 2015;2015:1–9. doi:10.1155/2015/539841.
- Mathieu M, Cotta-Grand N, Daudelin JF, Thebault P, Labrecque N. Notch signaling regulates PD-1 expression during CD8(+) T-cell activation. Immunol Cell Biol. 2013;91:82–88. doi:10.1038/icb.2012.53.
- Hildebrand D, Uhle F, Sahin D, Krauser U, Weigand MA, Heeg K. The interplay of notch signaling and STAT3 in TLR-activated human primary monocytes. Front Cell Infect Microbiol. 2018;8:241. doi:10.3389/fcimb.2018.00241.
- Castagnoli L, Cancila V, Cordoba-Romero SL, Faraci S, Talarico G, Belmonte B, Iorio MV, Milani M, Volpari T, Chiodoni C, et al. WNT signaling modulates PD-L1 expression in the stem cell compartment of triple-negative breast cancer. Oncogene. 2019;38:4047–4060. doi:10.1038/s41388-019-0700-2.
- Hsu JM, Xia W, Hsu YH, Chan LC, Yu WH, Cha JH, Chen CT, Liao HW, Kuo CW, Khoo KH, et al. STT3-dependent PD-L1 accumulation on cancer stem cells promotes immune evasion. Nat Commun. 2018;9:1908. doi:10.1038/s41467-018-04313-6.
- Shi W, Harris AL. Notch signaling in breast cancer and tumor angiogenesis: cross-talk and therapeutic potentials. J Mammary Gland Biol Neoplasia. 2006;11:41–52. doi:10.1007/s10911-006-9011-7.
- Choy L, Hagenbeek TJ, Solon M, French D, Finkle D, Shelton A, Venook R, Brauer MJ, Siebel CW. Constitutive NOTCH3 signaling promotes the growth of basal breast cancers. Cancer Res. 2017;77:1439–1452. doi:10.1158/0008-5472.CAN-16-1022.
- Ghebeh H, Tulbah A, Mohammed S, Elkum N, Bin Amer SM, Al-Tweigeri T, Dermime S. Expression of B7-H1 in breast cancer patients is strongly associated with high proliferative Ki-67-expressing tumor cells. Int J Cancer. 2007;121:751–758. doi:10.1002/(ISSN)1097-0215.
- Yamaguchi N, Oyama T, Ito E, Satoh H, Azuma S, Hayashi M, Shimizu K, Honma R, Yanagisawa Y, Nishikawa A, et al. NOTCH3 signaling pathway plays crucial roles in the proliferation of ErbB2-negative human breast cancer cells. Cancer Res. 2008;68:1881–1888. doi:10.1158/0008-5472.CAN-07-1597.
- Guo S, Liu M, Gonzalez-Perez RR. Role of Notch and its oncogenic signaling crosstalk in breast cancer. Biochim Biophys Acta. 2011;1815:197–213. doi:10.1016/j.bbcan.2010.12.002.
- Lafkas D, Rodilla V, Huyghe M, Mourao L, Kiaris H, Fre S. Notch3 marks clonogenic mammary luminal progenitor cells in vivo. J Cell Biol. 2013;203:47–56. doi:10.1083/jcb.201307046.
- Sansone P, Storci G, Giovannini C, Pandolfi S, Pianetti S, Taffurelli M, Santini D, Ceccarelli C, Chieco P, Bonafé M, et al. p66Shc/Notch-3 interplay controls self-renewal and hypoxia survival in human stem/progenitor cells of the mammary gland expanded in vitro as mammospheres. Stem Cells. 2007;25:807–815. doi:10.1634/stemcells.2006-0442.
- Leontovich AA, Jalalirad M, Salisbury JL, Mills L, Haddox C, Schroeder M, Tuma A, Guicciardi ME, Zammataro L, Gambino MW, et al. NOTCH3 expression is linked to breast cancer seeding and distant metastasis. Breast Cancer Res. 2018;20:105. doi:10.1186/s13058-018-1020-0.
- Hu S, Fu W, Li T, Yuan Q, Wang F, Lv G, Lv Y, Fan X, Shen Y, Lin F, et al. Antagonism of EGFR and Notch limits resistance to EGFR inhibitors and radiation by decreasing tumor-initiating cell frequency. Sci Transl Med. 2017;9
- Fu W, Lei C, Yu Y, Liu S, Li T, Lin F, Fan X, Shen Y, Ding M, Tang Y, et al. EGFR/Notch antagonists enhance the response to inhibitors of the PI3K-Akt pathway by decreasing tumor-initiating cell frequency. Clin Cancer Res. 2019;25:2835–2847. doi:10.1158/1078-0432.CCR-18-2732.
- Yen WC, Fischer MM, Axelrod F, Bond C, Cain J, Cancilla B, Henner WR, Meisner R, Sato A, Shah J, et al. Targeting Notch signaling with a Notch2/Notch3 antagonist (tarextumab) inhibits tumor growth and decreases tumor-initiating cell frequency. Clin Cancer Res. 2015;21:2084–2095. doi:10.1158/1078-0432.CCR-14-2808.
- Sugimoto K, Maekawa Y, Kitamura A, Nishida J, Koyanagi A, Yagita H, Kojima H, Chiba S, Shimada M, Yasutomo K, et al. Notch2 signaling is required for potent antitumor immunity in vivo. The Journal of Immunology. 2010;184:4673–4678. doi:10.4049/jimmunol.0903661.
- Janghorban M, Xin L, Rosen JM, Zhang XH. Notch signaling as a regulator of the tumor immune response: to target or not to target? Front Immunol. 2018;9:1649.
- Ayaz F, Osborne BA. Non-canonical notch signaling in cancer and immunity. Front Oncol. 2014;4:345. doi:10.3389/fonc.2014.00345.
- Guest RV, Boulter L, Dwyer BJ, Kendall TJ, Man T-Y, Minnis-Lyons SE, Lu W-Y, Robson AJ, Gonzalez SF, Raven A, et al. Notch3 drives development and progression of cholangiocarcinoma. Proc Natl Acad Sci U S A. 2016;113:12250–12255. doi:10.1073/pnas.1600067113.
- Pelullo M, Quaranta R, Talora C, Checquolo S, Cialfi S, Felli MP, Te Kronnie G, Borga C, Besharat ZM, Palermo R, et al. Notch3/Jagged1 circuitry reinforces notch signaling and sustains T-ALL. Neoplasia. 2014;16:1007–1017. doi:10.1016/j.neo.2014.10.004.
- Boareto M, Jolly MK, Lu M, Onuchic JN, Clementi C, Ben-Jacob E. Jagged-delta asymmetry in Notch signaling can give rise to a sender/receiver hybrid phenotype. Proc Natl Acad Sci U S A. 2015;112:E402–9. doi:10.1073/pnas.1416287112.
- Li D, Masiero M, Banham AH, Harris AL. The notch ligand JAGGED1 as a target for anti-tumor therapy. Front Oncol. 2014;4:254. doi:10.3389/fonc.2014.00254.
- Jin S, Mutvei AP, Chivukula IV, Andersson ER, Ramskold D, Sandberg R, Lee KL, Kronqvist P, Mamaeva V, Östling P, et al. Non-canonical Notch signaling activates IL-6/JAK/STAT signaling in breast tumor cells and is controlled by p53 and IKKalpha/IKKbeta. Oncogene. 2013;32:4892–4902. doi:10.1038/onc.2012.517.
- Fillmore CM, Kuperwasser C. Human breast cancer cell lines contain stem-like cells that self-renew, give rise to phenotypically diverse progeny and survive chemotherapy. Breast Cancer Res. 2008;10:R25. doi:10.1186/bcr1982.
- Ghebeh H, Sleiman GM, Manogaran PS, Al-Mazrou A, Barhoush E, Al-Mohanna FH, Tulbah A, Al-Faqeeh K, Adra CN. Profiling of normal and malignant breast tissue show CD44high/CD24low phenotype as a predominant stem/progenitor marker when used in combination with Ep-CAM/CD49f markers. BMC Cancer. 2013;13:289. doi:10.1186/1471-2407-13-289.
- Livak KJ, Schmittgen TD. Analysis of relative gene expression data using real-time quantitative PCR and the 2(-Delta Delta C(T)) Method. Methods. 2001;25:402–408. doi:10.1006/meth.2001.1262.
- Dontu G, Abdallah WM, Foley JM, Jackson KW, Clarke MF, Kawamura MJ, Wicha MS. In vitro propagation and transcriptional profiling of human mammary stem/progenitor cells. Gene Dev. 2003;17:1253–1270. doi:10.1101/gad.1061803.
- Al-Alwan M, Olabi S, Ghebeh H, Barhoush E, Tulbah A, Al-Tweigeri T, Ajarim D, Adra C. Fascin is a key regulator of breast cancer invasion that acts via the modification of metastasis-associated molecules. PLoS One. 2011;6:e27339. doi:10.1371/journal.pone.0027339.