
ABSTRACT
Triple-negative breast cancer is the most aggressive subtype of breast cancer and is difficult to treat. Breast cancer is considered to be poorly immunogenic and hence is less responsive to immunotherapies. We tested whether the oncolytic poxvirus CF33-hNIS-ΔF14.5 could modulate tumor immune microenvironment and make the tumors responsive to the immune checkpoint inhibitor anti-PD-L1. We found that virus infection causes the upregulation of PD-L1 levels on triple-negative breast cancer cells in vitro as well as in vivo in mice. In a mouse model of orthotopic triple-negative breast cancer, the virus was found to increase tumor infiltration by CD8+ T cells. Likewise, in mice treated with CF33-hNIS-ΔF14.5 high levels of proinflammatory cytokines IFNγ and IL-6 were found in the tumors but not in the serum. The levels of immune modulation were even higher in mice that were treated with a combination of the virus and anti-PD-L1 antibody. While CF33-hNIS-ΔF14.5 and anti-PD-L1 antibody failed to exert significant anti-tumor effect as a single agent, a combination of the two agents resulted in significant anti-tumor effect with 50% mice experiencing complete tumor regression when both agents were injected intra-tumorally. Furthermore, the ‘cured’ mice did not develop tumor after re-challenge with the same cancer cells suggesting that they developed immunity against those cancer cells. Taken together, our study shows that CF33-hNIS-ΔF14.5 favorably modulates tumor immune microenvironment in triple-negative breast cancer model making them responsive to the immune checkpoint inhibitor anti-PD-L1, and hence warrants further studies to determine the clinical applicability of this combination therapy.
KEYWORDS:
Introduction
Breast cancer (BrCa) is the most common type of cancer in women and the leading cause of cancer-related death in women worldwide.Citation1 Surgery and radiation therapy are commonly used for the treatment of primary BrCa, while chemo- and hormone therapies are standard for the management of metastatic BrCa.Citation2 Treatment of this highly heterogeneous disease is challenging because of differential responses of BrCa subtypes and subpopulations to these therapies.Citation3 Triple-negative BrCa (TNBC), a subtype of BrCa lacking estrogen receptor, progesterone receptor and human epidermal growth factor receptor (HER2), has the poorest prognosis amongst all subtypes.Citation4 Despite an improvement in diagnosis and treatment, 5-year survival for metastatic BrCa is less than 30% and almost all patients with TNBC succumb to their disease,Citation5 therefore alternative therapeutics with better efficacy are urgently needed.
In the last 2 decades, the field of immunotherapy has seen major breakthroughs that have established immunotherapy as a major therapeutic approach for cancer. In particular, immune checkpoint inhibitors (ICIs) targeting CTLA-4 and PD1/PD-L1 have shown unprecedented long-lasting therapeutic efficacy in different types of malignancies.Citation6 However, despite these unprecedented long-lasting response rates, only a small fraction of patients benefit from ICIs.Citation6,Citation7 Anti-tumor efficacies of ICIs are mostly limited to tumors with T cell-inflamed tumor microenvironment (TME) also known as ‘immunologically hot’ tumors. Poorly immunogenic tumors with scarce T cells, also referred to as ‘immunologically cold’ tumors, are largely refractory to ICIs.Citation7–Citation9 Hence, a combination of ICI with other therapeutics that could potentially convert immunologically ‘cold’ TME to ‘hot’ may allow to harness the benefits of ICIs in a broader patient population.
Oncolytic viruses (OVs) are naturally occurring or genetically modified viruses that can selectively replicate in and kill cancer cells while sparing nonmalignant cells. In addition to direct cell killing by the virtue of cancer-selective replication, OVs exert indirect anti-neoplastic effect through the destruction of tumor vasculature as well as activation of innate and adaptive immune system.Citation10–Citation14 Traditionally, the field of oncolytic virotherapy was focused mostly on improving the replication potential of OVs based on the concept that direct killing of cancer cells by OVs is the main mechanism of action.Citation15 However, recent studies have shown that the success of OVs is as much as, or more, dependent on their immune-modulating capability as it is on their ability to directly kill cancer cells.Citation15–Citation19 OVs could modulate the immunological landscape in TME through a variety of different mechanisms.Citation20 For example, OVs have been shown to induce immunogenic cell death which plays an important role in the induction of adaptive immunity.Citation21–Citation23 Furthermore, OVs can modulate cytokine/chemokine in TME leading to increased tumor infiltration by CD8+ T cells and other immune cells.Citation9 However, CD8+ T cells within the TME may be blocked by cancer cells through checkpoint proteins such as PD-L1 in which case addition of ICIs should be helpful. Taken together, OVs have the potential to set the stage for ICIs and ICIs have the ability to allow an unperturbed activity of OV-activated anti-tumor immunity; hence, it is logical to surmise that OVs and ICIs may result in synergistic anti-tumor effect.
CF33-hNIS-ΔF14.5 is a chimeric poxvirus which has demonstrated strong oncolytic effect against several tumor models at relatively low doses.Citation21,Citation24-Citation26 We have previously reported that CF33-hNIS-ΔF14.5 induces immunogenic cell death and increases CD8+ T cells infiltration in tumors.Citation21 Here, we studied the therapeutic potential of CF33-hNIS-ΔF14.5 in combination with an anti-PD-L1 (α-PD-L1) antibody in a triple-negative breast cancer model.
Materials and methods
Cell lines
Human triple-negative breast cancer cells MDA-MB-468, Hs578T, and murine breast cancer cells 4T1 were purchased from American Type Culture Collection (Manassas, USA). The murine triple-negative breast cancer cells E0771 were a kind gift from Stephen J. Forman’s laboratory at City of Hope, Duarte, USA. All cells were cultured in RPMI-1640 medium supplemented with 10% fetal bovine serum, 2 mM L-glutamine and 100 U/ml penicillin-streptomycin. Cells were maintained in a humidified incubator at 5% CO2. Medium and supplements were purchased from Corning, NY, USA. All cells used in the study were mycoplasma free which was confirmed using MycoAlert Mycoplasma detection kit (Loza; Cat# LT7-218).
Virus proliferation and cytotoxicity assays
In order to determine the growth kinetics of the virus, cancer cells were seeded in 6 well plates at the density of 300000/well in 2 mL cell culture medium. Next day, cells were infected with the virus at multiplicity of infection (MOI) 0.03. Cell lysates were collected at 24-, 48- and 72-h post-infection and virus titer in the lysates were determined by standard plaque assay on CV1 cells as described previously.Citation21
To determine the cytotoxic potential of the virus, 3000 cells were seeded per well of 96-well culture plates in 100 uL cell culture medium. The following day, cells were either mock-infected or infected by CF33-hNIS-ΔF14.5 at MOIs 0.01, 0.1 or 1. After infection, plates were incubated for 72 h. Next, CellTiter96®AQueous (Promega) reagent was added to the cells and 1 h later absorbance was measured at 490 nm using a plate reader (Tecan Spark) as per the manufacturer’s instruction. Survival was calculated relative to mock-infected wells.
Virus and therapeutic αPD-L1 antibody
Construction of CF33 has been described previously.Citation21 The virus CF33-hNIS-ΔF14.5 is deleted of the genes J2R and F14.5L and it encodes human sodium iodide symporter (hNIS) gene. CF33-hNIS-ΔF14.5 was amplified in CV1 cells and purified on sucrose gradients. Mouse-specific α-PD-L1 antibody (Cat#BP0101; Clone 10F.9G2) was purchased from Bio X Cell (West Lebanon, NH, USA). We chose to use this antibody as Liu et al. have previously shown that this antibody works well in C57BL/6 mice.Citation27
Tumor model and treatment
All animal studies were conducted under City of Hope Institutional Animal Care and Use Committee approved protocol (IACUC#15003) in compliance with NIH’s guideline for the use of laboratory animals.
Female C57BL/6 mice, 4–6 weeks old, were purchased from Charles River and acclimatized for 1 week in a pathogen-free environment at City of Hope’s animal facility. To generate orthotopic tumors, E0771 cells were used. A total of 105 cells in 50 μL volume (PBS and matrigel 1:1) were injected in the abdominal mammary fat pad. One tumor per mouse was generated for tumor regression and survival studies whereas two tumors (bilateral orthotopic tumors) per mouse were generated for studies involving immune analysis. For a different tumor regression and survival study, bilateral tumors were generated by injecting 105 E0771 cells in right-side mammary fat pad and 2 × 10⁴ E0771 cells in left-side mammary fat pad. When tumors became palpable, mice were sorted into different treatment groups such that the average tumor volume in each group was similar. Mice were injected intra-tumorally with 107 PFU of CF33-hNIS-ΔF14.5 or 100 μg of α-PD-L1 either intra-tumorally or intra-peritoneally, as shown in the treatment schemes of respective figures, on each of experimental days 1, 3 and 5. Mice were weighed twice weekly and tumor volumes were measured twice weekly using digital calipers. During the entire experimental period, no overt toxicity was observed in any mouse and all mice continued to gain weight. Tumor volumes were calculated as described previously and mice were euthanized when tumors exceeded 2500 mm3 in volume.Citation21 For tumor re-challenge, mice that were tumor free for 30 days were injected with 105 E0771 cells in the abdominal mammary fat pad on the opposite side from the regressed tumors. Age-matched naïve mice were used as a control for the re-challenge study.
For immune analysis, mice bearing bilateral tumors were euthanized on day 7 after the first dose of treatment and their tumors and serum were harvested. One tumor was collected in PBS for flowcytometric analysis and the other tumor was divided into two halves. One half was weighed and snap-frozen in liquid nitrogen to be later used for cytokine analysis and the second half of tumors were collected in formalin for immunohistochemical (IHC) analysis. For FACS, harvested tumors were weighed, and single cells were generated using mouse tumor dissociation kit (Miltenyi Biotec; Cat# 130-096-730) and the GentleMACsTM dissociator (Miltenyi Biotec). Single cells were frozen in 90% FBS and 10% DMSO and stored at −80°C before staining for flowcytometric analysis.
Flow cytometry
Cells were infected with CF33-hNIS-ΔF14.5 at an MOI 3 or were mock-infected. Eighteen hours post-infection, cells were detached from the plates using 5 mM EDTA. Cells were washed twice with PBS and stained with α-PD-L1 antibody or isotype antibody. Cells were analyzed on BD AccuriTM C6 cytometer.
For analysis of immune cells in E0771 tumors, single cells from tumors that were frozen in 90% FBS and 10% DMSO and stored at −80°C were thawed. Cells were washed twice with PBS and stained with zombie UV fixable viability dye (BioLegend; Cat# 423108) for 30 min in PBS. Cells were washed once with PBS and then with FACS buffer (PBS supplemented with 2% FBS). Cells were blocked with α-CD16/32 antibody (BioLegend; Cat#101319, Clone 93) in FACS buffer for 10 min and then stained with PerCp/Cy5.5-conjugated CD45 antibody (BioLegend; Cat# 103131, Clone: 30-F11), VioGreen-conjugated CD8 antibody (Miltenyi Biotec; Cat# 130-109-252, Clone: REA601), FITC-conjugated CD4 antibody (BioLegend; Cat#130308, Clone: H129.19) and PE-conjugated PD-L1 antibody (BD Biosciences; Cat#558091, Clone: MIH5) for 30 min at 4°C in dark. In a separate staining panel, cells were stained for surface antigens and permeabilized using BD fix/perm kit (BD Biosciences; Cat#554714). After permeabilization cells were stained with APC-conjugated IFNγ antibody (BioLegend; Cat#505810, Clone: XMG1.2). After staining, cells were fixed with 4% paraformaldehyde for 15 min and data collected on BD LSRFortessa. FlowJo software (Tree Star Inc., OR, USA) was used to analyze the data.
Spleens from re-challenged mice were harvested at the end point and single cells were generated using spleen dissociation kit (Miltenyi Biotec; Cat# 130-095-926). Next, CD3 + T cells were isolated using EasySep mouse T cell isolation kit (StemCell technologies; Cat# 19851) following manufacturer’s protocol. CD3 cells were re-stimulated with the target cells (E0771 cells treated with 25 μg/mL mitomycin C for 30 min). Briefly, 105 T cells were plated in a 96-well round-bottom plate in 100 μL RPMI. Equal number of target cells in 100 μL RPMI were added to wells containing T cells. Cells were incubated for 48 h. After 48 h, cells were washed and fresh medium containing 105 target cells and antibody against CD107 (BioLegend; Cat#121613, Clone 1D4B) were added to the T cells containing wells. Cells were incubated for additional 5 h. Next, cells were stained with zombie UV fixable viability dye (BioLegend; Cat# 423108) followed by staining with CD8 antibody (BioLegend; Cat#100707, Clone 53–6,7). Finally, cells were analysed on BD LSRFortessa, live cells were gated and then CD8+ T cells positive for CD107 marker were calculated.
Immunohistochemical analysis
Tumors were fixed in formalin for 48 h, embedded in paraffin and sliced into 5 µm thin sections. Prior to staining, tumor sections were deparaffinized and rehydrated, after which heat-mediated antigen retrieval was performed as previously described.Citation28 Endogenous peroxidase was quenched by incubating the slides in 10% freshly prepared H2O2 for 10 min. Sections were blocked with TNB blocking buffer (PerkinElmer; Cat#FP1020), and then incubated with rabbit anti-CD8 antibody (Abcam; Cat#ab209775, Clone: EPR20305) or rabbit anti-CD4 antibody (Abcam; Cat#ab183685, Clone: EPR19514) or rabbit anti-PD-L1 antibody (Cell Signaling Technology; Cat#64988, Clone: D5V3B) overnight at 4°C. The following day, sections were washed and treated for 1 h at room temperature with HRP-conjugated polyclonal goat anti-rabbit antibody (Abcam; Cat#ab6721). Next, sections were washed, and brown color was developed using DAB substrate kit (Abcam; Cat#ab64238) following the manufacturer’s protocol. Finally, slides were counterstained with hematoxylin (Sigma-Aldrich; MHS16-500), sections were dehydrated, and coverslips were applied using permount (Fisher Scientific; Cat#SP15-100) as a mounting medium.
Stained tumor sections were imaged using the whole slide imager NanoZoomer S360 (Hamamatsu, Japan). Images were analyzed and quantified using QuPath software. Necrotic areas were excluded for quantification purpose and data are presented as positive cells/mm2 of tumor section.
Cytokine measurement
Tumors were homogenized in lysis buffer (10 mM Trish-HCl pH 8.0, 150 mM NaCl, 1% NP-40, 10% glycerol, 5mM EDTA and 1x protease inhibitors). Tumors were lysed in volumes 5 times their weight, for example, 200 μg of tumor was lysed in a total volume of 1 mL lysis buffer. Lysates were briefly sonicated in a water bath sonicator and spun down at 14000 g for 15 min at 4°C. Supernatants were transferred to new tubes and 25 μL from each sample was used to determine cytokines concentration using LEGENDplex Mouse Th CytoKine Panel kit (Cat#740741; BioLegend) following manufacturer’s instruction. Likewise, blood was collected by cardiac puncture at the time of euthanizing the mice. Serum was collected from the blood samples and 2 fold diluted serum was used to determine cytokines concentration using LEGENDplex Mouse Th CytoKine Panel kit (Cat#740741; BioLegend) following manufacturer’s instruction. Samples were run in duplicate. BD AccuriTM C6 flowcytometer was used to acquire data and data analysis was performed using LegendPlex software.
Statistical analysis
For comparing the means of more than two groups one-way ANOVA was used with a 95% confidence interval. P-values <0.05 were deemed significant. Tumor growth curve (average tumor volume) for different treatment groups was compared using two-way ANOVA with Dunnett’s test. Survival studies were analyzed for statistical significance using the log-rank Mantel–Cox test. Studies involving tumor regression and survival in mice were performed on n = 7–8 mice per treatment group so as to obtain reasonable statistical value. GraphPad Prism 5 Software (GraphPad Software, La Jolla, CA, USA) was used to calculate statistical values.
Results
Breast cancer cells upregulate PD-L1 expression after infection with CF33-hNIS-ΔF14.5
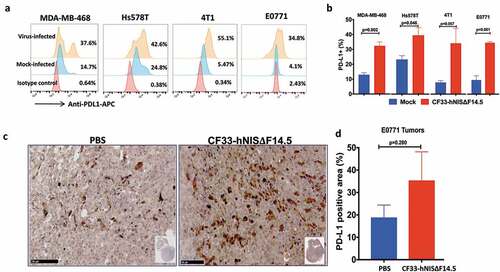
In order to investigate the effect of virus infection on PD-L1 expression in triple-negative breast cancer, we infected human TNBC (MDA-MB-468 and Hs578T) and murine TNBC cells (4T1 and E0771) with CF33-hNIS-ΔF14.5 at MOI 3 or mock-infected. Eighteen hours post-infection cells were analyzed for PD-L1 levels on cell surface. Basal levels of PD-L1 were found to be low in murine cell lines (~5% cells were positive) whereas in human cell lines basal levels were higher (~15% for MDA-MB-468 and ~25% for Hs578T). However, post-virus infection all cell lines demonstrated an increase in the PD-L1 expression (,). Furthermore, to determine if this holds true for in vivo condition, mice bearing E0771 orthotopic tumors were injected intra-tumorally with PBS or CF33-hNIS-ΔF14.5 and 7 days later tumor sections were stained for PD-L1. Higher levels of PD-L1 were observed in the virus-treated tumors compared to PBS-treated tumors ()). However, due to higher variation within the groups, the difference in PD-L1 levels did not reach statistical significance ()).
Figure 1. Breast cancer cells up-regulate PD-L1 in response to infection by CF33-hNIS-ΔF14.5. (a) Cells were mock-infected or infected with CF33-hNIS-ΔF14.5 at MOI 3. Eighteen hours post-infection, cells were stained with APC-conjugated PD-L1 antibody or an isotype antibody and analyzed by flowcytometry. (b) Cells were infected and PD-L1 levels determined as in (a) and mean of three independent experiments ± SEM has been plotted. p values were calculated using Student’s t-test. (c) C57BL/6 mice (n = 4/group) bearing orthotopic E0771 tumors were intra-tumorally injected with PBS or 107 PFU of virus on days 1, 3 and 5. On day 7, tumors were harvested and stained for PD-L1 as described in materials and methods. (d) Area in the tumor sections that stained positive for PD-L1 was calculated using QuPath software and compared between the two groups (n = 4/group). Data presented as mean ± SEM. p value was calculated using Student’s t-test
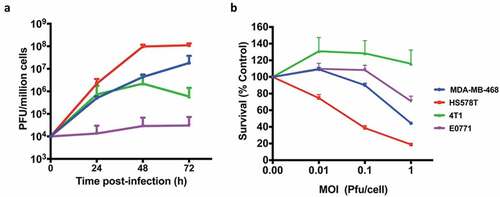
We also compared virus growth and resulting cytotoxicity in human and murine TNBCs. Not surprisingly, murine TNBCs were found to be less susceptible to the virus compared to the human TNBCs. Murine TNBCs supported little to no growth of the virus whereas human TNBCs highly supported the growth of the virus with approximately 4 logs increase in virus titers 72 h post-infection ()). Commensurate with the virus growth, human TNBCs were more susceptible to virus-mediated killing compared to the murine TNBCs ()). We have previously reported similar finding showing discrepancies in growth and cytotoxic ability of CF33 in other human and murine cancer cell lines.Citation21
Figure 2. Growth kinetics and Cytotoxicity. (a) human BrCa (MDA-MB-468 and Hs578T) and mouse BrCa (4T1 and E0771) cells were infected with CF33-hNIS-ΔF14.5 at an MOI of 0.03 and virus titers in cell lysates were determined by plaque assay at indicated time points. (b) Cells were infected at indicated MOIs of CF33-hNIS-ΔF14.5 and cell survival relative to mock-infected cells were determined 72 h post-infection. Data presented as mean of three independent experiments with SEM
CF33-hNIS-ΔF14.5 in combination with αPD-L1 shows synergistic anti-tumor effect when both agents are injected intra-tumorally
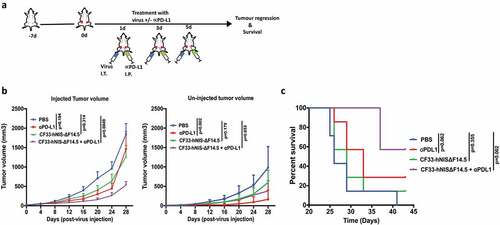
Since all the tested TNBCs showed up-regulation of PD-L1 in response to virus infection, we hypothesized that a combination of CF33-hNIS-ΔF14.5 with an inhibitor of the PD-L1 will increase the overall therapeutic efficacy. To test the therapeutic effect of the combination we used E0771 syngeneic tumor model because this model has been well characterized as murine TNBC; it is negative for ER, PR and HER2 and has mutated p53.Citation29–Citation31 Furthermore, although E0771 cells make aggressive tumors, in our experience E0771 tumors provide somewhat longer therapeutic time window compared to the extremely aggressive 4T1 murine TNBC model. E0771 cells were used to generate bilateral orthotopic tumors in C57BL/6 mice and after the tumors became palpable mice were treated with PBS or α-PD-L1 antibody or CF33-hNIS-ΔF14.5 or a combination of CF33-hNIS-ΔF14.5 and αPD-L1. Only one tumor/mouse was injected with the virus and the other tumor (smaller tumor) was left un-injected. For this experiment virus was injected intra-tumorally and α-PD-L1 antibody was injected intra-peritoneally on each of the experimental days 1, 3 and 5 as shown in the treatment scheme ()). For the injected tumors, the combination group significantly delayed tumor growth compared to the PBS control group whereas no significant difference was observed for single treatment groups (virus or α-PD-L1) compared to PBS group ()). Growth kinetics of the uninjected tumors looked more or less similar for single and combination treatment groups, however, compared to PBS group statistical significance was achieved only for α-PD-L1 treated group ()). Mice were euthanized based on tumor burden and survival graph was plotted. In terms of survival, only the combination treatment significantly increased survival of mice compared to PBS-treated mice whereas survival benefits for mice treated with single agents did not reach statistical significance ()).
Figure 3. Combination of CF33-hNIS-ΔF14.5 (i.t.) with αPD-L1 (i.p.) delays tumor growth and increases survival of mice. (a) Treament scheme showing timing and routes of treatment. Bilateral tumors were generated in abdominal mammary fat pads of C57BL/6 mice by injecting 105 E0771 cells on one side and 2 × 10⁴ E0771 cells on the other side. Only one tumor/mouse (larger tumor) was injected with 107 PFU of virus and the other (smaller) tumor was left un-injected. αPD-L1 Ab (100 µg) was injected intra-peritoneally. Treatments (n = 7 mice/group) were given on each of experimental days 1, 3 and 5. (b) Average tumor volume for virus-injected and un-injected tumors at different time points with SEM has been plotted and compared. p values were calculated using Two-way ANOVA with Dunnett's test. (c) Mice were euthanized when tumor volume exceeded 2500 mm3 and survival of mice among the treatment groups was compared using log-rank Mantel–Cox test
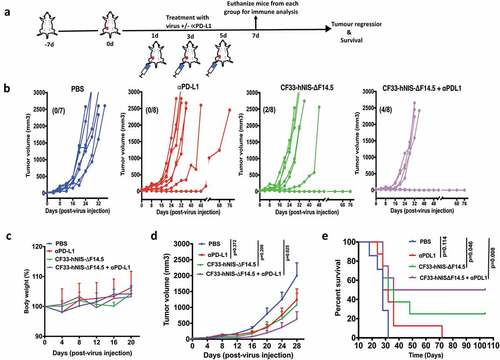
We also studied the combination in a separate experiment in which both α-PD-L1 and the virus were injected intra-tumorally. Mice bearing orthotopic E0771 tumor (one tumor/mouse) were injected intra-tumorally with α-PD-L1 or CF33-hNIS-ΔF14.5 or both on each of the experimental days 1, 3 and 5 ()). All PBS-treated mice had to be euthanized within 32 days due to tumor burden ()). Similarly, six out of eight α-PD-L1-treated mice had to be euthanized within the same time period, two mice showed delayed tumor growth and survived longer. However, in the CF33-hNIS-ΔF14.5-treated group 2 out of 8 mice showed complete tumor regression. Interestingly, 50% of mice (4 out of 8) treated with the combination of CF33-hNIS-ΔF14.5 and α-PD-L1 showed no response whereas the other 50% mice achieved complete tumor regression ()). No overt toxicities or weight loss were seen in mice in any of the treatment groups ()). Average tumor volume for either of the single treatment group was not significantly different from that for the PBS group whereas the combination group had significantly lower tumor volume compared to the PBS group ()). More importantly, the combination treatment showed the highest increase in the survival of the mice ()). Taken together, CF33-hNIS-ΔF14.5 and α-PD-L1 showed minimal anti-tumor effect in E0771 model when used as a single agent; however, their combination resulted in significant anti-tumor effect and prolonged survival of the treated mice, and the anti-tumor efficacy was more pronounced when both treatment agents were administered intra-tumorally.
Figure 4. Combination of CF33-hNIS-ΔF14.5 with intra-tumoral injection of αPD-L1 results in synergistic anti-tumor effect. (a) Experimental scheme. Mice bearing single orthotopic E0771 tumors (n=7 mice for PBS group and 8 for all other groups) were treated with PBS or CF33-hNIS-ΔF14.5 (107 PFU) or α-PD-L1 Ab (100 µg) or combination of CF33-hNIS-ΔF14.5 and α-PD-L1 on each of experimental days 1, 3 and 5. All treatments were given intra-tumorally. (b) Tumor volumes in different treatment groups have been plotted. Each line represents tumor volume of an individual mouse. Numbers in parentheses indicate the number of mice that achieved complete tumor regression. (c) Per cent body weight for each treatment groups has been plotted with SEM. (d) Average tumor volume at different time points with SEM has been plotted and compared. Stats: Two-way ANOVA with Dunnett's test. (e) Mice were euthanized when tumor volume exceeded 2500 mm3 and survival of mice among the treatment groups was compared. Stats: log-rank Mantel–Cox test
Immune modulation by CF33-hNIS-ΔF14.5 in TME
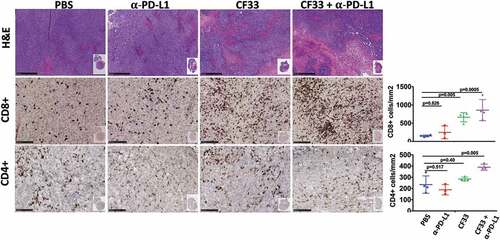
Tumors treated intra-tumorally with CF33-hNIS-ΔF14.5 alone or in combination with αPD-L1 antibody were found to have higher levels of immune cells (CD45+) compared to PBS-treated tumors on day 7 after the first dose of treatment ()). Massive infiltration of CD8+ T cells was observed in the tumors treated with CF33-hNIS-ΔF14.5 alone or in combination with αPD-L1 antibody () & ). However, there was no significant difference in the levels of CD8+ T cells in PBS and αPD-L1-treated mice. We also analyzed CD8+ T cells for their activation status using IFNγ staining. CF33-hNIS-ΔF14.5-treated tumors showed a trend of higher IFNγ+ CD8 + T cells however this increase did not reach statistical significance compared to PBS-treated tumors. Among all the treatment groups only the combination treatment resulted in significantly higher numbers of IFNγ+ CD8+ T cells compared to the PBS group. While there was a trend of higher CD4+ T cells in the combination treatment group compared to that in the PBS group, the difference was not significant due to high variation within the PBS group ()). Next, we also performed IHC staining on tumor sections and quantified CD4+ and CD8+ T cells to verify the results from FACS analysis. Whole tumor sections were scanned, and quantification was performed using QuPath software. Results from IHCs were found to be similar to the results from FACS analysis ().
Figure 5. Favorable modulation of tumor immune microenvironment by CF33-hNIS-ΔF14.5. E0771 tumor-bearing mice were treated as in and tumors were harvested 7 days after the first dose of treatment and single cells were prepared (n = 4 mice/group). Cells were stained for surface markers (CD45, CD8, CD4 and PD-L1) and intracellular protein (IFNy) following live/dead staining. (a) A flow diagram showing gating strategy. (b) Comparison of different immune cell population and PD-L1 levels (on nonimmune cells, CD45-) among different treatment groups. p values were calculated using one-way ANOVA
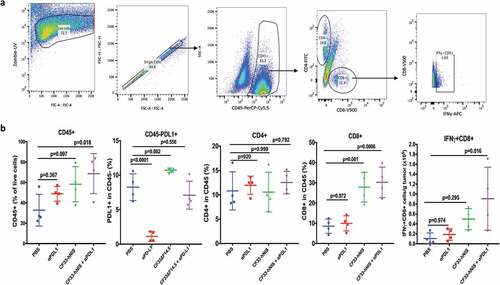
Figure 6. Favorable modulation of tumor immune microenvironment by CF33-hNIS-ΔF14.5. E0771 tumors that were treated as in were harvested 7 days after the first dose of treatment and fixed in formalin. Tumor sections were stained with H&E to visualize tumor morphology (pictures shown at 5X magnification; scale bar = 500 μm). Immunohistochemical analyses were performed to visualize CD4+ or CD8 + T cells (pictures shown at 20X magnification; Scale bar = 100 μm). Whole tumor sections were scanned, and targets were quantified using QuPath software. Necrotic areas were excluded for the quantification of CD4 and CD8 T cells. Stats: One-Way ANOVA
Combination treatment elevates pro-inflammatory cytokines in TME but not in serum
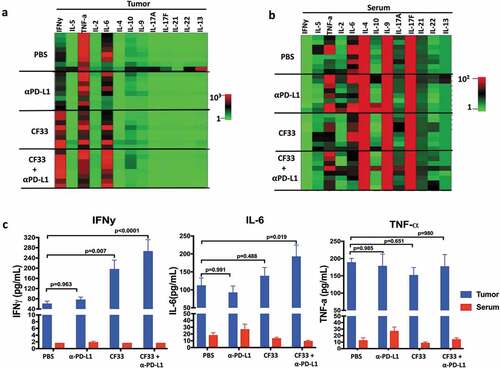
In TME, cytokines are secreted mainly by immune cells and stromal cells.Citation32 Cytokines play important roles in the proliferation, differentiation, activation and migration of immune cells.Citation32 In order to determine the effect of treatments on cytokine in the TME, we measured the levels of different cytokines in tumor lysates 7 days after the first dose of treatment. We used a kit that could simultaneously measure 13 cytokines (IFNγ, IL-5, TNFα, IL-2, IL-6, IL-10, IL-9, IL-17A, I-17F, IL-21, IL-22 and IL-13), which are collectively secreted by Th1, Th2, Th9, Th17, Th22 and T follicular cells.Citation33 Out of the 13 cytokines analyzed, only two cytokines IL-6 and IFNγ were found to be significantly different among the treatment groups (,). Compared to the PBS group, levels of IL-6 were found to be significantly higher only in the combination group but the levels of IFNγ were found to be significantly higher both in the CF33-hNIS-ΔF14.5 treatment group and the combination treatment group. We also measured the levels of those 13 cytokines in the serum of the treated mice ()). Interestingly, there was no significant difference in the levels of any cytokines among the treatment groups suggesting that the effect of treatments on cytokine levels was mostly confined to the TME. Levels of the pro-inflammatory cytokines IFNy, IL-6 and TNF-a were much lower in serum compared to those in the TME ()).
Figure 7. CF33-hNIS-ΔF14.5 in combination with αPD-L1 increases pro-inflammatory cytokines in TME but not in serum. E0771 tumors were treated as in and tumors as well as serum were harvested 7 days after treatment. Tumors were homogenized to obtain tumor lysates. A multiplex bead-based assay was used to quantify 13 cytokines in the tumor lysates. (a) Heat-map showing all the 13 cytokines in the tumor lysates in the 4 treatment groups (n = 4 mice/group). (b) Heat-map showing all the 13 cytokines in the serum of the mice. Samples were analyzed in duplicates. (c) Mean concentration of IFNy, IL-6 and TNF-a in tumor lysates and serum have been plotted with SEM. One-Way ANOVA was used to calculate p values. Note: color scales for Tumor (Figure (a)) and Serum (Figure (b)) are different
CF33-hNIS-Δ14.5 alone or in combination with αPD-L1 induces anti-tumor immunity in treated mice
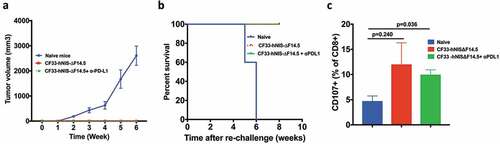
Immunotherapy often results in the induction of anti-tumor immunity in responding subjects thus providing long-term protection against the malignancy. In pre-clinical models, ‘tumor re-challenge’ is considered the gold standard test for the development of anti-tumor immunity, in which animals with complete tumor-regression are re-injected with the same tumor cells.Citation34–Citation38 Existence of immunity against those tumor cells would prevent tumor development whereas animals lacking specific immunity against the tumor cells would develop tumors. We performed ‘tumor re-challenge’ experiments to determine if the ‘cured’ mice had developed anti-tumor immunity. Age-matched naïve mice were used as control. Mice were injected with E0771 cells in the mammary fat pad (on opposite side) and were monitored for tumor growth. All naïve mice had palpable tumors 2 weeks after injection of cells and by 6 weeks all those mice had to be euthanized due to tumor burden (,). However, mice that were ‘cured’ of their tumors did not develop tumors upon re-challenge and continued to survive. To confirm E0771 tumor-specific immunity, splenocytes collected at the end of experiments were re-stimulated with E0771 cells and levels of CD107+ CD8 T cells were compared among naïve mice and the mice that were ‘cured’ of their tumors. Higher levels of CD107+ CD8 T cells were found in the ‘cured’ mice compared to that in the naïve mice ()). Together, these data suggest that the mice showing complete response to the therapy developed tumor-specific immunity.
Figure 8. Mice treated with CF33-hNIS-ΔF14.5 alone or in combination develop tumor-specific immunity. Mice that underwent complete tumor regression from , and remained tumor free for 30 days, were re-challenged with 105 E0771 cells in the abdominal mammary fat pad of opposite side. Age-matched naïve mice were used as control. (a) Tumor volumes were measured weekly and average tumor volumes have been plotted with SEM. Tumors were detected only in the naïve mice. (b) Mice were euthanized when their tumor exceeded 2500 mm3 in volume, and survival was compared using Kaplan–Meier survival plot. (c) CD3+ T cells were isolated from the mice at the end point and re-stimulated with E0771 cells. Cells were stained with antibodies against CD8 and CD107 and analyzed using flowcytometry. Per cent CD8+ T cells positive for CD107 marker have been plotted with SEM and compared among the groups. Stats: One-Way ANOVA
Discussion
Oncolytic viruses have shown promising results in multiple malignancies in preclinical and clinical studies. In addition to other modes of action, OVs stimulate anti-tumor immunity.Citation9,Citation39-Citation42 There are several mechanisms through which OVs could stimulate the immune system. First, oncolysis by OVs may release tumor-specific antigens leading to the activation of the adaptive immune system.Citation43–Citation46 Second, OVs could induce immunogenic death of cancer cells, which results in the activation of immune system against tumor cells.Citation22,Citation23 We have previously reported that CF33 induces immunogenic cell death in multiple tumor cell lines.Citation21,Citation26 In this study, we found that breast cancer cells, both human and murine, upregulate PD-L1 expression in response to infection by CF33-hNIS-ΔF14.5. This increase in the PD-L1 levels could be the consequence of virus-induced type-1 interferons. Our data is in congruence with a study published by Liu et al. which showed upregulation of PD-L1 in a panel of human and murine cell lines encompassing a variety of malignancies after infection with an oncolytic vaccinia virus.Citation27 The study by Liu et al. showed that the combination of an oncolytic vaccinia virus with αPD-L1 antibody results in synergistic anti-tumor effect in mouse models of colon and ovarian cancer. The fact that cancer cells upregulate PD-L1 expression in response to virus infection is of importance as several meta-analysis studies have shown that PD-L1 expression is of prognostic value in multiple types of cancer including TNBC and could help clinicians to discriminate patients who will and will not respond to therapeutics targeting PD-1/PD-L1 interaction.Citation47–Citation50
Recently there has been a growing interest in combining different types of OVs with ICIs to improve therapeutic efficacy.Citation41 A study published by Bourgeois-Daigneault et al. tested oncolytic Maraba virus in neo-adjuvant setting in TNBC models where they found that their OV sensitized the otherwise refractory tumors to ICIs.Citation51 Likewise, intravenous administration of reovirus followed by subsequent treatment with αPD-L1 increased the overall survival of mice bearing gliomas.Citation52 The same oncolytic reovirus was found to increase CD8+ T cells accumulation in the tumors of eight out of nine brain cancer patients after intravenous injection.Citation52 Furthermore, a clinical trial using the combination of T-VEC and αPD-L1 antibody in 21 patients with advanced melanoma showed a remarkable efficacy with an objective response rate of 62% and complete response in 33% of the patients.Citation53
We investigated whether our chimeric oncolytic poxvirus CF33-hNIS-ΔF14.5 could work better with αPD-L1 in a TNBC model. We have previously reported that CF33 is very potent against tumor cells of human origin cultured in vitro or xenografted in mice.Citation21,Citation24-Citation26,Citation54 As low as 103 PFUs of CF33 caused complete tumor regression in mice bearing xenograft tumors originated from different human cancer cell lines.Citation21,Citation26,Citation54 However, murine cancer cells seem to support little to no replication of CF33 in vitro and are less susceptible to CF33-mediated killing. Therefore, the use of murine syngeneic tumor model may not be ideal for studying the anti-tumor potential of CF33-hNIS-ΔF14.5. Any anti-tumor efficacy of CF33-hNIS-ΔF14.5 in the murine syngeneic model would be mostly due to the activation of immune system as the direct killing of murine cancer cells by CF33-hNIS-ΔF14.5 is minimal. Perhaps humanized mouse models may show more realistic anti-tumor potential of the CF33-hNIS-ΔF14.5; however, high expense associated with humanized mice kept us from using that model in this study. Nevertheless, CF33-hNIS-ΔF14.5 was found to favorably modulate immune cells and cytokines in the TME of E0771 syngeneic model and showed some anti-tumor efficacy with complete tumor regression in 2 out of 8 mice. CF33-hNIS-ΔF14.5 significantly increased tumor infiltration by CD8+ T cells and there was a trend of increased PD-L1 expression on nonimmune cells (CD45-) in virus-treated tumors. The checkpoint inhibitor αPD-L1 has been shown to work better in tumors with high levels of CD8+ T cells and high levels of PD-L1 on tumor cells.Citation53,Citation55,Citation56 Hence, we combined CF33-hNIS-Δ14.5 with αPD-L1 antibody and the combination resulted in much better anti-tumor efficacy compared to single treatment with either components. In this study, we injected virus intra-tumorally and the αPD-L1 antibody either intra-tumorally or intra-peritoneally. The reason for the intra-tumoral injection of the αPD-L1 antibody was to study the practicability of modifying our virus CF33-hNIS-ΔF14.5 to encode αPD-L1 antibody. Furthermore, since OVs could potentially evoke autoimmune responses, systemically delivered checkpoint inhibitors may result in higher levels of autoimmune side-effects.Citation41,Citation57,Citation58 Therefore, in context of the combination of OV and checkpoint inhibitors considering intra-tumoral injection of checkpoint inhibitor may not be unreasonable. Our data show that intra-tumoral injection of the virus alone or in combination with αPD-L1 antibody increases pro-inflammatory cytokines IFNy and IL-6 in TME but not in the serum. The fact that pro-inflammatory cytokines were increased only in tumors, and their levels were much lower in serum, suggests that the treatment specifically induces immunologically conducive or “hot” environment within the tumors. Interestingly, in our study the combination of CF33-hNIS-ΔF14.5 virus and αPD-L1 antibody worked better when both agents were delivered intra-tumorally compared to the combination where the virus was delivered intra-tumorally and the antibody was delivered intra-peritoneally. While the former combination resulted in complete tumor regression in 50% of treated mice, no complete tumor regression was achieved in any mouse in the later combination treatment. Also, in the later combination group using bilateral tumor model we found that while the virus-injected tumors showed significantly slower growth compared to the PBS group, the un-injected tumors despite slower growth did not reach statistical significance. Of note, in this study we have tested only one dose of virus (107 PFUs) and one dose of αPD-L1 antibody (100 μg), both of which are lower doses compared to doses used in previous studies. For example, most published studies have used 200 μg or higher doses of αPD-L1 antibodyCitation27,Citation59-Citation61 and/or 108 PFUs of oncolytic vaccinia virus in immune-competent mice.Citation27,Citation62,Citation63 Therefore, it is likely that better therapeutic efficacy could be achieved in the studied model if higher doses of the therapeutic agents are administered. Nevertheless, mice that underwent complete tumor regression after intra-tumoral treatment with CF33-hNIS-ΔF14.5 alone or the combination of CF33-hNIS-ΔF14.5 and αPD-L1 were protected from tumor development when re-challenged with E0771 cells, suggesting that those animals developed anti-tumor immunity against the tumor cells as a result of treatment. This finding was further confirmed by CD107 expression by splenic CD8+ T cells after restimulation with E0771 cells.
In summary, our data show that CF33-hNIS-ΔF14.5 increases PD-L1 levels on breast cancer cells and favorably modulates the immune landscape in E0771 tumors setting the stage for the activity of the immune checkpoint inhibitor αPD-L1. Hence, the combination of CF33-hNIS-ΔF14.5 with αPD-L1 showed better therapeutic efficacy in the studied tumor model. Addition of other checkpoint inhibitors such as anti-CTLA-4 may further enhance the overall anti-tumor efficacy.
Disclosure of Potential Conflicts of Interest
No potential conflicts of interest were disclosed.
Acknowledgments
Shyambabu Chaurasiya and Susane G. Warner are partly supported by fellowships from Natalie and David Roberts Foundation. These authors wish to thank the foundation for the fellowships.
Additional information
Funding
References
- Jemal A, Siegel R, Xu J, Ward E. Cancer statistics, 2010. CA Cancer J Clin. 2010;60:277–12. doi:10.3322/caac.20073.
- Higgins MJ, Wolff AC. Therapeutic options in the management of metastatic breast cancer. Oncology (Williston Park). 2008;22:614–23; discussion 23, 27–9.
- Polyak K. Heterogeneity in breast cancer. J Clin Invest. 2011;121:3786–3788. doi:10.1172/JCI60534.
- Hudis CA, Gianni L. Triple-negative breast cancer: an unmet medical need. Oncologist. 2011;16(Suppl 1):1–11. doi:10.1634/theoncologist.2011-S1-01.
- Bonotto M, Gerratana L, Poletto E, Driol P, Giangreco M, Russo S, Minisini AM, Andreetta C, Mansutti M, Pisa FE, et al. Measures of outcome in metastatic breast cancer: insights from a real-world scenario. Oncologist. 2014;19:608–615. doi:10.1634/theoncologist.2014-0002.
- Jenkins RW, Barbie DA, Flaherty KT. Mechanisms of resistance to immune checkpoint inhibitors. Br J Cancer. 2018;118:9–16. doi:10.1038/bjc.2017.434.
- Sharma P, Hu-Lieskovan S, Wargo JA, Ribas A. Primary, adaptive, and acquired resistance to cancer immunotherapy. Cell. 2017;168:707–723. doi:10.1016/j.cell.2017.01.017.
- Maleki Vareki S. High and low mutational burden tumors versus immunologically hot and cold tumors and response to immune checkpoint inhibitors. J Immunother Cancer. 2018;6:157. doi:10.1186/s40425-018-0479-7.
- Chaurasiya S, Chen NG, Fong Y. Oncolytic viruses and immunity. Curr Opin Immunol. 2018;51:83–90. doi:10.1016/j.coi.2018.03.008.
- Breitbach CJ, De Silva NS, Falls TJ, Aladl U, Evgin L, Paterson J, Sun YY, Roy DG, Rintoul JL, Daneshmand M, et al. Targeting tumor vasculature with an oncolytic virus. Mol Ther. 2011;19:886–894. doi:10.1038/mt.2011.26.
- Kirn DH, Thorne SH. Targeted and armed oncolytic poxviruses: a novel multi-mechanistic therapeutic class for cancer. Nat Rev Cancer. 2009;9:64–71. doi:10.1038/nrc2545.
- Guse K, Cerullo V, Hemminki A. Oncolytic vaccinia virus for the treatment of cancer. Expert Opin Biol Ther. 2011;11:595–608. doi:10.1517/14712598.2011.558838.
- Breitbach CJ, Paterson JM, Lemay CG, Falls TJ, McGuire A, Parato KA, Stojdl DF, Daneshmand M, Speth K, Kirn D, et al. Targeted inflammation during oncolytic virus therapy severely compromises tumor blood flow. Mol Ther. 2007;15:1686–1693. doi:10.1038/sj.mt.6300215.
- Gujar S, Bell J, Diallo JS. SnapShot: cancer immunotherapy with oncolytic viruses. Cell. 2019;176:1240- e1. doi:10.1016/j.cell.2019.01.051.
- Davola ME, Mossman KL. Oncolytic viruses: how “lytic” must they be for therapeutic efficacy? Oncoimmunology. 2019;8:e1581528. doi:10.1080/2162402X.2019.1596006.
- Sobol PT, Boudreau JE, Stephenson K, Wan Y, Lichty BD, Mossman KL. Adaptive antiviral immunity is a determinant of the therapeutic success of oncolytic virotherapy. Mol Ther. 2011;19:335–344. doi:10.1038/mt.2010.264.
- Dai P, Wang W, Yang N, Serna-Tamayo C, Ricca JM, Zamarin D, Shuman S, Merghoub T, Wolchok JD, Deng L. Intratumoral delivery of inactivated modified vaccinia virus Ankara (iMVA) induces systemic antitumor immunity via STING and Batf3-dependent dendritic cells. Sci Immunol. 2017 May 19;2(11):eaal1713.
- Gujar S, Pol JG, Kim Y, Lee PW, Kroemer G. Antitumor benefits of antiviral immunity: an underappreciated aspect of oncolytic virotherapies. Trends Immunol. 2018;39:209–221. doi:10.1016/j.it.2017.11.006.
- Rivadeneira DB, DePeaux K, Wang Y, Kulkarni A, Tabib T, Menk AV, Sampath P, Lafyatis R, Ferris RL, Sarkar SN, et al. Oncolytic viruses engineered to enforce leptin expression reprogram tumor-infiltrating T cell metabolism and promote tumor clearance. Immunity. 2019;51:548–60 e4. doi:10.1016/j.immuni.2019.07.003.
- Russell L, Peng KW, Russell SJ, Diaz RM. Oncolytic viruses: priming time for cancer immunotherapy. BioDrugs. 2019;33:485–501. doi:10.1007/s40259-019-00367-0.
- Chaurasiya S, Chen NG, Lu J, Martin N, Shen Y, Kim S-I, Warner SG, Woo Y, Fong Y. A chimeric poxvirus with J2R (thymidine kinase) deletion shows safety and anti-tumor activity in lung cancer models. Cancer Gene Ther. 2019. doi:10.1038/s41417-019-0114-x.
- Green DR, Ferguson T, Zitvogel L, Kroemer G. Immunogenic and tolerogenic cell death. Nat Rev Immunol. 2009;9:353–363. doi:10.1038/nri2545.
- Guo ZS, Liu Z, Bartlett DL. Oncolytic immunotherapy: dying the right way is a key to eliciting potent antitumor immunity. Front Oncol. 2014;4:74. doi:10.3389/fonc.2014.00074.
- Warner SG, Kim S-I, Chaurasiya S, O’Leary MP, Lu J, Sivanandam V, Woo Y, Chen NG, Fong Y. A novel chimeric poxvirus encoding hNIS is tumor-tropic, imageable, and synergistic with radioiodine to sustain colon cancer regression. Mol Ther Oncolytics. 2019;13:82–92. doi:10.1016/j.omto.2019.04.001.
- O’Leary MP, Warner SG, Kim S-I, Chaurasiya S, Lu J, Choi AH, Park AK, Woo Y, Fong Y, Chen NG, et al. A novel oncolytic chimeric orthopoxvirus encoding luciferase enables real-time view of colorectal cancer cell infection. Mol Ther Oncolytics. 2018;9:13–21. doi:10.1016/j.omto.2018.03.001.
- O’Leary MP, Choi AH, Kim SI, Chaurasiya S, Lu J, Park AK, Woo Y, Warner SG, Fong Y, Chen NG. Novel oncolytic chimeric orthopoxvirus causes regression of pancreatic cancer xenografts and exhibits abscopal effect at a single low dose. J Transl Med. 2018;16:110. doi:10.1186/s12967-018-1483-x.
- Liu Z, Ravindranathan R, Kalinski P, Guo ZS, Bartlett DL. Rational combination of oncolytic vaccinia virus and PD-L1 blockade works synergistically to enhance therapeutic efficacy. Nat Commun. 2017;8:14754. doi:10.1038/ncomms14754.
- Ramos-Vara JA. Technical aspects of immunohistochemistry. Vet Pathol. 2005;42:405–426. doi:10.1354/vp.42-4-405.
- Dunham LJ, Stewart HL. A survey of transplantable and transmissible animal tumors. J Natl Cancer Inst. 1953;13:1299–1377.
- Johnstone CN, Smith YE, Cao Y, Burrows AD, Cross RSN, Ling X, Redvers RP, Doherty JP, Eckhardt BL, Natoli AL, et al. Functional and molecular characterisation of EO771.LMB tumours, a new C57BL/6-mouse-derived model of spontaneously metastatic mammary cancer. Dis Model Mech. 2015;8:237–251. doi:10.1242/dmm.017830.
- Crosby EJ, Wei J, Yang XY, Lei G, Wang T, Liu C-X, Agarwal P, Korman AJ, Morse MA, Gouin K, et al. Complimentary mechanisms of dual checkpoint blockade expand unique T-cell repertoires and activate adaptive anti-tumor immunity in triple-negative breast tumors. Oncoimmunology. 2018;7:e1421891. doi:10.1080/2162402X.2017.1421891.
- Lee S, Margolin K. Cytokines in cancer immunotherapy. Cancers (Basel). 2011;3:3856–3893. doi:10.3390/cancers3043856.
- Araujo-Pires AC, Francisconi CF, Biguetti CC, CAVALLA F, ARANHA AMF, LETRA A, TROMBONE APF, FAVERI M, SILVA RM, GARLET GP, et al. Simultaneous analysis of T helper subsets (Th1, Th2, Th9, Th17, Th22, Tfh, Tr1 and Tregs) markers expression in periapical lesions reveals multiple cytokine clusters accountable for lesions activity and inactivity status. J Appl Oral Sci. 2014;22:336–346. doi:10.1590/1678-775720140140.
- Humeau J, Levesque S, Kroemer G, Pol JG. Gold standard assessment of immunogenic cell death in oncological mouse models. Methods Mol Biol. 2019;1884:297–315.
- Winograd R, Byrne KT, Evans RA, Odorizzi PM, Meyer ARL, Bajor DL, Clendenin C, Stanger BZ, Furth EE, Wherry EJ, et al. Induction of T-cell immunity overcomes complete resistance to PD-1 and CTLA-4 blockade and improves survival in pancreatic carcinoma. Cancer Immunol Res. 2015;3:399–411. doi:10.1158/2326-6066.CIR-14-0215.
- Bezman NA, Jhatakia A, Kearney AY, Brender T, Maurer M, Henning K, Jenkins MR, Rogers AJ, Neeson PJ, Korman AJ, et al. PD-1 blockade enhances elotuzumab efficacy in mouse tumor models. Blood Adv. 2017;1:753–765. doi:10.1182/bloodadvances.2017004382.
- Zaharoff DA, Hance KW, Rogers CJ, Schlom J, Greiner JW. Intratumoral immunotherapy of established solid tumors with chitosan/IL-12. J Immunother. 2010;33:697–705. doi:10.1097/CJI.0b013e3181eb826d.
- Sivick KE, Desbien AL, Glickman LH, Reiner GL, Corrales L, Surh NH, Hudson TE, Vu UT, Francica BJ, Banda T, et al. Magnitude of therapeutic STING activation determines CD8(+) T cell-mediated anti-tumor immunity. Cell Rep. 2018;25:3074–85 e5. doi:10.1016/j.celrep.2018.11.047.
- Kaufman HL, Kohlhapp FJ, Zloza A. Oncolytic viruses: a new class of immunotherapy drugs. Nat Rev Drug Discov. 2015;14:642–662. doi:10.1038/nrd4663.
- Zamarin D, Holmgaard RB, Subudhi SK, Park JS, Mansour M, Palese P, Merghoub T, Wolchok JD, Allison JP. Localized oncolytic virotherapy overcomes systemic tumor resistance to immune checkpoint blockade immunotherapy. Sci Transl Med. 2014;6:226ra32. doi:10.1126/scitranslmed.3008095.
- Gujar S, Pol JG, Kroemer G. Heating it up: oncolytic viruses make tumors ‘hot’ and suitable for checkpoint blockade immunotherapies. Oncoimmunology. 2018;7:e1442169. doi:10.1080/2162402X.2018.1442169.
- Gujar SA, Marcato P, Pan D, Lee PW. Reovirus virotherapy overrides tumor antigen presentation evasion and promotes protective antitumor immunity. Mol Cancer Ther. 2010;9:2924–2933. doi:10.1158/1535-7163.MCT-10-0590.
- Gauvrit A, Brandler S, Sapede-Peroz C, Boisgerault N, Tangy F, Gregoire M. Measles virus induces oncolysis of mesothelioma cells and allows dendritic cells to cross-prime tumor-specific CD8 response. Cancer Res. 2008;68:4882–4892. doi:10.1158/0008-5472.CAN-07-6265.
- Schulz O, Diebold SS, Chen M, Näslund TI, Nolte MA, Alexopoulou L, Azuma Y-T, Flavell RA, Liljeström P, Reis E Sousa C, et al. Toll-like receptor 3 promotes cross-priming to virus-infected cells. Nature. 2005;433:887–892. doi:10.1038/nature03326.
- Woller N, Gurlevik E, Fleischmann-Mundt B, Schumacher A, Knocke S, Kloos AM, Saborowski M, Geffers R, Manns MP, Wirth TC, et al. Viral infection of tumors overcomes resistance to PD-1-immunotherapy by broadening neoantigenome-directed T-cell responses. Mol Ther. 2015;23:1630–1640. doi:10.1038/mt.2015.115.
- Prestwich RJ, Errington F, Ilett EJ, Morgan RSM, Scott KJ, Kottke T, Thompson J, Morrison EE, Harrington KJ, Pandha HS, et al. Tumor infection by oncolytic reovirus primes adaptive antitumor immunity. Clin Cancer Res. 2008;14:7358–7366. doi:10.1158/1078-0432.CCR-08-0831.
- Zhang M, Sun H, Zhao S, Wang Y, Pu H, Wang Y, Zhang Q. Expression of PD-L1 and prognosis in breast cancer: a meta-analysis. Oncotarget. 2017;8:31347–31354. doi:10.18632/oncotarget.15532.
- Kim HM, Lee J, Koo JS. Clinicopathological and prognostic significance of programmed death ligand-1 expression in breast cancer: a meta-analysis. BMC Cancer. 2017;17:690. doi:10.1186/s12885-017-3670-1.
- Guo Y, Yu P, Liu Z, Maimaiti Y, Wang S, Yin X, Liu C, Huang T. Prognostic and clinicopathological value of programmed death ligand-1 in breast cancer: a meta-analysis. PLoS One. 2016;11:e0156323. doi:10.1371/journal.pone.0156323.
- Garon EB, Rizvi NA, Hui R, Leighl N, Balmanoukian AS, Eder JP, Patnaik A, Aggarwal C, Gubens M, Horn L, et al. Pembrolizumab for the treatment of non-small-cell lung cancer. N Engl J Med. 2015;372:2018–2028. doi:10.1056/NEJMoa1501824.
- Bourgeois-Daigneault MC, Roy DG, Aitken AS, El Sayes N, Martin NT, Varette O, Falls T, St-Germain LE, Pelin A, Lichty BD, et al. Neoadjuvant oncolytic virotherapy before surgery sensitizes triple-negative breast cancer to immune checkpoint therapy. Sci Transl Med. 2018;10(422):eaao1641.
- Samson A, Scott KJ, Taggart D, West EJ, Wilson E, Nuovo GJ, Thomson S, Corns R, Mathew RK, Fuller MJ, et al. Intravenous delivery of oncolytic reovirus to brain tumor patients immunologically primes for subsequent checkpoint blockade. Sci Transl Med. 2018;10(422):eaam7577.
- Ribas A, Dummer R, Puzanov I, VanderWalde A, Andtbacka RHI, Michielin O, Olszanski AJ, Malvehy J, Cebon J, Fernandez E, et al. Oncolytic virotherapy promotes intratumoral T cell infiltration and improves anti-PD-1 immunotherapy. Cell. 2017;170:1109–19 e10. doi:10.1016/j.cell.2017.08.027.
- Choi AH, O’Leary MP, Lu J, Kim SI, Fong Y, Chen NG. Endogenous akt activity promotes virus entry and predicts efficacy of novel chimeric orthopoxvirus in triple-negative breast cancer. Mol Ther Oncolytics. 2018;9:22–29.
- Solomon B, Young RJ, Bressel M, Urban D, Hendry S, Thai A, Angel C, Haddad A, Kowanetz M, Fua T, et al. Prognostic significance of PD-L1(+) and CD8(+) immune cells in HPV(+) oropharyngeal squamous cell carcinoma. Cancer Immunol Res. 2018;6:295–304. doi:10.1158/2326-6066.CIR-17-0299.
- Yi M, Jiao D, Xu H, Liu Q, Zhao W, Han X, Wu K. Biomarkers for predicting efficacy of PD-1/PD-L1 inhibitors. Mol Cancer. 2018;17:129. doi:10.1186/s12943-018-0864-3.
- Bridle BW, Hanson S, Lichty BD. Combining oncolytic virotherapy and tumour vaccination. Cytokine Growth Factor Rev. 2010;21:143–148. doi:10.1016/j.cytogfr.2010.02.009.
- Bridle BW, Li J, Jiang S, Chang R, Lichty BD, Bramson JL, Wan Y. Immunotherapy can reject intracranial tumor cells without damaging the brain despite sharing the target antigen. J Immunol. 2010;184:4269–4275. doi:10.4049/jimmunol.0901447.
- Tang H, Liang Y, Anders RA, Taube JM, Qiu X, Mulgaonkar A, Liu X, Harrington SM, Guo J, Xin Y, et al. PD-L1 on host cells is essential for PD-L1 blockade-mediated tumor regression. J Clin Invest. 2018;128:580–588. doi:10.1172/JCI96061.
- Hu Z, Ye L, Xing Y, Hu J, Xi T. Combined SEP and anti-PD-L1 antibody produces a synergistic antitumor effect in B16-F10 melanoma-bearing mice. Sci Rep. 2018;8:217. doi:10.1038/s41598-017-18641-y.
- Xu C, Zhang Y, Rolfe PA, Hernández VM, Guzman W, Kradjian G, Marelli B, Qin G, Qi J, Wang H, et al. Combination Therapy with NHS-muIL12 and Avelumab (anti-PD-L1) enhances antitumor efficacy in preclinical cancer models. Clin Cancer Res. 2017;23:5869–5880. doi:10.1158/1078-0432.CCR-17-0483.
- Hou W, Chen H, Rojas J, Sampath P, Thorne SH. Oncolytic vaccinia virus demonstrates antiangiogenic effects mediated by targeting of VEGF. Int J Cancer. 2014;135:1238–1246. doi:10.1002/ijc.28747.
- John LB, Howland LJ, Flynn JK, West AC, Devaud C, Duong CP, Stewart TJ, Westwood JA, Guo ZS, Bartlett DL, et al. Oncolytic virus and anti-4-1BB combination therapy elicits strong antitumor immunity against established cancer. Cancer Res. 2012;72:1651–1660. doi:10.1158/0008-5472.CAN-11-2788.