
 ?Mathematical formulae have been encoded as MathML and are displayed in this HTML version using MathJax in order to improve their display. Uncheck the box to turn MathJax off. This feature requires Javascript. Click on a formula to zoom.
ABSTRACT
Although several biomarkers have been proposed to predict the response of patients with lung adenocarcinoma (LUAD) to immune checkpoint blockade (ICB) therapy, existing challenges such as test platform uniformity, cutoff value definition, and low frequencies restrict their effective clinical application. Here, we attempted to use deep neural networks (DNNs) based on somatic mutations to predict the clinical benefit of ICB to LUAD patients undergoing immunotherapy. We used DNNs to train and validate the predictive model in three cohorts. Kaplan-Meier estimates determined the overall survival (OS) and progression-free survival (PFS) between specific subgroups. Then, we performed a relevant analysis on the multiple-dimension data types including immune cell infiltration, programmed death receptor 1 ligand (PD-L1) expression, and tumor mutational burden (TMB) from cohorts of LUAD public database and immunotherapeutic patients. Two classification groups (C1 and C2) in the training and two validation sets were identified for the efficacy of ICB via the DNN algorithm. Patients in C1 showed remarkably long OS and PFS to programmed death 1 (PD-1) inhibitors. The C1 group was significantly associated with increased expression of immune cell infiltration, immune checkpoints, activated T-effectors, and interferon gamma signature. C1 group also exhibited significantly higher TMB, neoantigens, transversion, or transition than the C2 group. This work provides novel insights that classification of DNNs using somatic mutations in LUAD could serve as a potentially predictive approach in developing a strategy for anti-PD-1/PD-L1 immunotherapy.
Introduction
After approval by the Food and Drug Administration (FDA), immune checkpoint blockades (ICBs), including programmed death receptor 1 (PD-1) or its ligand (PD-L1), have noticeably become the standard therapy used in patients with advanced non–small-cell lung cancer (NSCLC).Citation1,Citation2 However, only ~20% of patients with lung cancer respond to ICBs.Citation3 Several biomarkers, such as tumor-infiltrating lymphocytes (TILs),Citation4,Citation5 PD-L1 expression,Citation6,Citation7 gene expression profile (GEP),Citation8 tumor mutational burden (TMB),Citation9 high microsatellite instability (MSI-H), and neoantigen counts,Citation10,Citation11have been proposed to predict the response of patients to ICBs. However, these predictors have some deficiencies. For example, the optimal cutoff values of TMB and PD-L1 expression are not unified and cannot completely predict patient response. It is therefore urgent to develop clinically practical tools to identify the patients most likely to derive clinical benefit from ICB therapy.
A large number of somatic mutations are present in lung cancer patients. Heterogeneity caused by different somatic mutations determines the therapeutic strategy in lung adenocarcinoma (LUAD). Distinct subsets of LUAD with oncogenic drivers, such as EGFR mutation, can inform the appropriate EGFR-TKI treatment. However, patients with EGFR or STK11 mutations, or those with ALK or ROS1 variants respond inadequately to ICBs.Citation12 Some genomic mutations of low frequency, such as MDM2 may be associated with hyper-progressive disease (HPD).Citation13 On the contrary, KRAS, POLE and TP53 mutations are promising factors in predicting anti-PD-1/PD-L1 immunotherapy responses. Moreover, different co-mutations such as KP (KRAS and TP53) or KL (KRAS and STK11), present a high- and low-response to PD-1/PD-L1 blockade in LUAD.Citation14,Citation15 Co-mutations in DDR pathways suggest favorable clinical outcomes of ICB treatment for LUAD.Citation16 The activation of specific oncogenic pathways (TP53, EGFR, STK11, and mutations of DDR) affects immune-related gene expression and the immune tumor microenvironment (TME).
Whole-exome sequencing (WES) and targeted next-generation sequencing (NGS) are becoming increasingly routine. Large scale somatic mutation profiling of tumors is feasible.Citation17 However, the above-mentioned genomic mutations are not completely correlated with ICB therapy responses, and it is challenging to solve the problem using conventional statistical methods. Recently, deep neural networks (DNNs) have gained attention as a new technique for realizing artificial intelligence. Deep learning is useful for not only high-performance image recognition tasks, but also to extract features from large gene expression profiles, including those of mRNA, DNA methylation, and microRNA profiles.Citation18,Citation19 The deep learning features were significantly associated with prognosis. Therefore, we speculated that DNNs trained using comprehensive somatic mutations could be used to make a robust classification system to identifying patients with advanced LUAD who might show a favorable response to ICBs.
In our study, the DNNs based on somatic mutations from results of WES and NGS were developed and validated in three cohorts of ICB therapy. To systematically illustrate the potential mechanism of DNN classification (C1 and C2) and to identify immune durable clinical benefit (DCB) or no durable benefit (NDB) in LUAD, we describe an integrative analysis that incorporates CD8 T-cell infiltration, intratumor PD-L1 expression, TMB, and neoantigen counts in large independent cohorts from LUAD repository database analysis. Significantly, the anti–PD-1/PD-L1 therapies are likely effective in the DNN-classified C1 group but not C2 group, and provide new insights into the somatic mutations that guide immunotherapy.
Materials and methods
Immunotherapeutic patients
Our study had been approved by the institutional review board (IRB) and conducted in accordance with the Declaration of Helsinki. Investigators obtained written consent from the patients in each dataset. Clinical and mutation data for 179 patients with advanced LUAD were retrieved from cbioPortal (https://www.cbioportal.org/study/summary?id=nsclc_pd1_msk_2018). Patients were treated with anti-PD-1/PD-L1 or in combination with anti-cytotoxic T-cell lymphocyte 4 (anti-CTLA4) therapies from April 2011 to January 2017 at MSKCC.Citation20 Tumor samples used for MSK-IMPACT testing were collected before immunotherapy treatment and analyzed by targeted NGS or WES. MSK-IMPACT sequencing was performed as previously described.Citation17 A thoracic radiologist used Response Evaluation Criteria in Solid Tumors (RECIST) version 1.1 to estimate immunotherapy response. The durable clinical benefit (DCB) of immunotherapy was defined as complete response (CR), partial response (PR), or stable disease (SD) that lasted ≥ 6 months, and the no durable benefit (NDB) was defined as either SD that lasted < 6 months or progressive disease (PD). Progression-free survival (PFS) was calculated from the date the patient began immunotherapy to the date of confirmation of progression. Overall survival (OS) was assessed from the treatment start date. Patients who did not die were counted at the date of the last contact.
Another cohort (Van Allen) comprised of tumor samples from 47 LUAD patients was collected the Broad Institute.Citation10 All of these patients were treated with anti-PD-1 therapy. WES molecular profiling of LUAD tumors was performed as described above. The immunotherapy response was assessed by RECIST. Clinical information of the cohorts is provided in Supplementary Table S1. The MSKCC cohort (n = 179) treated with anti-PD-1/PD-L1 therapy was divided into two sets: the training set (n = 143) and the validation set (n = 36). The second immunotherapy cohort (Van Allen) was considered as the second validation set (n = 47).
Data sources
The Cancer Genome Atlas (TCGA), Broad and TSP cohorts were retrieved from an online data repository (https://www.cbioportal.org). The WES dataset of the TCGA cohort included a total of 510 patients with mRNA expression profiling and somatic mutation data. In addition, 510 patients had a TMB record from cbioportal. The predictive neoantigen information was derived from the Cancer Immunome Atlas (https://tcia.at/home). The experimental procedures for DNA and RNA extraction from tumors, library preparation, sequencing, quality control, and subsequent data processing were previously published by TCGA. The TSP cohort recruited 163 patients with whole-genome sequencing analysis (WGS). Source DNAs were extracted from primary LUAD tumors and adjacent healthy tissue. The Broad cohort contained 183 LUAD and matched healthy tissues, with detailed information on the TMB and mutation spectrum. All WES and WGS were performed on an Illumina HiSeq platform. The clinical data from three clinical cohorts that were not treated with ICBs are provided in Supplementary Table S1.
Tumor mutational burden
TMB was estimated as the total non-synonymous mutation count in the coding regions. To explore the association between predicted DCB and TMB, TMB was classified into high or low based on the optimal cutoff values in a receiver operating characteristic (ROC) curve analysis. The maximum Youden index was used to determine the best values.
The mutation spectrum for each tumor sample from Broad and TCGA cohorts was computed as the frequency of six single nucleotide changes (T > C, T > G, T > A, C > A, C > G, C > T) among all single-nucleotide substitutions. The most frequent mutational signatures were C > T transitions and C > A transversions.
Immune tumor microenvironment analysis
The Cell-type Identification by Estimating Relative Subsets Of RNA Transcripts (CIBERSORT) algorithm, which characterizes cell composition of complex tissues using gene expression profiles (GEP), was used in the TCGA cohort (http://cibersort.stanford.edu)Citation21 to assess immune cell infiltration. The Hugo symbol from the TCGA-LUAD contained a total of 20,531 gene probes. The mRNA expression from cBioPortal was quantified by RSEM (RNAseq by expectation-maximization). The first step was to prepare the gene expressing files (GEF) of TCGA-LUAD for the analysis. All input GEF was in tab-delimited format, with no double-quote marks and no repeated gene names. In our study, the GEF was transformed into mixture file. An input matrix of reference gene expression signatures, which consisted of 547 Hugo symbols to estimate the relative proportions of 22 human immune cells (shown in Supplementary Table S2), was then prepared. Finally, a phenotype class file was made, consisting of target class comparisons between the various samples. The three files were uploaded to the CIBERSORT web tool, and the results were downloaded (https://cibersort.stanford.edu/download.php).
Immunophenoscore
The immunophenogram was developed to predict anti- PD-1/PD-L1 therapy responses in pan-cancer.Citation22 We used the immunophenogram to calculate the immunophenoscore (IPS) between the four types (CTLA4_negative + PD-1_negative, CTLA4_positive + PD-1_negative, CTLA4_negative + PD-1_ positive, CTLA4_positive + PD-1_positive) from the TCGA-LUAD database. A high PD1_positive IPS indicates a well-predicted response of anti-PD-1/PD-L1 therapy. The mRNA expression data of RSEM were transformed as log2(TPM + 1) using R software. The red color in the outer position of the wheel represented positive Z score, and the blue color represented a negative Z score. Then, the weighted averaged Z score was computed by averaging the Z scores within the respective category, generating four values. The weight of the Z scores was shown in gray color. The IPS ranged from 0 to 10. The implementation of the R code is available at GitHub (https://github.com/Mayer/C-imed/Immunophenogram).
Deep neural network
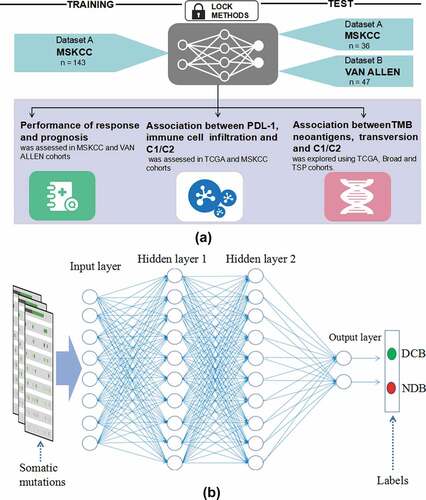
The deep learning model flowchart and architecture of deep neural networks were showed in ). The deep neural network (DNN) that we built in our study consisted of an input layer, two hidden layers, a dropout layer, and an output layer. The input layer consisted of 100 neurons, corresponding to the 100 features of somatic mutations from the training set (Supplementary Table S3). One somatic mutation was considered as a feature. As an input vector, the hidden layer had two layers, with 256 and 128 neurons, respectively. The dropout layer was used as a simple way to prevent neural networks from overfitting in the training process. The output layer consisted of two neurons, corresponding to the number of categories of target variables (DCB and NDB) for the training set. Finally, a softmax function was created to solve multiple classification problems. In this model, the neuron activation function we selected was the rectified linear units (RELU) function: f(x) = max (0, x). The loss function was defined as the cross-entropy:
where y represents the real value classification and a represents the predicted value. The iterative optimizer selects the stochastic gradient descent (SGD). The connection weights and biases of the initial layers were randomly generated. To ensure coverage of the entire data for adequate training, the learning rate and the number of max epochs were set to 0.0001 and 3000, respectively. In order to avoid the occurrence of overfitting in the DNN model, we selected the 23 important somatic mutations in the training process and developed a DNNs model by these choosing mutational genes (Supplementary Table S3). Our implementation was based on the TensorFlow library in PYTHON (3.6.3, Guido van Rossum, Netherlands). The experiment was performed in a Windows environment with a 2.6 GHz Intel Xeon Processor E5-2640V3 CPU, GPU NVIDIA Pascal Titan X, and 128 GB of RAM. Plots depicting performance of training and validation process used TensorBoard, which was normalized with a smoothing factor of 0.6 to visualize trends. The underlying program codes have been applied in the Supplementary materials.
Figure 1. The deep learning model flowchart and architecture of deep neural networks. a, The DNN model based on the tensorflow was developed in the training cohort (MSKCC, n = 143), and were validated in the two cohorts (MSKCC, n = 36; VAN ALLEN, n = 47). The cohorts of predicting ICB response using DNN model were specifically divided into C1 and C2 groups. The performance of DNN was compared with different models and the associations between C1/C2 group and expression of immune cell infiltration, immune checkpoints, TMB and neoantigen were analyzed in the MSKCC, TSP, TCGA and broad cohorts; b, The DNN that we built in our study consisted of an input layer, two hidden layers, a dropout layer, and an output layer. One somatic mutation was thought as a feature. The hidden layer showed two layers, with 256 and 128 neurons, respectively. The two classification tasks include DCB and NDB. Abbreviations: DNN, deep neural network; MSKCC, Memorial Sloan Kettering Cancer Center; ICB, immune checkpoint blockade; TCGA, The Cancer Genome Atlas; DCB, durable clinical benefit; NDB, no durable benefit
Statistical analyzes
All statistical analyzes were performed using R statistical software (https://www. r-project.org/, version 3.5.1) and GraphPad Prism (version 7.0, LaJolla, CA). The heatmap used to depict the mean difference of immune-related genes between the two sub-classifications (C1 and C2) in the TCGA cohort was generated with the “pheatmap” package. Scatter dot and box plots indicate median and 95% confidence intervals (CI). The Mann-Whitney U test was used to determine the differences between the two groups. Receiver operating characteristic (ROC) curves were plotted using the “pROC” package. Comparison of the area under the curve (AUC) was performed using the bootstrap method (n = 2000), as described in a previous study.Citation23 Survival analysis was estimated using Kaplan-Meier curves, and the P value was determined by a log-rank test. Univariate and multivariate analysis of PFS and OS were performed by “rms” package. P-values were adjusted for multiple testing using the Benjamini and Hochberg false discovery rate (FDR) approach. A P value of < 0.05 was considered statistically significant.
Results
DNNs based on somatic mutations can predict the clinical benefit of immunotherapy
By analyzing the somatic mutations from the sequencing data in the training set (MSKCC) and two validation sets (MSKCC and VAN ALLEN database) using DNNs, we identified that two distinct subgroups, C1 (n = 55, 19 and 15, respectively) and C2 (n = 88, 17 and 32, respectively), were significantly correlated with therapeutic effects (DCB and NDB) (). TP53, STK11, EGFR and KMT2D mutations were significantly with C1 and C2 groups in DNNs model (Supplementary FigureS1). We used ROC analysis to assess the predicted value of different variables, including TP53, KRAS, STK11, and EGFR mutations, TMB, and C1 vs. C2 ()). The ROC curve of C1 vs. C2 showed 0.884 (0.820–0.948) AUC, 92.11% (range: 78.62–98.34%) sensitivity, 84.76% (range: 76.44–91.03%) specificity, and an optimal Yourdon index of 0.769. Similar results were obtained from the MSKCC validation cohort, with 0.918 (0.813–1.000) AUC, 89.47% (range: 66.86–98.70) sensitivity, 94.12% (range: 71.31–98.85) specificity, and an optimal Yourdon index of 0.835, and the VAN ALLEN validation set, with 0.910 (range: 0.825–1.000) AUC, 93.33% (range: 68.05–99.83%) sensitivity, 90.63% (range: 74.98–98.02%) specificity, and an optimal Youden index of 0.839. In the training set, MSKCC validation set, and VAN ALLEN validation set, the TMB was used to predict the DCB presented by the optimal cut-off (8.34/Mb, 11.27/Mb, and 115.50/Mb somatic mutations), with 0.667 (0.568–0.767) AUC, 0.578 (0.386–0.771) AUC, and 0.8927 (0.7959–0.9895) AUC, respectively (Supplementary Table S4). Although we did not find any difference in the prediction of immunotherapy benefits between the TMB and DNN classifications in the VAN ALLEN validation set, the differences were remarkable between the training set and the MSKCC validation set. The DNNs significantly surpass the single driver mutations in their ability to predict immune responses (Supplementary Table S4). Meanwhile, we analyzed the DNNs classification in the subgroup of EGFR wild-type (n = 190) and EGFR mutation (n = 36) patients. The ROC curves of C1 vs. C2 showed 0.889 (0.838-0.940) AUC in EGFR wild-type (P < 0.0001), and showed 0.859 (0.601-1.000) AUC in EGFR mutation (P = 0.020). We found the DNNs classification in the patients (MSKCC cohort, n=179) underwent several lines of systematic therapy was robust. The ROC curve of C1 vs. C2 showed 0.891 (0.774-1.000) AUC in first line (P < 0.0001), and showed 0.874 (0.793-0.955) AUC in second line (P < 0.0001), and showed 0.903 (0.762-1.000) AUC after second line (P = 0.0003). We determined that most patients with DCB were enriched in the C1 subgroup, and patients from the C2 subgroup showed poor response (NDB) to immunotherapy in the training cohort. These findings were further verified in the two validation sets (). In the combination of two cohorts (MSKCC and VAN ALLEN, n=226), univariate analyzes revealed the TMB and DNNs were associated with DCB (Supplementary Table S5). There is a significant difference between the DNN approach and a multivariate model that incorporates TMB/STK11/KRAS/STK11/EGFR (+PDL1) (P < 0.0001 and P = 0.034) (Supplementary Table S6). The DNN model showed higher AUC and lower AIC than other two models (Supplementary Fig. S2-3).
Compared to the C2 group in the training set with anti-PD-1/PD-L1 therapy, the C1 sub-group of DNNs exhibited a longer median OS (mOS: NR vs 9.00 months) and PFS (mPFS: 9.60 vs 2.10 months) [P < .0001, HR = 0.341 (0.216 − 0.540) and < 0.0001, HR = 0.270 (0.189 − 0.385), respectively] ()). Similar results were also verified in the two validation sets (MSKCC and VAN ALLEN) ()). Univariate analysis of other clinical factors, such as fraction of copy number–altered genome (FGA), treatment, and therapy type, were significantly associated with PFS or OS in whole cohorts (MSKCC) (Supplementary Table. S7 and S8). Additionally, multivariate Cox regression analysis revealed that the C1 group from DNN classifications was an independent predictor of prognosis in anti-PD-1/PD-L1 therapy (Supplementary Table S7 and S8).
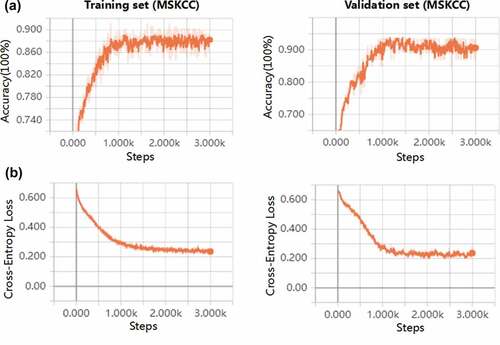
Figure 2. Performance of predicted clinical benefits from immunotherapy based on somatic mutations in the training and validation cohorts created using TensorBoard. a, Accuracy was analyzed for DCB versus NDB in the training and validation sets. b, Cross-entropy loss was plotted against training in the two cohorts. c, The area under the ROC curves were performed for predicting clinical benefits from immunotherapy using TP53 MUTversus TP53 WT, KRAS MUT versus KRAS WT, STK11 MUT versus STK11 WT, EGFR MUT versus EGFR WT, High-TMB versus Low-TMB and C1 versus C2. d, The correlation between two classifications of DNN (C1 and C2) and benefits (DCB and NDB). Abbreviations: DCB, durable clinical benefit; NDB, no durable benefit; ROC, receiver operating characteristic; MUT, mutation; WT, wild type; TMB, tumor mutation burden; DNN, deep neural network
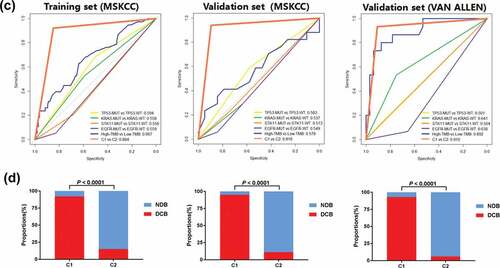
Figure 3. Patients showing a different clinical benefit from ICBs were compared between C1 and C2 groups. a, Kaplan-Meier survival curves showing OS and PFS between the C1 and C2 groups in LUAD patients from the training cohort (MSKCC) treated with anti-PD-1/PD-L1 therapy. b, Kaplan-Meier survival curves showing OS and PFS between the C1 and C2 groups in LUAD patients treated with anti-PD-1/PD-L1 therapy from the validation cohort (MSKCC). c, Kaplan-Meier survival curves of OS and PFS between the C1 and C2 groups in LUAD patients from the validation cohort (VAN ALLEN) treated with anti-PD-1/PD-L1 therapy. Abbreviations: ICB, immune checkpoint blockades; PFS, progression free survival; OS, overall survival; NR, not reached; MSKCC, Memorial Sloan Kettering Cancer Center; PD-1, programmed death receptor 1; LUAD, lung adenocarcinoma; PD-L1, programmed death receptor 1 ligand
The C1 group facilitates favorable immune-cell infiltration and IFNγ-associated gene signature
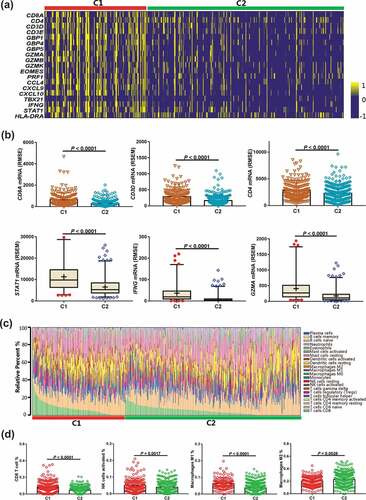
Based on DNN analysis, the independent TCGA-LUAD cohort (n = 510) with both WES and RNAseq data were classified into two subgroups (C1, n = 176; C2, n = 334). We first investigated the association between the C1 subgroup and TME by determining the expression levels of immune-related mRNAs in the 22 types of immune cells. We found that the mRNA signatures involved in the inflammatory response and the IFNγ pathway were significantly enriched in the C1 group ()). Among the immune-related genes of the TCGA-LUAD database, CD8A, CD3D, and CD4 were significantly upregulated in the C1 subgroup (P < .0001 for each) ()). Genes related to the activated T-effector and IFNγ pathways, such as STAT1, CCL4, CXCL9, CXCL10, TBX21, and IFNG, were also prominently upregulated (each P < .0001) ()) (Supplementary Fig. S4). Using CIBERSORT analysis, the relative abundance of the 22 immune cell types in each tumor sample was analyzed ()). We found that the C1 subgroup exhibited more tumor infiltrating CD8+ CTLs (P < .0001) ()). Similarly, the number of activated NK cells and M1 macrophages was significantly higher in the C1 subgroup (P = .005, 0.0001, respectively) ()). These cells possibly contributed to an increase in the anti-tumor immune response. The number of M2 macrophages was significantly higher in the C2 subgroup (P = .0028), which may be associated with the negative response to anti-PD-1 therapy ()). We also found that the number of memory B cells, activated dendritic cells, resting mast cells, and monocytes were significantly higher in the C2 subgroup (P = .0023, 0.0021, 0.0001, and 0012, respectively) (Supplementary Fig. S5). Conversely, memory activated CD4 + T cell numbers were higher in the C1 subgroup than in the C2 subgroup (P < .0001) (Supplementary Fig. S5).
Figure 4. Correlations between immune cell infiltration in the C1 and C2 groups. a, Heatmap depicting the mRNA expression of immune cell signature, T-effector, and IFNγ-associated gene signature. b, Comparison of the immune-related mRNA expression between C1 and C2 groups. c, The relative abundance of 22 types of immune cells via CIBERSORT analysis is presented in theC1 and C2 groups. d, Comparison of the amounts of the four immune cells between the C1 and C2 groups. Abbreviations: CIBERSORT, Cell-type Identification by Estimating Relative Subsets of RNA Transcripts
Correlation between two classifications of DNNs and PD-L1 expression, immunophenoscore
We evaluated the RNA-Seq expression data from TCGA-LUAD and investigated the correlation between the two classifications and PD-L1 expression. The mean mRNA expression of immune checkpoints, such as PD-1, PD-L1, PD-L2, LAG3, VTCN1, IDO1, and TIM3 were enriched in the C1 group ()). The C1 also group had significantly higher PD-L1 mRNA expression (P < .0001) ()). We also analyzed other immune checkpoints (PD-1, LAG3, CD40, CD80, and TIM3) and found that the expression of these genes was also significantly elevated (each P < .0001) in the C1 group (Supplementary Fig. S6-7). Reverse phase protein array (RPPA) analysis from the TCGA cohort revealed higher PD-L1 expression in the C1 group (P < .0001) ()). However, in the C1 sub-group, PD-1 and CTLA4 expression (RPPA analysis) was not increased in patients with LUAD (P = .494 and 0.838, respectively) (Supplementary Fig. S8). Using the PD-L1 immunohistochemistry (IHC) scores from the MSKCC cohort, we further confirmed that the C1 group showed significantly higher PD-L1 expression (P < .0001) ()).
Figure 5. Association between the C1 and C2 groups for PD-L1 expression and IPS in patients withLUAD. a, Heatmap representation of differences in mRNA expression levels of immune inhibitory checkpoint related genes. b, Comparison of the mRNA or protein expression levels between the C1 and C2 groups from the TCGA and MSKCC cohorts. c, Different IPSs were calculated using immunophenograms in three patients from the TCGA cohort. d, IPS comparison between C1 and C2 groups in LUAD patients in the CTLA4 negative/positive or PD-1 negative/positive groups. CTLA4_positive or PD1_positive represented anti-CTLA4 or anti-PD-1/PD-L1 therapy, respectively. e, Kaplan-Meier survival curves of OS and DFS comparing the C1 and C2 groups in LUAD patients from TCGA. Abbreviations: TCGA, The Cancer Genome Atlas; MSKCC, Memorial Sloan Kettering Cancer Center; IPS, immunophenoscore; CTLA4, cytotoxic T-lymphocyte-associated protein 4; PD-1, programmed death receptor 1; OS, overall survival; DFS, disease-free survival; LUAD, lung adenocarcinoma
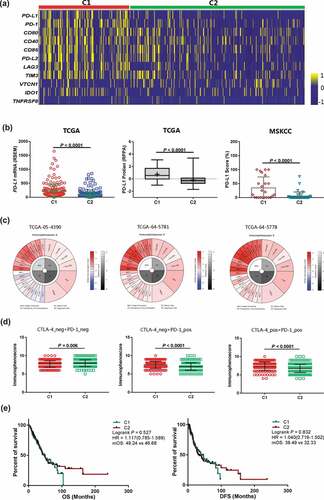
To determine the capacity of DNNs to predict the response to anti-PD-1/PD-L1 therapy, we used immunophenogram analysis to investigate the correlation between immunophenoscore (IPS) and C1/C2 groups ()). We found that in the CTLA4_negative + PD-1_negative type, the C1 group exhibited lower IPS than the C2 group (P = .006) ()). Interestingly, in the CTLA4_negative + PD-1_positive and CTLA4_positive + PD-1_positive types, the C1 group IPS was significantly higher in the TCGA-LUAD cohort (both P < .0001) ()). These results indicated that patients from the C1 group showed a higher positive response to anti-PD-1/PD-L1 therapy or a combination of anti-PD-1/PD-L1 and anti-CTLA4 therapies. We analyzed the correlation between the two classifications of DNNs and OS/disease free survival (DFS) in the TCGA-LUAD cohorts undergoing tumor resection, chemotherapy, or radiation therapy, and no immunotherapy. There was no difference in OS and DFS between the C1 and C2 sub-groups [P = .527, HR = 1.117 (0.785–1.589) and 0.832, HR = 1.040 (0.719–1.502), respectively] ()).
C1 and C2 groups show distinct tumor mutation burdens and mutation spectrum
Although somatic mutations develop in both TMB and DNNs, as detected by WES, WGS or NGS, the correlation between DNNs and TMB in patients with LUAD is unclear. We used three independent cohorts to validate our hypothesis. Because of the TMB caused by non-synonymous mutations/non-silent mutations, we compared the non-synonymous mutations with two classifications (C1, n = 75, 52 and 176; C2, n = 108, 111 and 334, respectively). The C1 sub-group exhibited significantly more non-synonymous mutations than the C2 group did in the Broad, TSP, and TCGA cohorts (each P < .0001) ()). We also found that the C1 group had more neoantigen counts than the C2 group in the LUAD cohort (P = .0005), which would contribute to an enhanced immune response to anti-PD-1/PD-L1 therapy ()).
Figure 6. The C1 and C2 groups exhibited different tumor antigenicities by transforming the mutational profile of tumors. a, The tumor mutation burden and neoantigen counts were analyzed using the Broad and TCGA cohorts. b, The transversion and transition counts were compared between C1 and C2 group in the Broad and TCGA cohorts. c, Heatmap showing the integrated relationship between the mutation spectrum, mutation burden and C1/C2 sub-groups from analysis of the Broad cohort. The proportion of Tv/Ti was compared between the C1 and C2 groups. d, Heatmap showing the integrated relationship between the mutation spectrum, mutation burden and C1/C2 sub-groups from analysis of the TCGA cohort. The ratio of Tv/Ti was also compared between the C1 and C2 groups. Abbreviations: TCGA, The Cancer Genome Atlas; Tv, Transversion; Ti, Transition
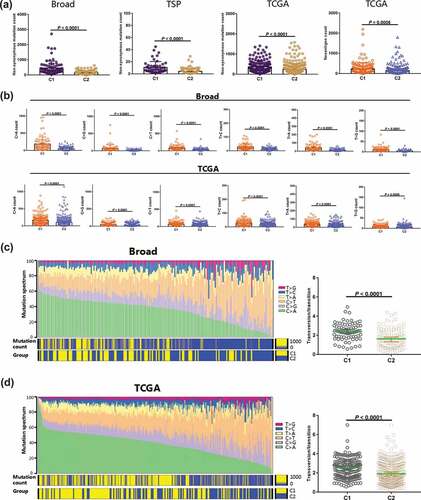
We further analyzed the variable characteristics of the four bases (A, T, C, and G) in somatic mutations from the C1 group. After examining transversions (T > A, C > G, C > A, and T > G) and transitions (T > C and C > T) from the Broad and TCGA-LUAD cohorts, the counts of both transversions and transitions in the C1 group were remarkably higher than those in the C2 group (each P < .0001) ()). The mutation spectrum status was also investigated in the two cohorts. We found that the increasing frequency of C > A transversions was significantly associated with the C1 sub-group and high mutation counts in the Broad cohort ()). However, the decreasing C > T frequency and high mutation counts were significantly correlated the C1 sub-group. This result was further confirmed in the TCGA-LUAD cohort ()). The ratio of transversions and transitions (Tv/Ti) is unclear between the two DNN classifications. We calculated the ratio for each sample in both Broad and TCGA cohorts and observed that the C1 group had higher Tv/Ti ratios (both P < .0001, respectively) (,d)).
Discussion
In this study, we demonstrated that two somatic mutation-based DNN classifications, C1 and C2 sub-groups, were potentially associated with the DCB and NDB of anti-PD-1/PD-L1 therapy in patients with LUAD. In 5 independent cohorts, we found the frequency distribution of C1/C2 in the IO-cohort and the non-IO cohort was not different (Supplementary Fig. S9). The C1 group was significantly associated with favorable immune cell infiltration, higher TMB, increased PD-L1 expression, and higher IPS and immune-related gene expression, indicating a positive TME for ICBs. We also found that the C1 group had a better OS and PFS than the C2 group in patients from three cohorts undergoing ICB therapy. These results suggest that DNNs can be a novel tool to effectively identify a subset of patients that would benefit from immunotherapy.
Several studies have reported the use of sequencing techniques (WES, WGS, and NGS) for tumor analysis, predicting therapeutic effects, and prognosis.Citation24–Citation26 However, most studies, especially in immunotherapy, focuses on a single gene or a few genes, making it challenging to realize the predictive value of significant somatic mutations for patient response undergoing anti-PD-1/PD-L1 therapy. In our study, we did not find a positive immunotherapy response prediction in the four driver mutations (TP53, KRAS, STK11, and EGFR). This indicated the weak predictive abilities of single gene mutations in different cohorts, possibly because of tumor heterogeneity. To date, most studies have used WES, WGS, or NGS to quantify TMB in various cancers. TMB was calculated using the accumulation of somatic mutations, and high TMB was prominently correlated with high response to immunotherapy.Citation27–Citation30 Unfortunately, the cutoff value of high TMB is difficult to define because patients with high TMB are relatively few. Therefore, in our study, we described the first series to test the utility of DNNs trained by somatic mutations derived from targeted NGS or WES to determine response or resistance to anti–PD-1/PD-L1 therapy in patients with advanced LUAD. We found the DNN classifications (C1 and C2) could precisely predict the DCB and NDB in LUAD. Importantly, our method does not require a cutoff value. This indicates that the novel algorithm was easy-to-use and can potentially identify the LUAD patient population that can be effectively treated with immunotherapy.
Based on the presence or absence of PD-L1 expression and CD8+ CTLs, tumors can be classified into four different types. TME immune type I means the tumors showed high PD-L1 expression and the presence of CD8+ CTLs in the microenvironment. Anti-PD-1/PD-L1 therapy is beneficial in these tumor types.Citation31,Citation32 KEYNOTE-010 results confirmed that high PD-L1 expression serves as a useful biomarker for anti-PD-1/PD-L1 therapy with pembrolizumab in patients with advanced non-small-cell lung cancer.Citation33 In our study, we investigated the association between DNN classification, immune cell infiltration, and PD-L1 expression. As expected, the C1 group showed a significantly higher number of CD8+ T cells and PD-L1 expression than the C2 group did. Consistent with previous studies, M1 cells were positively associated with the C1 sub-group, whereas M2 cells were negatively associated with the C1 sub-group.Citation34 The polarization of M2 macrophages may be related to primary drug resistance in immunotherapy. This imbalance of M1/M2 macrophages might also determine the clinical outcome of anti-PD-1/PD-L1 therapy. Additionally, the C1 subgroup showed higher expression of other immune checkpoints (PD-1, LAG3, and TIM3) than the C2 subgroup. These results, when compared to previous reports, demonstrated that the C1 group could be considered the inflamed phenotype and the C2 group could be considered a mixture of immune-excluded and immune-desert phenotypes.Citation35 An association between the C1 and C2 subgroups and IPS is a quantitative indicator for immunotherapy. The C1 group showed excellent responses for anti-PD-1 therapy but not for anti-CTLA4 therapy. These results, however, will need to be further verified in the future.
Recent studies showed that the TP53, KRAS, STK11, and EGFR mutations exhibited distinct TMB.Citation36 Co-mutations in the DDR pathways also exhibit higher TMB and neoantigens than the wild-type DDR. Therefore, we analyzed the DNNs based on the somatic mutations and found that the C1 group exhibited significantly higher non-synonymous mutations and neoantigens in three independent cohorts. This result indicated that the DNN multi-gene panel had a strong influence on the TMB. Moreover, the C1 group showed more counts of transversion and transition in the TCGA and Broad cohorts than the C2 group. Mutational spectrum analysis suggested that the C1 group had higher A > C transversion counts and the transversion/transition ratio than the C2 group did. Combining the TMB and GEP findings, the C1 group of DNNs presented both high TMB and intense inflammatory factors, providing a stronger predictive value for therapeutic outcomes.Citation37,Citation38 The C1 group also presented better OS and PFS than the C2 group in the three cohorts undergoing anti-PD-1/PD-L1 therapy. However, those two DNN classifications were not associated with the prognosis of patients who were not treated with ICBs from the TCGA cohort. Therefore, we found this model of DNNs to be suitable for identifying patients with ICBs.
Our study had several limitations. First, the sample size was relatively small and could be considered a pilot study.To prevent neural networks from overfitting in the training process, the dropout layer was used as a simple way in our DNN and we have selected an optimization model after several training processes to reduce the occurrence of overfitting as possible. Although the results might not be prone to completely overfitting phenomenon in the validation cohorts, large samples in the training set were effective to avoid the overfitting of the DNN model and it would be necessary to collect more data of Immune Checkpoint Blockade (ICB) in the future to further optimize model and improve the practicability. Second, each somatic mutation might have similar or different characteristics and have a specific influence on immunotherapy. Relevant somatic mutations for predicting the ICB response still need to be studied. Third, more sequencing data must be tested and copy number variations applied to analyze the future predictive value.
In conclusion, this study suggests that the classification of DNNs based on somatic mutations provides a robust predictive method to identify patients who may benefit from anti-PD-1/PD-L1 therapy. The DNNs could be used as a predictive tool for ICBs through a significant association between the two classifications and TMB, neoantigen counts, PD-L1 expression, and immune cell infiltration. We strongly believe that the novel findings described in this study could help to refine new anticancer immunotherapy strategies. To more clearly understand the multi-gene panel of DNNs as a predictive biomarker for immunotherapy, a thorough investigation of the underlying molecular mechanisms and pathways should be performed in the future.
Abbreviations
| DNNs | = | Deep neural networks |
| RECIST | = | Response evaluation criteria in solid tumors |
| MSKCC | = | Memorial Sloan Kettering Cancer Center |
| LUAD | = | lung adenocarcinoma |
| CTLA4 | = | cytotoxic T-lymphocyte-associated protein 4 |
| DDR | = | DNA damage response |
| FDA | = | Food and drug administration |
| HR | = | Hazard ratio |
| ICB | = | Immune checkpoint blockade |
| MSI-H | = | Microsatellite instability-high |
| NGS | = | Next-generation sequencing |
| NR | = | Not reached |
| NSCLC | = | Non-small cell lung cancer |
| OS | = | Overall survival |
| FGA | = | Fraction of copy number–altered |
| PD-1 | = | Programmed death receptor 1 |
| PD-L1 | = | Programmed death receptor 1 ligand-1 |
| TIM3 | = | T cell immunoglobulin and mucin domain-3 |
| LAG3 | = | Lymphocyte-activation gene 3 |
| IPS | = | Immunophenoscore |
| PFS | = | Progression-free survival |
| ROC | = | Receiver operating characteristic |
| RSEM | = | RNAseq by expectation-maximization |
| TCGA | = | The Cancer Genome Atlas |
| TMB | = | Tumor mutational burden |
| WES | = | Whole exome sequencing |
| TILs | = | Tumor-infiltrating lymphocytes |
| GEP | = | Gene expression profile |
| DFS | = | Disease-free survival |
| DCB | = | Durable clinical benefit |
| NDB | = | No durable benefit |
| WGS | = | Whole genome sequencing |
Disclosure of Potential Conflicts of Interest
The authors have no conflicts of interest to declare.
Authors’ Contribution
(I) Conception and design: Jie Peng; (II) Administrative support: None; (III) Provision of study materials or patients: Jie Peng and Dan Zou; (IV) Collection and assembly of data: Jie Peng, Wuxing Gong, and Shuai Kang; (V) Data analysis and interpretation: Jie Peng and Lijie Han; (VI) Manuscript writing: All authors; (VII) Final approval of manuscript: All authors.
Supplemental Material
Download ()Acknowledgments
We thank the support from the Guizhou Medical University and Southern Medical University.
Supplementary Materials
Supplemental data for this article can be accessed publisher’s website.
Additional information
Funding
References
- Socinski MA, Jotte RM, Cappuzzo F, Orlandi F, Stroyakovskiy D, Nogami N, Rodríguez-Abreu D, Moro-Sibilot D, Thomas CA, Barlesi F, Finley G. Atezolizumab for first-line treatment of metastatic nonsquamous NSCLC. N Engl J Med. 2018;378:2288–13. doi:10.1056/NEJMoa1716948.
- Lemery S, Keegan P, Pazdur R. First FDA approval agnostic of cancer site when a biomarker defines the indication. N Engl J Med. 2017;377:1409–1412. doi:10.1056/NEJMp1709968.
- Topalian SL, Hodi FS, Brahmer JR, Gettinger SN, Smith DC, McDermott DF, Powderly JD, Carvajal RD, Sosman JA, Atkins MB, et al. Safety, activity, and immune correlates of anti-PD-1 antibody in cancer. The New England Journal of Medicine. 2012;366:2443–2454. doi:10.1056/NEJMoa1200690.
- Wei SC, Levine JH, Cogdill AP, Zhao Y, Anang NAS, Andrews MC, Sharma P, Wang J, Wargo JA, Pe’er D, et al. Distinct cellular mechanisms underlie anti-CTLA-4 and anti-PD-1 checkpoint blockade. Cell. 2017;170:1120–33.e17. doi:10.1016/j.cell.2017.07.024.
- Diem S, Hasan Ali O, Ackermann CJ, Bomze D, Koelzer VH, Jochum W, Speiser, D.E., Mertz, K.D. and Flatz, L. Tumor infiltrating lymphocytes in lymph node metastases of stage III melanoma correspond to response and survival in nine patients treated with ipilimumab at the time of stage IV disease. Cancer Immunol Immunother. 2018;67:39–45. doi:10.1007/s00262-017-2061-4.
- Peng J, Xiao L-S, Dong Z-Y, Li -W-W, Wang K-Y, Wu D-H, Liu L. Potential predictive value of JAK2 expression for pan-cancer response to PD-1 blockade immunotherapy. Transl Cancer Res. 2018;7:462–471. doi:10.21037/tcr.2018.04.09.
- Brahmer JR, Rodriguez-Abreu D, Robinson AG, Hui R, Csoszi T, Fulop A, Gottfried M, Peled N, Tafreshi A, Cuffe S, et al. Health-related quality-of-life results for pembrolizumab versus chemotherapy in advanced, PD-L1-positive NSCLC (KEYNOTE-024): a multicentre, international, randomised, open-label phase 3 trial. Lancet Oncol. 2017;18:1600–1609. doi:10.1016/S1470-2045(17)30690-3.
- Ayers M, Lunceford J, Nebozhyn M, Murphy E, Loboda A, Kaufman DR, Albright A, Cheng JD, Kang SP, Shankaran V, et al. IFN-γ-related mRNA profile predicts clinical response to PD-1 blockade. J Clin Invest. 2017;127:2930–2940. doi:10.1172/JCI91190.
- Samstein RMA-O, Lee CH, Shoushtari ANA-O, Hellmann MDA-O, Shen R, Janjigian YY, Barron, D.A., Zehir, A., Jordan, E.J., Omuro, A, et al. Tumor mutational load predicts survival after immunotherapy across multiple cancer types. Nat Genet. 2019;51:202–206. doi:10.1038/s41588-018-0312-8.
- Miao D, Margolis CA, Vokes NI, Liu D, Taylor-Weiner A, Wankowicz SM, Adeegbe D, Keliher D, Schilling B, Tracy A, et al. Genomic correlates of response to immune checkpoint blockade in microsatellite-stable solid tumors. Nat Genet. 2018;50:1271–1281. doi:10.1038/s41588-018-0200-2.
- Rizvi NA, Hellmann MD, Snyder A, Kvistborg P, Makarov V, Havel JJ, Lee W, Yuan J, Wong P, Ho TS, et al. Cancer immunology. Mutational landscape determines sensitivity to PD-1 blockade in non-small cell lung cancer. Science. 2015;348:124–128. doi:10.1126/science.aaa1348.
- Biton J, Mansuet-Lupo A, Pecuchet N, Alifano M, Ouakrim H, Arrondeau J, Boudou-Rouquette P, Goldwasser F, Leroy K, Goc J, et al. TP53, STK11, and EGFR mutations predict tumor immune profile and the response to anti-PD-1 in lung adenocarcinoma. Clin Cancer Res. 2018;24:5710–5723. doi:10.1158/1078-0432.CCR-18-0163.
- Kato S, Goodman A, Walavalkar V, Barkauskas DA, Sharabi A, Kurzrock R. Hyperprogressors after immunotherapy: analysis of genomic alterations associated with accelerated growth rate. Clin Cancer Res. 2017;23:4242–4250. doi:10.1158/1078-0432.CCR-16-3133.
- Skoulidis F, Goldberg MEA-O, Greenawalt DM, Hellmann MD, Awad MM, Gainor JF, Schrock AB, Hartmaier RJ, Trabucco SE, Gay L, et al. STK11/LKB1 mutations and PD-1 inhibitor resistance in KRAS-mutant lung adenocarcinoma. Cancer Discov. 2018;8:822–835. doi:10.1158/2159-8290.CD-18-0099.
- Dong ZY, Zhong WZ, Zhang XC, Su J, Xie Z, Liu SY, Tu HY, Chen HJ, Sun YL, Zhou Q, et al. Potential predictive value of TP53 and KRAS mutation status for response to PD-1 blockade immunotherapy in lung adenocarcinoma. Clin Cancer Res. 2017;23:3012–3024. doi:10.1158/1078-0432.CCR-16-2554.
- Wang Z, Zhao J, Wang G, Zhang F, Zhang Y, Dong H, Zhao X, Duan J, Bai H, Tian Y, et al. Comutations in DNA damage response pathways serve as potential biomarkers for immune checkpoint blockade. Cancer Res. 2018;78:6486–6496. doi:10.1158/0008-5472.CAN-18-1814.
- Zehir AA-O, Benayed R, Shah RH, Syed A, Middha SA-O, Kim HRA-O, Srinivasan P, Gao J, Chakravarty D, Devlin SM, et al. Mutational landscape of metastatic cancer revealed from prospective clinical sequencing of 10,000 patients. Nat Med. 2017;23:703–713. doi:10.1038/nm.4333.
- Kermany DS, Goldbaum M, Cai W, Valentim CCS, Liang H, Baxter SL, McKeown, A., Yang, G., Wu, X., Yan, F, et al. Identifying medical diagnoses and treatable diseases by image-based deep learning. Cell. 2018;172:1122–31.e9. doi:10.1016/j.cell.2018.02.010.
- Chaudhary K, Poirion OB, Lu L, Garmire LX. Deep learning-based multi-omics integration robustly predicts survival in liver cancer. Clin Cancer Res. 2018;24:1248–1259. doi:10.1158/1078-0432.CCR-17-0853.
- Rizvi H, Sanchez-Vega F, La K, Chatila W, Jonsson P, Halpenny D, Plodkowski A, Long N, Sauter JL, Rekhtman N, et al. Molecular determinants of response to anti-programmed cell death (PD)-1 and anti-programmed death-ligand 1 (PD-L1) blockade in patients with non-small-cell lung cancer profiled with targeted next-generation sequencing. J Clin Oncol. 2018;36:633–641. doi:10.1200/JCO.2017.75.3384.
- Newman AM, Liu CL, Green MA-O, Gentles AA-O, Feng W, Xu Y, Hoang, C.D., Diehn, M. and Alizadeh, A.A. Robust enumeration of cell subsets from tissue expression profiles. Nat Methods. 2015;12:453–457. doi:10.1038/nmeth.3337.
- Charoentong P, Finotello F, Angelova M, Mayer C, Efremova M, Rieder D, Hackl, H. and Trajanoski, Z. Pan-cancer immunogenomic analyzes reveal genotype-immunophenotype relationships and predictors of response to checkpoint blockade. Cell Rep. 2017;18:248–262. doi:10.1016/j.celrep.2016.12.019.
- Peng J, Zhang J, Zhang Q, Xu Y, Zhou J, Liu L. A radiomics nomogram for preoperative prediction of microvascular invasion risk in hepatitis B virus-related hepatocellular carcinoma. Diagn Interv Radiol. 2018;24:121–127. doi:10.5152/dir.
- Hyman DM, Piha-Paul SA, Won H, Rodon J, Saura C, Shapiro GI, Juric, D., Quinn, D.I., Moreno, V., Doger, B, et al. HER kinase inhibition in patients with HER2- and HER3-mutant cancers. Nature. 2018;554:189–194. doi:10.1038/nature25475.
- Harding JJ, Nandakumar S, Armenia J, Khalil DN, Albano M, Ly M, Shia J, Hechtman JF, Kundra R, El Dika I,.et al. Prospective genotyping of hepatocellular carcinoma: clinical implications of next-generation sequencing for matching patients to targeted and immune therapies. Clin Cancer Res. 2019;25:2116–2126. doi:10.1158/1078-0432.CCR-18-2293.
- Campbell JA-O, Alexandrov AA-O, Kim J, Wala J, Berger AH, Pedamallu CA-OX, Shukla SA, Guo G, Brooks AN, Murray BA, et al. Distinct patterns of somatic genome alterations in lung adenocarcinomas and squamous cell carcinomas. Nat Genet. 2016;48:607–616. doi:10.1038/ng.3564.
- Yarchoan M, Albacker LA, Hopkins AC, Montesion M, Murugesan K, Vithayathil TT, Zaidi N, Azad NS, Laheru DA, Frampton GM, et al. PD-L1 expression and tumor mutational burden are independent biomarkers in most cancers. JCI Insight. 2019;4:e126908. doi:10.1172/jci.insight.126908.
- Wang Z, Duan J, Cai S, Han M, Dong H, Zhao J, Zhu B, Wang S, Zhuo M, Sun J, et al. Assessment of blood tumor mutational burden as a potential biomarker for immunotherapy in patients with non-small cell lung cancer with use of a next-generation sequencing cancer gene panel. JAMA Oncol. 2019. Epub ahead of print. doi:10.1001/jamaoncol.2018.
- Ricciuti B, Kravets S, Dahlberg SE, Umeton R, Albayrak A, Subegdjo SJ, Johnson BE, Nishino M, Sholl LM, Awad MM. Use of targeted next generation sequencing to characterize tumor mutational burden and efficacy of immune checkpoint inhibition in small cell lung cancer. J Immunother Cancer. 2019;7:87. doi:10.1186/s40425-019-0572-6.
- Goodman AM, Kato S, Bazhenova L, Patel SP, Frampton GM, Miller V, Stephens PJ, Daniels GA, Kurzrock R. Tumor mutational burden as an independent predictor of response to immunotherapy in diverse cancers. Mol Cancer Ther. 2017;16:2598–2608. doi:10.1158/1535-7163.MCT-17-0386.
- Ock CY, Keam B, Kim S, Lee JS, Kim M, Kim TM, Jeon YK, Kim DW, Chung DH, Heo DS. Pan-cancer immunogenomic perspective on the tumor microenvironment based on PD-L1 and CD8 T-cell infiltration. Clin Cancer Res. 2016;22:2261–2270. doi:10.1158/1078-0432.CCR-15-2834.
- Chen YP, Zhang Y, Lv JW, Li YQ, Wang YQ, He QM, Yang XJ, Sun Y, Mao YP, Yun JP, et al. Genomic analysis of tumor microenvironment immune types across 14 solid cancer types: immunotherapeutic implications. Theranostics. 2017;7:3585–3594. doi:10.7150/thno.21471.
- Herbst RS, Baas P, Kim DW, Felip E, Perez-Gracia JL, Han JY, Molina J, Kim JH, Arvis CD, Ahn MJ, et al. Pembrolizumab versus docetaxel for previously treated, PD-L1-positive, advanced non-small-cell lung cancer (KEYNOTE-010): a randomised controlled trial. Lancet. 2016;387:1540–1550. doi:10.1016/S0140-6736(15)01281-7.
- Dhupkar P, Gordon N, Stewart J, Kleinerman ES. Anti-PD-1 therapy redirects macrophages from an M2 to an M1 phenotype inducing regression of OS lung metastases. Cancer Med. 2018;7:2654–2664. doi:10.1002/cam4.2018.7.issue-6.
- Chen DS, Mellman I. Elements of cancer immunity and the cancer-immune set point. Nature. 2017;541:321–330. doi:10.1038/nature21349.
- Skoulidis F, Byers LA, Diao L, Papadimitrakopoulou VA, Tong P, Izzo J, Behrens C, Kadara H, Parra ER, Canales JR, et al. Co-occurring genomic alterations define major subsets of KRAS-mutant lung adenocarcinoma with distinct biology, immune profiles, and therapeutic vulnerabilities. Cancer Discov. 2015;5:860–877. doi:10.1158/2159-8290.CD-14-1236.
- Ott PA, Bang YJ, Piha-Paul SA, Razak ARA, Bennouna J, Soria JC, Rugo HS, Cohen RB, O’Neil BH, Mehnert J, et al. T-cell-inflamed gene-expression profile, programmed death ligand 1 expression, and tumor mutational burden predict efficacy in patients treated with pembrolizumab across 20 cancers: KEYNOTE-028. J Clin Oncol. 2019;37:318–327. doi:10.1200/JCO.2018.78.2276.
- Cristescu RA-O, Mogg R, Ayers M, Albright A, Murphy E, Yearley J, Sher X, Liu XQ, Lu H, Nebozhyn M, et al. Pan-tumor genomic biomarkers for PD-1 checkpoint blockade-based immunotherapy. Science. 2018;362:eaar3593. doi:10.1126/science.aar3593.