
ABSTRACT
Despite the success of immunotherapy using checkpoint blockade, many patients with solid tumors remain refractory to these treatments. In human cancer, the experimental options to investigate the specific effects of antibodies blocking inhibitory receptors are limited and it is still unclear which cell types are involved. We addressed the question whether the direct interaction between T cells and tumor cells can be enforced through blocking a set of inhibitory receptors including PD-1, TIM-3, BTLA and LAG-3, blocked either individually or in dual combinations with the anti-PD-1 antibody, and to determine the condition that induces maximal T cell function preventing tumor cell proliferation. Using short-term Melan-A-specific or autologous re-stimulations, checkpoint blockade did not consistently increase cytokine production by tumor-derived expanded T cells. We next set up a 5-day co-culture assay with autologous melanoma cell lines and expanded tumor infiltrating T cells, originating from tumor specimens obtained from 6 different patients. Amongst all combos tested, we observed that blockade of LAG-3 alone, and more strongly when combined with PD-1 blockade, enforced T cell responses and tumor cell growth control. The combination of anti-LAG-3 plus anti-PD-1 acted through CD8 T cells and led to increased IFNγ production and cytotoxic capacity. Our results show that LAG-3 and PD-1 are regulating the direct interaction between tumor cells and autologous T cells, suggesting that therapy effects may be promoted by enhanced access of the corresponding blocking reagents to the tumor microenvironment.
Introduction
Tremendous progress has been made over the last few years to understand and circumvent the inhibitory mechanisms in the tumor microenvironment that prevent an efficient anti-tumor immune response.Citation1-Citation5 Among the mechanisms of interest, the study of inhibitory receptors at the surface of T cells, also termed immune checkpoints, as well as their ligands expressed by tumor cells,Citation6 has led to the major breakthrough of checkpoint-based immunotherapy as a standard of care for many cancer types.Citation7 In healthy conditions, inhibitory receptors are expressed by T cells and their function is to participate in the fine modulation of the immune response, in order to avoid overwhelming immune responses.Citation8 Prolonged antigen stimulation, for instance upon chronic viral infections, induces persistent upregulation of inhibitory receptors, preventing autoimmune damage by repeatedly activated T cells.Citation9 This natural principle of modulating T cell function with inhibitory receptors is exploited by tumors, which favor the expression of these receptors/ligands through various processes that are only partially understood, in order to preclude T cell function.Citation10-Citation12 Dysfunctional (coined “exhausted”) T cells in tumors display a transcriptional program that reflects chronic antigen stimulation and the effects of additional intra-tumoral factors such as hypoxia and particular immune cells, cytokines, and metabolites.Citation4
Based on numerous independent studies illustrating the powerful role of the receptor CTLA-4 (Cytotoxic T Lymphocyte Antigen 4) in the inhibition of T cell responses,Citation13 a number of clinical trials were launched to determine whether anti-CTLA-4 blocking monoclonal antibodies (mAb) could enhance the activity of tumor-specific T cells and provide clinical benefit to melanoma patients. Long-term results with follow-up data up to 10 years, from 1861 melanoma patients treated with anti-CTLA-4 (Ipilimumab) in 10 clinical trials, showed a 3-year overall survival rate of 22%.Citation14 Importantly, the survival rate remained almost stable over the last 7 years of study, reflecting long-term durability. Such immunotherapeutic success has not been achieved with any other treatment of metastatic cancers. Further clinical trials highlighted the critical importance of Programmed cell death 1 (PD-1) and one of its ligand PD-Ligand 1 (PD-L1) for tumor immunotherapy. Treatment of various solid tumors with humanized anti-PD-1 blocking mAbs have led to a high rate of objective tumor responses.Citation15 In addition, large clinical trials have recently shown that antibody-mediated blockade of PD-L1 also leads to significant clinical responses in lung, renal, and bladder carcinomas, as well as several other solid tumors,Citation16-Citation18 revealing the extraordinary broad usefulness of this therapy. The associated biomarker study supports a model where high CD8+ T cell infiltration at the invasive tumor margin combined with expression of PD-1 by tumor infiltrating CD8+ T cells predicts response to anti-PD-L1 blockade.Citation19 Despite these major improvements, many patients remain refractory to the treatments. In recent years, combination immunotherapies are increasingly developed. Targeting both CTLA-4 and PD-1 has shown good clinical response rates, from 15% to 80% depending on the cancer type.Citation7 Current research focuses on additional inhibitory receptors and the potential use of novel combination therapies targeting additional pathways to further increase the response rates. Among potential targets, LAG-3 (Lymphocyte Activated Gene 3), BTLA (B and T Lymphocyte Attenuator) and TIM-3 (T cell Immunoglobulin and Mucin-containing protein 3) have emerged as possible candidates based on encouraging results in pre-clinical studies in mouse models and in clinical trials.Citation12,Citation20,Citation21 In the model of CT26 colon adenocarcinoma, the combination of anti-PD-L1 and anti-TIM-3 increased tumor control and cytokine production by T cells.Citation22 Similarly, the combination of anti-PD-1 and anti-LAG-3 antibodies restrained tumor development in mice injected with Sa1N fibrosarcoma or MC38 colon adenocarcinoma.Citation23 As PD-1, LAG-3 and TIM-3, BTLA is expressed on tumor specific T cells, for instance in human melanoma.Citation24 BTLA blockade enhanced production of IFNγ by NY-ESO-1 specific human CD8 T cells in vitroCitation25 or induced a better control of tumor development in tumor prone mice upon vaccination.Citation26 The experimental options to investigate and to compare the specific effects of these blocking mAbs on human anti-tumor responses remain limited, restricted to the bioavailability of specimens for ex–vivo assays. In this study, we established a sensitive in vitro model based on expanded autologous tumor-infiltrating lymphocytes (TILs) and melanoma cell lines obtained from tumor specimens of melanoma patients, with the aim to study the direct interactions of T cells with tumor cells and the effects of antibodies targeting inhibitory receptors used either alone or in combination with anti-PD-1 mAb. Thanks to the use of expanded TILs and of melanoma cell lines, this system provides sufficient material to perform multiple comparisons while remaining robust and reproducible. It includes a broad spectrum of CD4 and CD8 T cells reacting against autologous cancer cells based on recognition of real-life endogenously expressed tumor antigens. There is no requirement for adding antigens by means of synthetic peptides/proteins or gene transfer. Here we describe that the 5-day blockade of LAG-3 alone or together with anti-PD-1 increased tumor cell control, T cell accumulation, cytotoxic potential and production of IFNγ.
Results
Checkpoint blockade does not affect tumor-infiltrating CD8 T cell functionality in a short-term peptide stimulation assay
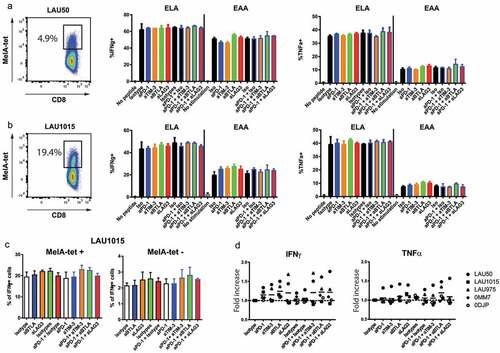
We first evaluated the activity of checkpoint blockade in a standard short-term assay for intracellular cytokine staining upon antigen-specific stimulation of CD8 T cells using T2 cells loaded with Melan-A peptide. The T2 cells express low but significant levels of PD-L1, PD-L2 and HVEM. They also express HLA-I but no HLA-II at their surface (Supplementary Figure 1). The checkpoint blockade mAbs used were anti-PD-1, anti-TIM-3, anti-BTLA and anti-LAG-3 mAbs. PD-1 blocking being used as a backbone for most immunotherapies,Citation7 we also chose to use anti-PD-1 in combination with any of the other three aforementioned mAbs. We performed this assay on ‘rapid expansion protocol’ (REP)-treated TILs that contained high amounts of MelanA-specific CD8 + T cells, including TILs from patients LAU50 (around 5% of MelanA-specific CD8 + T cells) and LAU1015 (around 19% of MelanA-specific CD8 + T cells) (); Supplementary Figure 2A shows the ‘REP’ procedure on TIL). In the short-term stimulation assay, TILs were pre-incubated for one hour with the indicated checkpoint blocking mAbs. T2 cells were loaded either with the native Melan-A26-35 peptide (EAAGIGILTV, shortened as EAA) or with a modified Melan-A26-35(A27 L) peptide that displays a stronger binding capacity to the MHC-I molecule HLA-A2 (ELAGIGILTV, shortened as ELACitation27). These peptide-loaded T2 cells were added to mAb-incubated TIL for 5 hours (i.e. the indicated mAbs were present throughout the assay). Stimulation with the modified ELA peptide induced a larger fraction of TILs positive for IFNγ or TNFα compared to the stimulation with the native EAA peptide (60% and 45% of IFNγ+ versus 50% and 25% for LAU50 and LAU1015, respectively). However, we did not observe any significant change associated with any of the antibodies tested, either alone or in combination. We hypothesized that after the ‘REP’, TILs regain their functionalityCitation28 and that they require exposure to their autologous tumors to display loss of capacity to produce cytokines. To test this hypothesis, we performed the same experiments by replacing T2 cells with autologous melanoma cell lines from 5 patients in the presence of the indicated mAbs (). For patients with MelanA multimer-positive (MelA-tet+) CD8+ T cells, both MelA-tet+ and MelA-tet- CD8 + T cells produce IFNγ, but with a much higher frequency in the MelA-tet+ population, reaching the levels observed after EAA-loaded T2 cells for patient LAU1015 (20% of IFNγ+ cells, ). By combining the results of all 5 patients, we did not find an antibody or a combination of antibodies that consistently increased cytokine production. Our interpretation was that TILs likely need to remain in contact with cognate antigen-positive tumor cells for longer periods in order to display tumor-associated loss of function, a condition that would then maximize chances of observing functional recovery effects of the blocking mAbs.
Figure 1. Checkpoint blockade does not consistently increase cytokine production by TILs in short-term assays. TILs from patients LAU50 (a) or LAU1015 (b) were pre-incubated for one hour with the indicated antibodies (Abs) and incubated with T2 cells loaded with Melan-A/MART-1 peptides ELAGIGILTV (“ELA”; analog) or EAAGIGILTV (“EAA”; wildtype) for 5 hours in the presence of Brefeldin and of the indicated blocking antibodies. T cells were labeled with ELA-multimers and anti–IFNγ and anti-TNFα Abs. Melan-A specific cells within each patient’s cells (left panel) as well as representative percentages of IFNγ+ and TNFα+ within multimer+ cells are shown. (c-d) TILs from 5 patients (LAU50, LAU1015, LAU1660, 0MM7, 0DJP) were pre-incubated for one hour with the indicated mAbs and were co-cultured with their respective autologous melanoma cell lines for 5 hours in the presence of Brefeldin before intracellular labeling with anti–IFNγ and anti-TNFα Abs. (c) IFNγ production from one representative patient sample in multimer+ and multimer- CD8 T cells (LAU1015) is shown. (d) Average of at least two independent experiments per patient sample is shown
Inhibitory receptor expression on T cells during co-culture with autologous melanoma cells
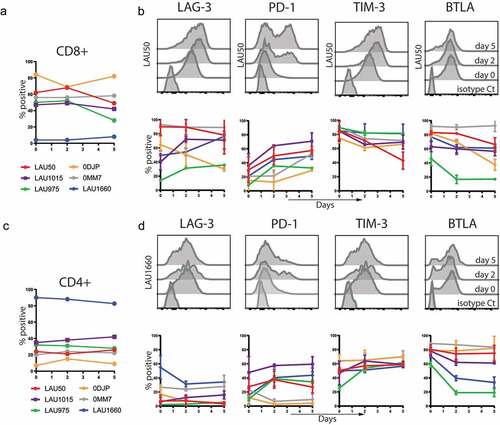
For long-term assays, we co-cultured autologous TILs and melanoma cell lines for 5 days. To assess whether our model was suitable for testing the effect of blocking mAbs targeting inhibitory receptors, we first measured the expression of inhibitory receptors and their ligands during the co-culture. We studied the kinetic of expression of LAG-3, PD-1, TIM-3 and BTLA at the surface of the CD8+ and CD4+ T cells from six different patients. As expected based on patient heterogeneity and on previous reports using REP, the proportions of CD8+ versus CD4+ T cells after the ‘REP’ was quite variable. For most of the patients (LAU50, LAU1015, LAU975, 0DJP and 0MM7), we found a majority of CD8 + T cells compared to CD4 + T cells, and the percentage of CD8+ and CD4+ cells remained globally stable throughout the 5 days of co-culture with the autologous melanoma cells (). LAU1660 had a peculiar profile with a vast majority of cells being CD4 + T cells (from 82 to 90%) and only 4 to 8% of CD8 + T cells, percentages that remained stable throughout the culture (). On CD8 + T cells, LAG-3 expression at day 0 was heterogeneous (from 18 to 92%) and increased during the co-culture for 5 out of 6 patients (all except patient 0DJP). On CD4 + T cells, LAG-3 expression remained under 40% of the cells throughout the culture without noticeable variations. PD-1 was expressed on a rather low proportion of CD8 + T cells at the beginning of the co-culture (from 5 to 38%) but its expression increased for all 6 patients to reach 30 to 70% of the cells at day 5. The profile and evolution of PD-1 expression was more heterogeneous on CD4 + T cells, with a low level of expression at day 0 (12 to 45%) and a decrease (0MM7, 0DJP), a stable expression (LAU50, LAU1015) or an increase (LAU975, LAU1660) during the co-culture. TIM-3 and BTLA were both expressed at intermediate-to-high levels on CD8+ and CD4 + T cells before co-culture. While TIM-3 expression remained mostly stable during the co-culture, BTLA expression decreased in most patients for CD8+ and CD4 + T cells (). Altogether, these data show that the targets to be blocked are expressed by substantial fractions of both CD4+ and CD8 + T cells in the co-culture model.
Figure 2. Characterization of Inhibitory Receptors surface expression on TILs during co-culture with autologous melanoma cell lines. TILs from the indicated patients were stained with the indicated mAbs before co-culture (day 0) or 2 and 5 days after the co-culture with autologous melanoma cell lines. Percentages of CD8+ (a) and CD4+ (c) in the TILs are shown. Average with Standard Deviation of at least two independent experiments per patient and representative histograms of the indicated molecules for CD8+ (b) or CD4+ T cells (d) are shown
Inhibitory ligand expression on melanoma cells during the co-culture with autologous TILs
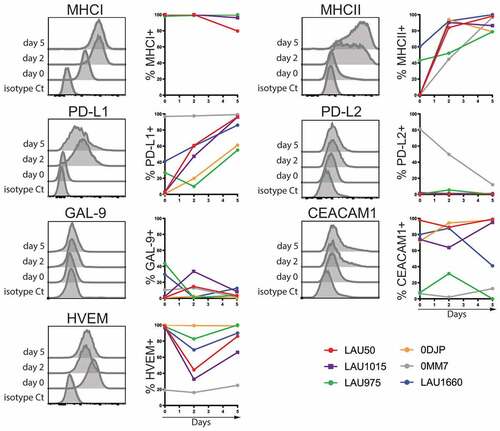
In parallel, we also characterized the expression of the known ligands of PD-1, LAG-3, BTLA and TIM-3 at the surface of the melanoma cell lines we have derived from the patients’ samples (Supplementary Figure 2). All cell lines were Major Histocompatibility Class I (MHC-I) positive and increased MHC-I expression during the co-culture (). MHC class II molecules, known to be a ligand for LAG-3, were weakly expressed on the cell lines at the beginning of the culture. However, MHC-II rapidly and strongly increased on all cell lines at day 2 and 5 (). For the ligands of PD-1, we observed that PD-L1 (B7-H1) follows the exact same trend as MHC-II, while PD-L2 (B7-DC) is not expressed by the melanoma cells except on the 0MM7 cell line. Several ligands for TIM-3 have been described, including GAL-9 (Galectin-9), CEACAM-1 and HMGB1. We focused on the surface expression of GAL-9 and CEACAM-1. Of note, Galectin-9 is detected intracellularly in all melanoma cell lines (not shown) but its expression at the surface remains low during the co-culture with T cells. CEACAM-1 labeling discriminated two groups of tumors: the ones with low levels of CEACAM-1 (LAU975 and 0MM7) versus the ones with stably high levels (LAU50, LAU1015, LAU1660 and 0DJP). Finally, for BTLA, we assessed expression of its ligand HVEM (Herpes Virus Entry Mediator). All melanoma cell lines, except 0MM7, expressed high levels of HVEM at the beginning of the co-culture. Although the percentage of HVEM+ cells remained high, there was a slight-to-moderate decrease in HVEM expression during the co-culture, reverting to initial levels by day 5 ().
Figure 3. Characterization of inhibitory receptor (IR)-ligand surface expression on melanoma cells during co-culture with autologous TILs. Melanoma cell lines from the indicated patients were labeled with the indicated mAbs before co-culture (day 0) or 2 and 5 days after the co-culture with autologous TILs. Representative histograms from patient LAU1015 are shown. Average with Standard Deviation of at least two independent experiments per patient and representative histograms of the indicated molecules are shown
In conclusion, we show that both the targeted inhibitory receptors and their ligands were expressed in our TILs/melanoma co-culture system and validated this system as potentially useful to characterize functional effects of the blocking mAbs.
Anti-LAG-3 alone or combined with anti-PD-1 promote T cell responses and tumor control
We performed similar co-culture experiments to test the effect of the various mAbs combinations in our system. At the end of the culture, we monitored by flow cytometry T cell and melanoma cell numbers, T cell division, expression of activation markers (CD137, CD25) and inhibitory receptors. A big advantage of our system is that it needs only low numbers of TILs, ranging from 104 to 3 × 10⁴ cells as starting material depending on the patients, allowing us to test multiple combinations of mAbs (Supplementary Figure 2). Early experiments showed that the presence of blocking mAbs was affecting melanoma cell numbers and T cell numbers but had little effect on the expression of activation markers on T cells (CD137, Granzyme B, CD25, data not shown). Numbers of T cells and of melanoma cells in the culture were normalized by using counting beads (Supplementary Figure 3A), and with the isotype control condition (isotype control corresponding to the anti-PD-1 mAb), to be able to merge the data from experiments performed on 5 patients (Supplementary Figure 3A). Compared to isotype control, we found a significant decrease of melanoma cell numbers in the presence of anti-LAG-3 alone as well as with combinations of anti-PD-1 with anti-TIM-3, anti-BTLA or anti-LAG-3 (). Quite surprisingly, anti-TIM-3 alone significantly increased melanoma cell numbers. When looking at CD8+ T cell numbers, anti-PD-1, anti-BTLA and anti-LAG-3 alone or anti-PD-1 together with anti-LAG-3 induced higher numbers compared to isotype controls (). The combination of anti-PD-1 with any other blocking mAb did not increase significantly the number of CD8+ T cells.
Figure 4. Combination of anti-PD-1 and anti-LAG-3 potently restrains tumor cell growth in a long-term autologous TILs/melanoma co-culture system. Co-culture with TILs and autologous melanoma cell lines from 5 patients was carried out for 5 days in the presence of the indicated mAbs. We determined (a) the total number of melanoma cells and (b) the total number of CD8 + T cells at the end of the co-culture and normalized these numbers with the numbers found in the isotype only condition. Independently, we calculated the ratio between the numbers of CD8+ T cells and tumor cells for each experimental point and normalized this ratio with the isotype only condition. (a-c) Pooled data from the 5 patients with all experimental points are shown (n = 5 patients). (d) For each patient we calculated the mean of the ratio for at least 3 independent experiments per patient performed in duplicates. One way ANOVA (multiple comparison) was performed. Stars at the bottom (in black) correspond to the p value obtained when compared to the respective isotype control. Stars at the top (in blue) correspond to the p value obtained compared to the respective anti-PD-1 condition (alone or with isotype)
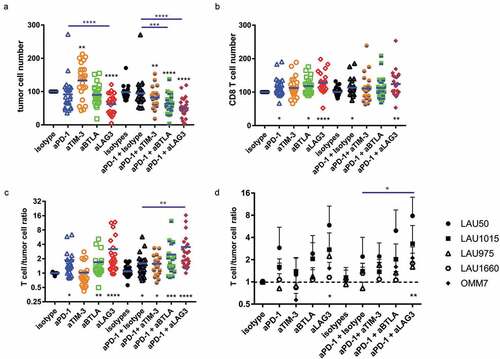
In order to assess the combined effects, i.e. tumor control and T cell numbers, we calculated for each experimental well the [T cell: melanoma cell number] ratio (Supplementary Figure 3B). Compared to isotype control, the presence of anti-PD-1, anti-BTLA and anti-LAG-3 alone or anti-PD-1 +anti-TIM-3, anti-BTLA or anti-LAG-3 was associated with an increased T cell: melanoma cell ratio (). Compared to anti-PD-1 alone, only the combination of anti-PD-1 with anti-LAG-3 significantly increased this ratio. We also assessed the results by stratifying the data per patient. We calculated the average of each experimental well for each patient. Again, only the combination of anti-PD-1 with anti-LAG-3 led to an averaged increased ratio compared to isotype control or anti-PD-1 alone (). Altogether, these data demonstrate that mAbs blocking inhibitory receptors can increase tumor control and T cell numbers in our co-culture model. The best combination consists of anti-PD-1 +anti-LAG-3, leading to reduced melanoma cell numbers and increased T cell numbers.
Combination of anti-PD-1 with anti-LAG-3 induces increased production of IFNγ and cytotoxic potential of CD8+ T cells
To further evaluate the effects of the mAbs on the TILs’ response, we measured IFNγ concentrations in the supernatants at the end of the co-culture. For patients LAU50 and LAU1015, the presence of anti-LAG-3 mAb alone or in combination with anti-PD-1 induced a higher level of IFNγ (). For LAU1660, only the combination of anti-PD-1 together with anti-LAG-3 increased IFNγ production (). This result correlates with what we observed in terms of tumor control, as for LAU1660, anti-LAG-3 alone did not increase the T cell/tumor ratio (). On the other hand, both anti-LAG-3 mAb alone or in combination with anti-PD-1 mAb had significant effects on tumor control for LAU50 and LAU1015.
Figure 5. Anti-PD-1 plus anti-LAG-3 combination increases IFNγ production by CD8 + T cells. (a-c) Co-culture of TILs and autologous melanoma cell lines from 3 patients were performed for 5 days in the presence of the indicated mAbs. Supernatants were recovered at the end of the co-culture and used for ELISA to determine IFNγ concentrations. Pooled data from at least 2 independent experiments performed in duplicates are shown for patients LAU50 (a), LAU1015 (b) and LAU1660 (c). (d) T cells were collected at the end of the co-culture and used for a 51Cr killing assay with their autologous melanoma cell lines. CD8 T cell/target cell ratio was 6:1 and 15:1 for LAU50 and 0MM7, respectively. Data are pooled results from 2 independent experiments for each patient’s samples. (e,f) CD8+ and CD4+ T cells were isolated from TILs of patient LAU50. They were used for co-cultures alone or mixed together at a similar ratio as the TILs (2/3 CD8+, 1/3 CD4+). (e) After 5 days of co-culture with the autologous melanoma cell line, we determined the T cell/melanoma cell ratios. (f) IFNγ concentrations in the supernatant were measured at the end of the co-culture. Results are representative of 2 independent experiments
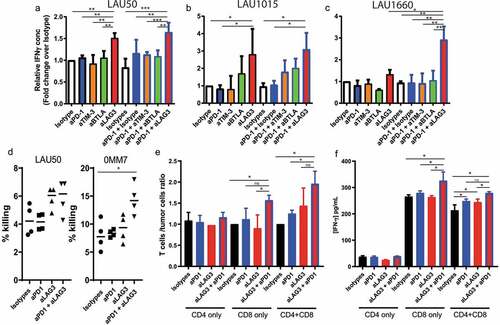
To determine whether blocking mAbs affected the lymphocytes’ killing capacity, we isolated T cells at the end of the co-culture with anti-PD-1, anti-LAG-3, both mAbs or isotype controls. We then performed a classical 51 Cr killing assay, using the autologous melanoma cell lines as targets. A slight but consistent increase in killing was measured for the T cells from patient LAU50 after co-culture with anti-LAG-3 alone or combined with anti-PD-1. For patient 0MM7 only the combination of both mAbs led to significant increase of melanoma killing. Together, our data suggest that the killing capacity is also increased by the combination of anti-LAG-3 and anti-PD-1 mAbs.
To decipher whether the mAbs were targeting primarily CD4+, CD8+ or both types of T cells, we sorted CD4+ or CD8+ T cells from LAU50 and incubated them separately with their autologous melanoma cell line. We used the total CD4 or CD8 T cell number that would correspond to the condition with the unsorted sample. We also mixed back CD4+ and CD8+ T cells to the same proportion than in the initial sample (60% CD8+ and 40% CD4 + T cells) and co-cultured them as previously described with the indicated mAbs. CD4 + T cells alone had no effect on tumor progression. Their IFNγ production was not affected by the mAbs we tested (). By contrast, we found that the anti-PD-1/anti-LAG-3 combo increased the T cell/tumor ratios as well as IFNγ on CD8+ T cells alone, or mixed with CD4+ T cells (). This strongly suggests that the combo mostly acts on CD8+ T cells during our co-culture system.
Discussion
Anti-PD-1/PD-L1 agents are the backbone for many clinical trials in various types of cancer and they have been combined with other treatments specific for up to 240 different targets to date.Citation29 Pre-clinical studies can be performed in mouse models, but the possibility to test these combinations in human settings remains limited. Our aim was to develop a human in vitro system that allows the screening of molecules or antibodies targeting T cells or tumor cells to test their ability to improve tumor elimination. While standard short-term T cell functional assays did not reveal significant effects, we found that 5-day co-culture using autologous expanded T cells and melanoma cells was a reliable system to screen for checkpoint blockade used alone or in combination. While anti-LAG-3 alone was favorable to some degree, the highest anti-tumor effects in our system were achieved with the combination of anti-PD-1/anti-LAG-3, showing both enhanced tumor cell growth control and increased T cell numbers. In contrast, anti-PD-1 alone or anti-PD-1 in combination with anti-TIM-3 or anti-BTLA were inefficient. We found a correlation between higher production of IFNγ and better tumor control using anti-PD-1/anti-LAG-3. We also showed that this effect was mediated through CD8 T cells, rather than CD4 T cells or a combined effect. We could not clearly address whether enhanced tumor killing by CD8 T cells or increased levels of cytokines, such as IFNγ, were the main factors mediating tumor cell numbers’ decrease. As both the cytotoxic capacity and the levels of IFNγ were increased after PD-1/LAG-3 blocking, it is likely that both factors are important in the process.
Our results corroborate what has been observed in mouse models using transplanted tumor cell lines, with a synergistic effect on tumor elimination in response to anti-PD-1 plus anti-LAG-3 treatment.Citation23 A study in human epithelial ovarian cancer showed that the same combination increased cytokine production by NY-ESO-1 specific CD8 T cells.Citation30 Two studies on melanoma patients using complementary approaches studied the expression of MHC-II by tumor cells. One used classical immuno-histology staining on 16 to 18 paraffin embedded tumor sections from melanoma patients.Citation31 The other one was based on the analysis of MHC-II expression at the mRNA level on 60 melanoma cell lines, as well as on 67 tissue microarrays of human melanoma patient samples.Citation32 In both studies, 30 to 40% of the tumors expressed MHC-II molecules. These patients could potentially benefit from treatment regimens targeting LAG-3.Citation31,Citation32 According to the website clinicaltrias.gov, there is a total of 72 ongoing trials (40 of them phase 2/3) using anti-LAG-3 or LAG-3-Ig fusion as monotherapies or in combination with other molecules, particularly with anti-PD-1. Many cancer types are under investigation, including myeloma, glioblastoma, head and neck cancer, colorectal cancer and melanoma. This tremendous clinical development is based on the substantial encouraging preclinical evidence, both in vitro and in animals. Our study adds to this evidence. Ultimately, the clinical trial results will decide whether targeting LAG-3 alone or in combination with PD-1 has a future.
Interestingly, our short-term assay focusing on cytokine production upon stimulation with peptide-loaded antigen presenting cells (T2) could not discriminate between the various combinations of blocking mAbs. We detected some effects of various mAbs alone or in combination, but were unable to find consistently significant results with the TIL of the 5 patients tested. We found quite homogenous expression of inhibitory receptors on these patient’s expanded T cells. This ruled out the possibility of high variability of the target receptor as a potential explanation for this lack of effect. Regarding the tumor cells, 3 out of 6 cell lines had significant to high levels of PD-L1 (0MM7, LAU975, LAU1660) and 1 cell line of PD-L2 (0MM7). However, blocking of PD-1 for 0MM7 did not improve cytokine production. Looking more specifically, blocking of BTLA for patient LAU975 led to increased production of IFNγ and TNFα despite the fact that this patient showed the lowest expression of BTLA.
When stimulated with their autologous melanoma cells, the T cells from some patients (LAU1015, 0DJP, 0MM7) did not increase cytokine production with any mAb. Several reasons may account for the failure to inhibitory receptor blocking in short-term assays. It was described that the presence of Glycocalyx on T cells could prevent efficient checkpoint blocking.Citation33 It may be possible that blocking mAbs should be incubated for a longer time period to exert their functions and to overcome this barrier. Alternatively, TILs expanded using the REP protocol may be too active to be able to detect effects by blocking mAbs. A longer period in the presence of the tumor may dampen their activation, rendering effects of blocking mAbs more visible. While melanoma cells by themselves produce immunosuppressive cytokines and metabolites that directly inhibit T cell activity, these mechanisms may require more time to become effective.Citation4 We found that extending the culture time to 5 days in the presence of melanoma cells allowed a better homogenization of the effects of blocking mAbs.
Interestingly, we found that blocking TIM-3 in our co-culture system led to an increase in melanoma cell numbers. TIM-3 was found highly expressed on exhausted TILs, together with other inhibitory receptors.Citation34 Its expression together with high level of PD-1 defined a highly inactive subset of CD8 T cells in tumors.Citation35 Despite being described as an inhibitory receptor, results in mouse models also showed that the function of TIM-3 is not as clear as previously thought. Some studies showed that blocking TIM-3 had no effect on tumor development,Citation22 while some measured a beneficial effect of the treatment.Citation36 On top of effector T cells, TIM-3 is expressed by a variety of other immune cells, including macrophages, NK cells, DCs and mast cells. As previously introduced, TIM-3 has several known ligands. Consequently, the in vivo mechanistic of how the blocking of TIM-3 is active is still not well defined. In other settings, such as acute infection, TIM-3 expression is associated with a better short-term effector function.Citation37 One possible explanation for these contradictory reports is related to the expression of CEACAM-1, which would regulate the inhibitory function of TIM-3 in T cells.Citation38 In our settings, T cells co-expressed both TIM-3 and CEACAM-1 (not shown). TIM-3 is expressed by tumor cells upon TGFβ stimulation.Citation39 In our model, melanoma cell lines had really limited expression of TIM-3 (not shown). Further studies would be required to understand how blocking TIM-3 affect tumor control by T cells.
Since our experimental system only includes tumor cells and autologous T cells, it does not provide insights in possible involvement of other cell populations such as myeloid cells and fibroblasts. In turn, it provides selective information on the direct interaction of T cells with tumor cells. Therefore, this system complements other existing approaches, particularly for the study of intratumoral effector T cell responses. Our results suggest that LAG-3 and PD-1 are involved in the regulation of these responses.
Material and methods
Human cell preparation and isolation
Melanoma cell lines were generated from patients with histologically proven melanoma. HLA-A2pos/TAP-deficient T2 cells were obtained from the ATCC (CRL-1992). Peripheral blood mononuclear cells (PBMC) were isolated from fresh whole blood using LymphoprepTM (Axis-Shield Density Gradient Media). Culture medium (HS medium) was prepared as follows: RPMI supplemented with penicillin/streptomycin (Gibco), L-glutamine (Gibco), non-essential amino acid (Gibco), Na pyruvate (Gibco), Kanamycin (Gibco), 2β-mercaptoethanol (Sigma) and 8% of human serum (HS). In some experiments, CD4 + T cells and CD8 + T cells were positively isolated with magnetic beads (Miltenyi Biotec).
Rapid expansion protocol
Pieces of biopsies were cultured in the presence of 100 U of IL-2, until sufficient proliferation of lymphocytes was reached, usually after 2 to 3 weeks. At that stage, cells were frozen and stored in liquid nitrogen. After thawing, TILs were amplified by a Rapid Expansion Protocol. For 0.5*106 TILs, 50 × 106 irradiated feeders were added, in the presence of anti-CD3 antibody (30 ng/ml) and high dose IL-2 (3000 U/ml). Cells were frozen after sufficient expansion (obtained after 10 to 14 days).
Cell culture and flow cytometry
Melanoma cells were seeded and incubated for 24 h at 37°C and 5% of CO2 before co-culture. In parallel, TILs were thawed in HS medium and incubated overnight at 37°C and 5% of CO2 in presence of DNAse I (Sigma) and IL-2 (Proleukin®, Roche; 100 U/mL). Before culture, TILs were labeled with cell trace violet (CTV, Invitrogen) and melanoma cells and TILs were counted using AccuChip (nanoEntenk) with an automatic cell counter device (Adam, Witeg Ag). The following mAbs were used when indicated: isotype huIgG4 Pro, huIgG1ko and RatIgG2a anti-TIM-3 (344823, R&D, RatIgG2a), anti-BTLA (E4H9, IgG1ko), anti-PD-1 (pembrolizumab, IgG4 Pro) and anti-LAG-3 (25F7, IgG1ko) monoclonal antibodies (mAbs). IgG4Pro contains a Proline mutation that eliminates half-mer formation and prevents Fab-arm exchange with endogenous IgG4. huIgG1KO contains a LALA mutation that decreases binding to FcγRI, II, III, losing ADCC, ADCP and CDC functions. All blocking mAbs were used at 1 µg/mL. At day 5, total cells (melanoma and TIL) were collected and stained for 20 minutes at 4°C with LIVE/DEAD Fixable Aqua Dead Cell Stain Kit (Thermofisher). After washing, cells were incubated 30 minutes with Fc-Block (Miltenyi) then labeled with anti-MHC-I (Biolegend), anti-PD-L1 (BD Biosciences), anti-GAL-9, anti-HVEM, anti-MHC-II, anti-PD-L2, anti-CEACAM1, anti-BTLA (BD Biosciences), anti-TIM-3 (Invitrogen), anti-CD4 (Beckman Coulter), and anti-CD8 (BD Biosciences) mAb. Cells were analyzed by flow cytometry with a Fortessa or LSRII machine (BD Biosciences) and with FlowJo software (Tree Star). At day 5, supernatants were harvested and stored at −20°C prior to determining the IFN-γ content.
Multimer staining
When indicated, cells were incubated with HLA-A*0201/Melan-A (ELAGIGILTV)- multimers (UNIL multimer facility) in FACS buffer and incubated during 30 minutes at room temperature in the dark. Cells were washed in FACS buffer and incubated 30 minutes at 4°C with the surface antibodies mix and with Vivid aqua during 30 minutes at 4°C followed by a fixation with 4% paraformaldehyde.
Stimulation for intracellular cytokine staining
For intracellular stainings, BrefeldinA was added to the cultures at the beginning of the stimulation (final concentration: 10 μg/ml, Sigma Aldrich). The cells were washed once with PBS, stained for 30 minutes at 4°C with the dead cell marker LIVE/DEAD Fixable Aqua Dead Cell Stain Kit (Thermofisher). Afterward, cells were washed with FACS buffer (PBS supplemented with 5 mM EDTA, 0.2% BSA and 0.2% NaAzide), and extracellular staining was performed for 20 minutes at 4°C. Next, cells were fixed for 20 minutes at room temperature in FIX buffer (PBS containing 1% Formaldehyde, 2% Glucose, 5 mM NaAzide) and permeabilized with FACS buffer containing 0.1% saponin (Sigma Aldrich) and subsequently stained with anti–IFNγ and anti-TNFα Abs for 30 minutes at 4°C.
51Cr killing assay
Lytic activity was assessed in 4 h 51Cr release assays which conducted using 51Cr-labeled melanoma cell lines Me275 or 0MM7. The percentage of specific lysis was calculated as: 100× ((experimental-spontaneous release)/(total-spontaneous release)).
ELISA
ELISA for IFNγ was performed according to manufacturer instructions (Human IFN gamma ELISA Ready-SET-Go; Invitrogen).
Statistical analysis
Comparisons between groups were performed using ANOVA test (with Tukey post hoc test for multiple comparison). All statistical analyzes were carried out with GraphPad Prism software. Error bars represent Standard Deviations (SD).
Author Contributions
N.G, D.Sa, C.M and L.T performed the experiments. G.V, D.Sp, M.Z and I.T designed the experiments. G.V, D.Sp, I.T, S.FM wrote, reviewed and/or revised the paper.
Availability of Data and Materials
The datasets generated and analyzed during this study are not publicly available to protect patient privacy but are available from the corresponding author on reasonable request.
Consent for Publication
Full consent for the publication was obtained.
Disclosure of Potential Conflicts of Interest
Markus Zettl was an employee of Boehringer Ingelheim RCV GmbH & CoKG at the time of data generation. Current address: Pieris Pharmaceuticals GmbH. Freising (Germany). Iñigo Tirapu is an employee of Boehringer Ingelheim RCV GmbH & CoKG. The other authors declare no conflict of interest.
Ethics approval
Blood and tumor tissue were obtained as part of the LUD00-018 Phase I clinical trial (Trial Number NCT00112229) at the Center Hospitalier Universitaire Vaudois (CHUV) in Lausanne. The study was conducted according to the relevant regulatory standards, upon approval by Swissmedic (the regulatory agency of Switzerland) and the “Commission d’Ethique de la Recherche Clinique de la Faculté de Biologie et de Médecine, Université de Lausanne. Patients were enrolled upon written informed consent.
Supplemental Material
Download ()Acknowledgments
We thank all the members of our labs for their great support. We thank Camilla Jandus for criticism on the manuscript.
Supplementary material
Supplemental data for this article can be accessed on the publisher’s website.
Additional information
Funding
References
- Anderson KG, Stromnes IM, Greenberg PD. 2017. Obstacles posed by the tumor microenvironment to T cell activity: a case for synergistic therapies. Cancer Cell. 31:311–10. doi:10.1016/j.ccell.2017.02.008.
- Callahan MK, Postow MA, Wolchok JD. 2016. Targeting T cell co-receptors for cancer therapy. Immunity. 44:1069–1078. doi:10.1016/j.immuni.2016.04.023.
- Jenkins RW, Barbie DA, Flaherty KT. 2018. Mechanisms of resistance to immune checkpoint inhibitors. Br J Cancer. 118:9–16. doi:10.1038/bjc.2017.434.
- Speiser DE, Ho PC, Verdeil G. 2016. Regulatory circuits of T cell function in cancer. Nat Rev Immunol. 16:599–611. doi:10.1038/nri.2016.80.
- Wherry EJ, Ha SJ, Kaech SM, Haining WN, Sarkar S, Kalia V, Subramaniam S, Blattman JN, Barber DL, Ahmed R. 2007. Molecular signature of CD8+ T cell exhaustion during chronic viral infection. Immunity. 27:670–684. doi:10.1016/j.immuni.2007.09.006.
- Fuertes Marraco SA, Neubert NJ, Verdeil G, Speiser DE. 2015. Inhibitory receptors beyond T cell exhaustion. Front Immunol. 6:310. doi:10.3389/fimmu.2015.00310.
- Ribas A, Wolchok JD. 2018. Cancer immunotherapy using checkpoint blockade. Science. 359:1350–1355. doi:10.1126/science.aar4060.
- Odorizzi PM, Pauken KE, Paley MA, Sharpe A, Wherry EJ. 2015. Genetic absence of PD-1 promotes accumulation of terminally differentiated exhausted CD8+ T cells. J Exp Med. 212:1125–1137. doi:10.1084/jem.20142237.
- Mueller SN, Vanguri VK, Ha SJ, West EE, Keir ME, Glickman JN, Sharpe AH, Ahmed R. 2010. PD-L1 has distinct functions in hematopoietic and nonhematopoietic cells in regulating T cell responses during chronic infection in mice. J Clin Invest. 120:2508–2515. doi:10.1172/JCI40040.
- Wei SC, Levine JH, Cogdill AP, Zhao Y, Anang NAS, Andrews MC, Sharma P, Wang J, Wargo JA, Pe’er D, et al. 2017. Distinct cellular mechanisms underlie anti-CTLA-4 and anti-PD-1 checkpoint blockade. Cell. 170:1120–1133 e1117. doi:10.1016/j.cell.2017.07.024.
- Pardoll DM. 2012. The blockade of immune checkpoints in cancer immunotherapy. Nat Rev Cancer. 12:252–264. doi:10.1038/nrc3239.
- De Sousa Linhares A, Leitner J, Grabmeier-Pfistershammer K, Steinberger P. 2018. Not all immune checkpoints are created equal. Front Immunol. 9:1909. doi:10.3389/fimmu.2018.01909.
- Walunas TL, Lenschow DJ, Bakker CY, Linsley PS, Freeman GJ, Green JM, Thompson CB, Bluestone JA. 1994. CTLA-4 can function as a negative regulator of T cell activation. Immunity. 1:405–413. doi:10.1016/1074-7613(94)90071-X.
- Schadendorf D, Hodi FS, Robert C, Weber JS, Margolin K, Hamid O, Patt D, Chen TT, Berman DM, Wolchok JD. 2015. Pooled analysis of long-term survival data from phase II and phase III trials of ipilimumab in unresectable or metastatic melanoma. J Clin Oncol. 33:1889–1894. doi:10.1200/JCO.2014.56.2736.
- Topalian SL, Hodi FS, Brahmer JR, Gettinger SN, Smith DC, McDermott DF, Powderly JD, Carvajal RD, Sosman JA, Atkins MB, et al. 2012. Safety, activity, and immune correlates of anti-PD-1 antibody in cancer. N Engl J Med. 366:2443–2454. doi:10.1056/NEJMoa1200690.
- Brahmer JR, Tykodi SS, Chow LQ, Hwu WJ, Topalian SL, Hwu P, Drake CG, Camacho LH, Kauh J, Odunsi K, et al. 2012. Safety and activity of anti-PD-L1 antibody in patients with advanced cancer. N Engl J Med. 366:2455–2465. doi:10.1056/NEJMoa1200694.
- Herbst RS, Soria JC, Kowanetz M, Fine GD, Hamid O, Gordon MS, Sosman JA, McDermott DF, Powderly JD, Gettinger SN, et al. 2014. Predictive correlates of response to the anti-PD-L1 antibody MPDL3280A in cancer patients. Nature. 515:563–567. doi:10.1038/nature14011.
- Powles T, Eder JP, Fine GD, Braiteh FS, Loriot Y, Cruz C, Bellmunt J, Burris HA, Petrylak DP, Teng SL, et al. 2014. MPDL3280A (anti-PD-L1) treatment leads to clinical activity in metastatic bladder cancer. Nature. 515:558–562. doi:10.1038/nature13904.
- Tumeh PC, Harview CL, Yearley JH, Shintaku IP, Taylor EJ, Robert L, Chmielowski B, Spasic M, Henry G, Ciobanu V, et al. 2014. PD-1 blockade induces responses by inhibiting adaptive immune resistance. Nature. 515:568–571. doi:10.1038/nature13954.
- Zappasodi R, Merghoub T, Wolchok JD. 2018. Emerging concepts for immune checkpoint blockade-based combination therapies. Cancer Cell. 33:581–598. doi:10.1016/j.ccell.2018.03.005.
- Patel SA, Minn AJ. 2018. Combination cancer therapy with immune checkpoint blockade: mechanisms and strategies. Immunity. 48:417–433. doi:10.1016/j.immuni.2018.03.007.
- Sakuishi K, Apetoh L, Sullivan JM, Blazar BR, Kuchroo VK, Anderson AC. 2010. Targeting Tim-3 and PD-1 pathways to reverse T cell exhaustion and restore anti-tumor immunity. J Exp Med. 207:2187–2194. doi:10.1084/jem.20100643.
- Woo SR, Turnis ME, Goldberg MV, Bankoti J, Selby M, Nirschl CJ, Bettini ML, Gravano DM, Vogel P, Liu CL, et al. 2012. Immune inhibitory molecules LAG-3 and PD-1 synergistically regulate T-cell function to promote tumoral immune escape. Cancer Res. 72:917–927. doi:10.1158/0008-5472.CAN-11-1620.
- Derre L, Rivals JP, Jandus C, Pastor S, Rimoldi D, Romero P, Michielin O, Olive D, Speiser DE. 2010. BTLA mediates inhibition of human tumor-specific CD8+ T cells that can be partially reversed by vaccination. J Clin Invest. 120:157–167. doi:10.1172/JCI40070.
- Fourcade J, Sun Z, Pagliano O, Guillaume P, Luescher IF, Sander C, Kirkwood JM, Olive D, Kuchroo V, Zarour HM. 2012. CD8(+) T cells specific for tumor antigens can be rendered dysfunctional by the tumor microenvironment through upregulation of the inhibitory receptors BTLA and PD-1. Cancer Res. 72:887–896. doi:10.1158/0008-5472.CAN-11-2637.
- Lasaro MO, Sazanovich M, Giles-Davis W, Mrass P, Bunte RM, Sewell DA, Hussain SF, Fu YX, Weninger W, Paterson Y, et al. 2011. Active immunotherapy combined with blockade of a coinhibitory pathway achieves regression of large tumor masses in cancer-prone mice. Mol Ther. 19:1727–1736. doi:10.1038/mt.2011.88.
- Speiser DE, Wieckowski S, Gupta B, Iancu EM, Baumgaertner P, Baitsch L, Michielin O, Romero P, Rufer N. 2011. Single cell analysis reveals similar functional competence of dominant and nondominant CD8 T-cell clonotypes. Proc Natl Acad Sci USA. 108:15318–15323. doi:10.1073/pnas.1105419108.
- Zippelius A, Batard P, Rubio-Godoy V, Bioley G, Lienard D, Lejeune F, Rimoldi D, Guillaume P, Meidenbauer N, Mackensen A, et al. 2004. Effector function of human tumor-specific CD8 T cells in melanoma lesions: a state of local functional tolerance. Cancer Res. 64:2865–2873. doi:10.1158/0008-5472.CAN-03-3066.
- Tang J, Yu JX, Hubbard-Lucey VM, Neftelinov ST, Hodge JP, Lin Y. 2018. Trial watch: the clinical trial landscape for PD1/PDL1 immune checkpoint inhibitors. Nat Rev Drug Discov. 17:854–855. doi:10.1038/nrd.2018.210.
- Matsuzaki J, Gnjatic S, Mhawech-Fauceglia P, Beck A, Miller A, Tsuji T, Eppolito C, Qian F, Lele S, Shrikant P, et al. 2010. Tumor-infiltrating NY-ESO-1-specific CD8+ T cells are negatively regulated by LAG-3 and PD-1 in human ovarian cancer. Proc Natl Acad Sci USA. 107:7875–7880. doi:10.1073/pnas.1003345107.
- Baitsch L, Legat A, Barba L, Fuertes Marraco SA, Rivals JP, Baumgaertner P, Christiansen-Jucht C, Bouzourene H, Rimoldi D, Pircher H, et al. 2012. Extended co-expression of inhibitory receptors by human CD8 T-cells depending on differentiation, antigen-specificity and anatomical localization. PLoS One. 7:e30852. doi:10.1371/journal.pone.0030852.
- Johnson DB, Estrada MV, Salgado R, Sanchez V, Doxie DB, Opalenik SR, Vilgelm AE, Feld E, Johnson AS, Greenplate AR, et al. 2016. Melanoma-specific MHC-II expression represents a tumour-autonomous phenotype and predicts response to anti-PD-1/PD-L1 therapy. Nat Commun. 7:10582. doi:10.1038/ncomms10582.
- Demotte N, Wieers G, Van Der Smissen P, Moser M, Schmidt C, Thielemans K, Squifflet JL, Weynand B, Carrasco J, Lurquin C, et al. 2010. A galectin-3 ligand corrects the impaired function of human CD4 and CD8 tumor-infiltrating lymphocytes and favors tumor rejection in mice. Cancer Res. 70:7476–7488. doi:10.1158/0008-5472.CAN-10-0761.
- Baitsch L, Baumgaertner P, Devevre E, Raghav SK, Legat A, Barba L, Wieckowski S, Bouzourene H, Deplancke B, Romero P, et al. 2011. Exhaustion of tumor-specific CD8(+) T cells in metastases from melanoma patients. J Clin Invest. 121:2350–2360. doi:10.1172/JCI46102.
- Fourcade J, Sun Z, Benallaoua M, Guillaume P, Luescher IF, Sander C, Kirkwood JM, Kuchroo V, Zarour HM. 2010. Upregulation of Tim-3 and PD-1 expression is associated with tumor antigen-specific CD8+ T cell dysfunction in melanoma patients. J Exp Med. 207:2175–2186. doi:10.1084/jem.20100637.
- Ngiow SF, von Scheidt B, Akiba H, Yagita H, Teng MW, Smyth MJ. 2011. Anti-TIM3 antibody promotes T cell IFN-gamma-mediated antitumor immunity and suppresses established tumors. Cancer Res. 71:3540–3551. doi:10.1158/0008-5472.CAN-11-0096.
- Avery L, Filderman J, Szymczak-Workman AL, Kane LP. 2018. Tim-3 co-stimulation promotes short-lived effector T cells, restricts memory precursors, and is dispensable for T cell exhaustion. Proc Natl Acad Sci USA. 115:2455–2460. doi:10.1073/pnas.1712107115.
- Huang YH, Zhu C, Kondo Y, Anderson AC, Gandhi A, Russell A, Dougan SK, Petersen BS, Melum E, Pertel T, et al. 2015. CEACAM1 regulates TIM-3-mediated tolerance and exhaustion. Nature. 517:386–390. doi:10.1038/nature13848.
- Yan W, Liu X, Ma H, Zhang H, Song X, Gao L, Liang X, Ma C. 2015. Tim-3 fosters HCC development by enhancing TGF-beta-mediated alternative activation of macrophages. Gut. 64:1593–1604. doi:10.1136/gutjnl-2014-307671.