
ABSTRACT
A helpful evaluation system is crucial for the postoperative prognosis prediction of clear cell renal cell carcinoma (ccRCC) patients. This study determined the prognostic value of combining intratumoral RASSF10 expression and tumor-associated macrophages (TAMs) with the established clinicopathological indicators in ccRCC patients. RASSF10 expression was analyzed in ccRCC patient data from online databases and ccRCC cell lines. Two independent ccRCC patient cohorts were employed to examine the prognostic value of RASSF10 and other markers by immunohistochemistry (IHC) and statistical analyses. We found that RASSF10 expression was downregulated in ccRCC specimens from the TCGA datasets and three independent institutions. RASSF10 expression was negatively correlated with disease progression and TAM infiltration in ccRCC. In addition, low RASSF10 expression and high TAM infiltration predicted a high TNM stage, SSIGN score, WHO/ISUP grading, and a poor prognosis in two independent ccRCC patient cohorts. Moreover, RASSF10, CD68 or CD163, TNM stage, and SSIGN score were identified as independent risk factors in predicting ccRCC patients’ prognosis. Time-dependent c-index analyses revealed that the combination of RASSF10 and TAMs resulted in a higher index than that resulting from each alone in the postoperative prognosis of ccRCC patients, and the integration of RASSF10 and TAMs with the TNM stage or SSIGN score achieved the best accuracy in assessing the prognosis of ccRCC patients. These findings were validated in the randomized training, validation, and combined cohorts. Taken together, the combination of the RASSF10-TAM classifier and current clinical parameters yields superior accuracy in predicting the ccRCC patients’ postoperative outcome.
Introduction
Kidney cancer is among the most common cancers worldwide, with a high number of estimated new cases and deaths.Citation1 The most common pathological type of kidney cancer is clear cell renal cell carcinoma (ccRCC).Citation2 Patients with localized ccRCC are commonly treated with surgery, but the 5-year overall survival rates are still poor.Citation3 Therefore, it is necessary to identify helpful indicators for the risk stratification and postoperative surveillance of ccRCC patients, which would contribute to timely and effective clinical decision-making and improve the prognosis of ccRCC patients.Citation4
Currently, treatment decisions for ccRCC patients remain heavily dependent on the tumor-node-metastasis (TNM) staging system and clinicopathological parameters. However, these factors are difficult to distinguish between different subgroups of ccRCC patients for the development of personalized therapies.Citation5 Thus, molecular indicators have been identified to evaluate the postoperative prognosis of ccRCC patients. Many previous studies have reported that elevated levels of oncogenes or decreased levels of tumor suppressors predicted a poor prognosis in ccRCC patients, but many of them serve as a single model that is inferior in evaluating postoperative prognosis compared with multiple integrated biomarkers.Citation5-Citation7 Integrated prognostic scoring systems, including the University of California Los Angeles Integrated Staging System and the Mayo Clinic stage, size, grade, and necrosis score (SSIGN), have been developed,Citation5 and our previous study demonstrated that the integration of gankyrin expression and the established clinical indicators, such as TNM and SSIGN score, presented better accuracy in the predicted prognosis of RCC patients.Citation8
Although the above studies are promising, additional validation and the clinical follow-up of patients are necessary in routine clinical practice because these indicators are based only on ccRCC tissues and are limited to these tissues. In fact, the relapse and recurrence of ccRCC vary widely among patients and are influenced not only by tumor factors but also by stromal cells.Citation9,Citation10 Tumor-associated macrophages (TAMs), one of the important components of the stroma, can be influenced by tumors and facilitate the progression and metastasis of tumors.Citation11 Additionally, a recent study indicated that TAM-derived interleukin-23 (IL-23) enhances regulatory T cell (Treg) functions in glutamine-addicted tumors and promotes immune evasion.Citation12 Furthermore, CD163+ TAMs are useful for assessing the clinical prognosis of patients with ccRCC.Citation13 However, literature reporting whether the combination of intratumoral biomarkers, stromal markers, and the existing clinical parameters better predicts the postoperative prognosis of ccRCC patients is lacking. Thus, this study aimed to determine the prognostic value of the combination of intratumoral ras association domain-containing protein 10 (RASSF10) expression and TAMs into the set of clinicopathological indicators in patients with ccRCC.
RASSF10, a member of the ras association domain family, acts as a tumor suppressor in various types of malignant tumors, including lung cancer, hepatocellular carcinoma, breast cancer, and esophageal squamous cell carcinoma.Citation14-Citation17 Mechanistically, RASSF10 inhibits tumor proliferation and progression by activating the p53 signaling pathway or deregulating the JNK/c-Jun/AP-1 pathway.Citation18,Citation19 Moreover, recent studies have demonstrated that RASSF10 methylation is a potential docetaxel-resistant marker for human breast cancer and hepatocellular carcinoma, suggesting that RASSF10 is also a potential therapeutic target.Citation18,Citation20 Additionally, RASSF10, which is usually downregulated in tumor specimens, has been reported to be an indicator for patients’ prognosis.Citation21 The epigenetic silencing of RASSF10 is usually observed in tumors, and its hypermethylation serves as an independent prognostic factor in patients.Citation22 However, the expression and clinical significance of RASSF10 in ccRCC patients remain unknown.
In this study, we aimed to investigate the clinical significance of intratumoral RASSF10 expression and TAMs in ccRCC progression and prognosis and determine the benefit of combining the RASSF10-TAMs classifier with the existing clinical indicators, namely, TNM stage and SSIGN scores, to improve the accuracy of predicting postoperative prognosis of ccRCC patients over that of reported means.
Materials and methods
Analysis of The Cancer Genome Atlas (TCGA)
TCGA data were first downloaded using the FirebrowseR package, and the kidney renal clear cell carcinoma (KIRC) was selected from the TCGA cohorts. Then, we filtered out the ccRCC samples with barcodes and gene mRNA expression profiles. Gene expression profiles were then normalized using DESeq2 package, and RASSF10 expression was compared firstly between 479 tumor samples and 72 normal samples and was also compared in 62 paired samples. Wilcox test was used to compare the expression of RASSF10 between ccRCC and paracancerous tissues.
Patients and samples
A total of 375 paired ccRCC tissues and adjacent tissues of patients from three clinical centers (cohort 1, n = 110, Fudan University Shanghai Cancer Center, Shanghai, China; cohort 2, n = 143, Changhai Hospital, Shanghai, China; cohort 3, n = 122, Yijishan Hospital, Wuhu, China) were used to detect RASSF10 expression in ccRCC in the present study. Among the patients, cohort 1 and cohort 2 of ccRCC patients who were pathologically diagnosed between 2010 and 2013 were employed for this study to examine the prognostic value of RASSF10, TAMs and other markers. Two pathologists were blinded to the clinicopathological data and scored all samples independently. Another 55 paired ccRCC specimens were used for real-time PCR, and 20 paired ccRCC samples were used for Western blot assays. This study followed the recommendations from prognostic studies on tumor biomarkers (REMARK).Citation23 The clinical data of ccRCC patients such as age, gender, World Health Organization/International Society of Urological Pathology grading system (WHO/ISUP grading),Citation24 TNM stage, and SSIGN score are summarized in Supplementary Table S1. Furthermore, the two cohorts of ccRCC patients were randomly divided in a 1:1 ratio into a training set (n=126) and a validation set (n=127). The primary outcomes were overall survival (OS) and progression-free survival (PFS). OS is the duration of follow-up from surgery to the date of death or last clinic visit, and PFS is the duration of follow-up from surgery to the data of disease progression identified by MRI, CT or ECT, or last clinic visit. All experiments were approved by the institutional ethical review board of each hospital, and written informed consent was obtained from all ccRCC patients.
Real-time PCR
The Real-time PCR assays were carried out as described in our previous study.Citation25 Briefly, total RNA from different cell lines and human tissues was extracted using TRIzol reagent (Gibco, 15596018). The cDNA was synthesized using the PrimeScript One Step RT reagent Kit (Takara, RR064A) following the manufacturer’s instructions. Quantitative RT-PCR was performed using a StepOnePlus Real-Time PCR System (Applied Biosystems) and SYBR Green Real-Time PCR Master Mix (Toyobo, QPK201). All results were normalized to the expression of glyceraldehyde 3-phosphate dehydrogenase (GAPDH). The fold change relative to the mean value was determined by the 2−ΔΔCt method. The primer sequences were as follows: RASSF10 (forward primer, 5ʹ-TCGTCCTGTTCGTCCACTTCGT-3ʹ, and reverse primer, 5ʹ-CAGATGCACCAGCGTCTCCATG-3ʹ) and GAPDH (forward primer, 5ʹ-TGGCACCGTCAAGGCTGAGAA-3ʹ, and reverse primer, 5ʹ-TGGTGAAGACGCCAGTGGACTC-3ʹ).
Western blot analysis
Western blot was performed as previously reported.Citation25 Briefly, whole cell extracts or ccRCC tumor specimens were prepared in RIPA lysis buffer and centrifuged at 12,000 g for 15 minutes. Protein concentrations were measured using the Pierce BCA Protein Assay Kit (Thermo Scientific). Immunoblotting was performed using specific primary antibodies, and immunocomplexes were incubated with the corresponding fluorescein-conjugated secondary antibody and then detected using the Amersham Imager 600 (General Electric Company). The primary antibodies used were rabbit anti-RASSF10 antibody (PA5-48377, Thermo Fisher) and rabbit anti-GAPDH antibody (2118S, Cell Signaling Technology). The secondary antibodies were anti-rabbit IgG HRP-linked antibodies (7074S, Cell Signaling Technology).
Immunohistochemistry (IHC)
The IHC assay was performed as previously reported.Citation25 Briefly, all ccRCC tissues were fixed in 4% methanol and embedded in paraffin, and then cut into 5-µm-thick sections. Deparaffinization and rehydration was according to routine methods, and antigen recovery was performed in heated citrate buffer (pH 6.0) or EDTA buffer (PH 8.0) for 30 min. The tissue microarray slides were then incubated with the UltraSensitive SP (Mouse/Rabbit) IHC Kit (KIT-9710, Maixin Biotechnologies), which contains endogenous peroxidase blockers, normal animal nonimmune serum, a biotin-labeled second antibody, and streptomyces antibiotic protein-eroxidase. Specifically, endogenous peroxidases were blocked in each slide by incubating the slides with endogenous peroxidase blockers for 30 minutes, and nonspecific binding sites were blocked with normal animal nonimmune serum for 20 minutes. The following primary antibodies were used in the incubation at 4°C overnight: rabbit anti-RASSF10 antibody (1:200, PA5-48377, Thermo Fisher) or rabbit anti-RASSF10 antibody (1:200, ab113105, Abcam), rabbit IgG antibody (1:200, Cell Signaling Technology), mouse anti-CD68 (1:200, ab53444, Abcam), rabbit anti-CD163 antibody (1:100, ab189915, Abcam), mouse anti-FOXP3 (1:200, ab2004, Abcam,), rabbit anti-alpha smooth muscle actin (α-SMA, 1:200, ab5694, Abcam), and rabbit anti-CD8 (1:200, ab4055, Abcam). Then, the slides were incubated with a biotin-labeled secondary antibody and streptomyces antibiotic protein-eroxidase for 30 minutes separately. Diaminobenzidine (DAB) (DAB-2031, Maixin Biotechnologies) staining was applied. Then, the sections were counterstained with hematoxylin, and quantified by two independent investigators in a double-blinded manner. RASSF10 staining was scored by the H-score, which was generated by the fraction of each component observed in the tissue sections (as calculated as the intensity score [range 0–3] multiplied by the percentage of positive cells [range 0–300]), as described in our previous study.Citation6 Briefly, the whole slide was first observed under a low-power microscope (×40 or ×100 magnification). Then, three randomly representative fields of view were selected under a high-power microscope (×200 magnification) and scored according to the previous grading method. Subsequently, the mean value was calculated. For the immune cells, the whole slide was also first observed at ×40 or ×100 magnification magnification. Then, three randomly representative areas of the tumor were evaluated at ×200 magnification to score the density of stained stromal immune cells. Finally, the mean value was calculated. The total cell count was defined as the number of nucleated stained cells per field and is presented as the density (cells/mm2).Citation26
Cell culture
The ccRCC cell lines and renal cell lines used in the present study were obtained from the Cell Bank of the Type Culture Collection of the Chinese Academy of Sciences in 2018. HK-2 cells were maintained in high-glucose Dulbecco’s Modified Eagle’s Medium (DMEM) (Gibco, 11995–065). ACHN cells were cultured in Minimum Essential Medium (Gibco, 11095–080), and 786-O, 769-P and OS-RC-2 cells were maintained in RPMI-1640 medium (Gibco, 22400–089). The culture media of all cell lines were supplemented with fetal bovine serum (FBS, 10%, Gibco) and 1% penicillin/streptomycin (Gibco). ccRCC cell lines were cultured at 37°C in 5% Co2. Sunitinib- and pazopanib-resistant 786-O cell lines were maintained in RPMI-1640 medium supplemented with 10% (v/v) FBS and 10 µM sunitinib or 8 µM pazopanib. All cell lines in the present study were authenticated by short tandem repeat (STR) profiling and examined for mycoplasma contamination using a Mycoplasma Detection Kit (Selleck Chemicals), and the most recent tests were conducted in June 2019. All cell lines used in the study were cultured within 40 passages.
Cell proliferation assays
Cell proliferation assays were performed as previously reported.Citation27 Briefly, the proliferation of pazopanib-resistant and naïve 786-O cells under the indicated conditions was evaluated using a Cell Counting Kit-8 (CCK-8) assay (Dojindo). A total of 1000 viable cells were seeded in triplicate in 96-well plates. At the indicated time points, each well was mixed with 10 μl CCK-8 and maintained for another 1 hour. Then, the OD values were measured using a microplate reader (BioTek-ELx800) at an absorbance of 450 nm. The proliferation rates are presented as a proportion of the control value, which was obtained from the treatment-free groups.
Statistical analysis
Numerical data are expressed as the means ± standard deviation (SD). Statistical differences between variables were analyzed by a two-tailed Wilcoxon test. Survival curves were plotted using the Kaplan-Meier method and compared via log-rank analysis. Variables with p values < .1 in the univariate analysis were included in the multivariate Cox proportional hazards analysis. Differences were considered significant at p < .05. Time-dependent receiver operating characteristic (ROC) analysis was used to determine the cutoff value of the H-score of RASSF10 and CD68 with the “survival ROC” package, R software 3.4.4. The time-dependent AUC was computed with the “time ROC” package. The prognostic accuracy of the RASSF10-CD68 classifier and other prognostic indicators was assessed by Harrell’s concordance index (c-index). All experiments were performed independently at least three times. All the analyses were performed using GraphPad Prism 5 software (GraphPad Software, Inc.), SPSS 17.0 (IBM Corporation) software, and R software (version 3.5.3).
Results
RASSF10 expression is downregulated in human ccRCC specimens and negatively associated with malignant features and targeted drug resistance of ccRCC
To determine the expression level of RASSF10 in human ccRCC specimens, available databases from TCGA were first analyzed. As shown in , the mRNA expression of RASSF10 was lower in most ccRCC specimens than in nontumor renal tissues (both p < .001). To validate these findings, real-time PCR was performed in 55 paired ccRCC specimens and their matched adjacent renal tissues, and the results demonstrated that most ccRCC tissues exhibited lower mRNA expression of RASSF10 (45/55; p < .001) (). Western blotting was also used to determine the protein expression of RASSF10 in 20 paired ccRCC tissues and matched normal tissues, and consistent with the above results, RASSF10 protein expression was also decreased in most ccRCC samples (17/20; p < .01) (); Supplementary Figure S1a). Moreover, an IHC assay was conducted in ccRCC patients (n = 375) from three independent clinical centers, and as expected, most ccRCC specimens showed lower RASSF10 expression than the paired adjacent tissues (329/375; p < .001) ()), which was determined by the H-score (see Materials and Methods). The IgG antibody was also performed in ccRCC samples as the negative control for RASSF10 staining (Supplementary Figure S1b). In addition, the real-time PCR results indicated that the mRNA expression level of RASSF10 was lower in various types of ccRCC cell lines than in normal renal cell lines (HK-2) (). Therefore, RASSF10 expression is commonly downregulated in human ccRCC.
Figure 1. RASSF10 expression is downregulated in human ccRCC specimens and negatively associated with the malignant features and targeted drug resistance of ccRCC. (a), The mRNA expression of RASSF10 in ccRCC specimens (n = 479) and normal renal tissues (n = 72) was analyzed using the TCGA database. The z-score of RASSF10 was determined to compare the expression differences (***p < .001; Wilcoxon test). (b), The mRNA expression of RASSF10 was detected in ccRCC specimens and the matched paracancerous tissues (n = 62) from the TCGA database. The z-score of RASSF10 was calculated to compare the expression differences. (c), The mRNA expression of RASSF10 was analyzed by real-time PCR in paired ccRCC samples and adjacent renal tissues (n = 55; 45/55) (***p < .001; Wilcoxon test). (d), The protein expression of RASSF10 in the matched ccRCC specimens and paracancerous tissues was determined by Western blot assays (n = 20; 17/20) (**p < .01; Wilcoxon test). (e), The IHC assay was performed in ccRCC to detect RASSF10 expression (n = 375; the different scale bars have been shown on the images). Representative images of hematoxylin and eosin (H&E) and IHC staining are presented. The H-score was analyzed to compare the expression of RASSF10 in the matched ccRCC specimens with that in normal renal tissues, which is shown in the statistical chart (***p < .001; Wilcoxon test). (f), The mRNA expression of RASSF10 was determined by real-time PCR in normal renal cell lines (HK-2) and ccRCC cell lines (OS-RC-2, 769-P, 786-O, and ACHN). (g–h), Representative H&E and IHC staining and statistical charts for RASSF10 in different comparative groups ((g), TNM stage; h, WHO/ISUP grading) are presented (the different scale bars have been shown on the images). (i–j), Real-time PCR assays were performed to detect RASSF10 expression in sunitinib- and pazopanib-treated and -resistant ccRCC cell lines (786-O–SR and 786-O–PR) compared with that in naïve 786-O cells. All p values are defined as *p < .05, **p < .01 and ***p < .001, and the values are presented as the means ± SD
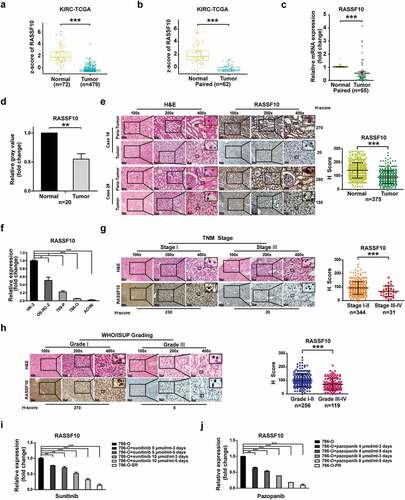
We next examined whether the expression of RASSF10 was associated with the aggressive features of ccRCC. First, an IHC assay was carried out in ccRCC patients (n = 375), and lower RASSF10 expression was observed in samples from ccRCC specimens with a higher TNM stage, WHO/ISUP grading, and SSIGN score (, Supplementary Figure S1c). Given that sunitinib and pazopanib are both first-line targeted drugs in treating advanced or metastatic ccRCC patients in the clinic,Citation2 we also detected RASSF10 expression in sunitinib- and pazopanib-treated and -resistant ccRCC cell lines (786-O–SRCitation8 and 786-O–PR, Supplementary Figure S1d). As shown in the real-time PCR assay, RASSF10 expression was lower not only in sunitinib- and pazopanib-treated 786-O cells but also in 786-O-SR and 786-O-PR cells than in their respective naïve 786-O cells (). These results demonstrate that decreased RASSF10 expression is observed in most ccRCC specimens and predicts malignant features and targeted drug resistance of ccRCC.
Low RASSF10 expression indicates a higher TNM stage, SSIGN score, WHO/ISUP grading, and worse survival of ccRCC patients
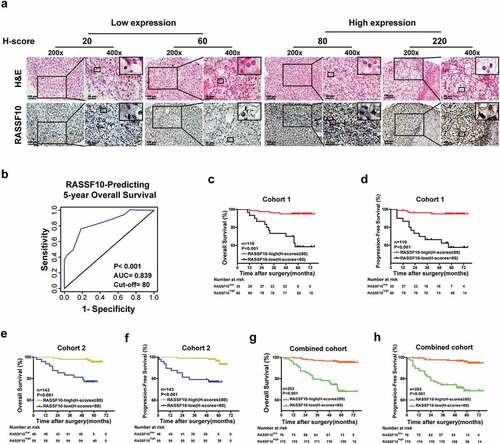
To further examine whether RASSF10 serves as a putative biomarker of ccRCC patients’ prognosis, two independent cohorts of ccRCC patients (cohort 1, n = 110; cohort 2, n = 143) were employed, and their clinicopathological characteristics are listed in Supplementary Table S1. Then, IHC assays were carried out to examine the expression of RASSF10 in ccRCC specimens and to determine the optimal cutoff values for dividing patients in cohort 1 into low and high RASSF10 expression groups (). By performing a time-dependent ROC analysis using the 5-year OS as the end point, the best cutoff value was 80, with an AUC of 0.839 (). As shown in , the RASSF10low group in cohort 1 exhibited a higher WHO/ISUP grading (p < .001), TNM stage (p = .01), and SSIGN score (p = .012) compared with the RASSF10high subgroup. Furthermore, the Kaplan-Meier survival analysis demonstrated that the RASSF10low subgroup presented worse OS (p < .001) and PFS (p < .001) than the RASSF10high subgroup (). Moreover, another cohort (cohort 2) or the combined cohort was analyzed using the cutoff value derived from cohort 1, and, similarly, the RASSF10low subgroup presented a higher WHO/ISUP grading, TNM stage, SSIGN score, and worse OS and PFS than their counterparts (Supplementary Table S2-3; ). In addition, another RASSF10 antibody demonstrated similar findings as above (Supplementary Table S4-6; Supplementary Figure S2a-h).
Table 1. The correlation between RASSF10 expression and clinicopathologic characteristics of patients with clear cell renal cell carcinoma in cohort 1 (n = 110)
Figure 2. Low RASSF10 expression indicates a higher TNM stage, SSIGN score, WHO/ISUP grading, and worse survival of ccRCC patients. (a), Representative images of H&E and IHC staining of RASSF10 in ccRCC specimens from cohort 1 are shown (the different scale bars have been shown on the images). (b), A time-dependent ROC analysis was used to investigate the optimal H-score cutoff value of RASSF10 in cohort 1 (n = 110). (c–h), Kaplan-Meier analyses of ccRCC patients’ OS and PFS were performed in cohort 1 (n = 110; c, d), cohort 2 (n = 143; (e,f)) and the combined cohort (n = 253; (g,h)) (p value: log-rank test). All p values are defined as *p < .05, **p < .01 and ***p < .001
To further validate the above results, the two cohorts of ccRCC patients were merged and randomly divided into a training cohort (n = 126) and a validation cohort (n = 127) in a 1:1 ratio (Supplementary Table S1). As shown in Supplementary Table S7 and Supplementary Figure S2i-j, low expression levels of RASSF10 predicted a higher WHO/ISUP grading (p = .003), TNM stage (p = .011), SSIGN score (p = .01), and worse OS (p < .001) and PFS (p < .001) of ccRCC patients in the training cohort than their counterparts, which was also confirmed in the validation cohort (Supplementary Table S8; Supplementary Figure S2k-l). Therefore, RASSF10 expression is a helpful indicator for predicting ccRCC patients’ prognosis.
Intratumoral RASSF10 expression is negatively correlated with TAM infiltration and indicative of ccRCC patients’ prognosis
Tumor progression is attributed not only to intratumoral signaling pathways but also to the interaction between tumor cells and tumor-infiltrating immune cells (TIICs).Citation28 This finding prompted us to examine whether intratumoral RASSF10 expression is associated with TIIC markers in ccRCC specimens. IHC was performed to detect the markers of several common TIICs, including CD68 or CD163 (TAMs), α-SMA (cancer-associated fibroblasts, CAFs), CD8 (cytotoxic T lymphocytes, CTLs), and FOXP3 (regulatory T cells, Tregs),Citation26 in ccRCC specimens (); Supplementary Figure S3a-h). The correlation analysis showed that there was no correlation between RASSF10 expression and TIICs, except for the inverse correlation between RASSF10 and CD68 or CD163 (TAMs) in ccRCC samples (; Supplementary Figure S3a-h).
Figure 3. Intratumoral RASSF10 expression is negatively correlated with TAM infiltration and indicative of ccRCC patients’ prognosis. (a), Representative images of H&E and IHC staining of RASSF10 and CD68 in ccRCC tissues from cohort 1 are presented (the different scale bars have been shown on the images). (b), Results of the correlation analysis between the H-scores of RASSF10 and CD68 in the ccRCC samples are shown (n = 253). (c), A time-dependent ROC analysis was employed to detect the optimal H-score cutoff value of CD68 in cohort 1 (n = 110). (d–i), Kaplan-Meier analyses of OS and PFS in ccRCC patients were performed in cohort 1 (n = 110; (d,e)), cohort 2 (n = 143; (f,g)), and the combined cohort (n = 253; (h,i)) (p value: log-rank test). All p values are defined as *p < .05, **p < .01 and ***p < .001
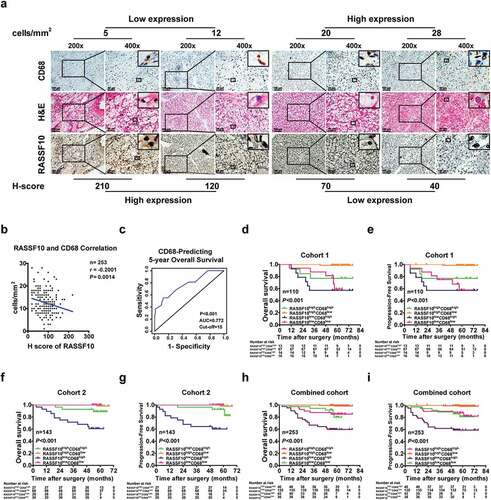
Given that recent studies have shown that combined biomarkers exhibit superiority in evaluating ccRCC patients’ outcomes, we next determined whether integrating RASSF10 expression and TAMs could be helpful for assessing disease progression and prognosis in ccRCC patients (Supplementary Figure S3i). First, the optimal cutoff value of RASSF10 and CD68 for dividing ccRCC patients in cohort 1 was determined by a time-dependent ROC analysis () and ). Then, cohort 1 of ccRCC patients was divided into four groups: RASSF10highCD68low, RASSF10lowCD68low, RASSF10highCD68high, and RASSF10lowCD68high (). As shown in and , patients with low RASSF10 expression and high CD68 expression exhibited not only a higher WHO/ISUP grading (p < .001), TNM stage (p = .013), and SSIGN score (p = .024) but also worse OS (p < .001) and PFS (p < .001). Furthermore, these findings were confirmed in ccRCC patients from cohort 2 and the combined cohort (; Supplementary Table S9-10). In addition, repeated the analysis with another RASSF10 antibody showed similar results as above (Supplementary Figure S3j-o; Supplementary Table S11-13). Furthermore, integrating RASSF10 expression and CD163 also predicted disease progression and prognosis in ccRCC patients (Supplementary Figure S3p-v; Supplementary Table S14-16). Moreover, similar results were also observed in the randomized training and validation cohorts (Supplementary Figure S3w-z; Supplementary Table S17-18). These findings indicate that the combination of RASSF10 expression and TAM infiltration predicts disease progression and prognosis in ccRCC patients.
Table 2. The correlation between expressions of RASSF10, CD68 and clinicopathologic characteristics of patients with clear cell renal cell carcinoma in cohort 1 (n = 110)
RASSF10 and TAMs are independent risk factors for predicting OS and PFS in ccRCC patients
To further determine the prognostic value of RASSF10 and TAMs in assessing the survival of ccRCC patients, univariate and multivariate Cox regression analyses were performed to determine whether RASSF10 and TAMs were independent risk factors for evaluating OS and PFS in ccRCC patients. Even after multivariable adjustment (including age, gender, WHO/ISUP grading, TNM stage, SSIGN score, RASSF10, and CD68 or CD163), RASSF10, CD68 or CD163, TNM stage, and SSIGN score were identified as independent risk factors for the prognosis of ccRCC patients in both cohort 1, cohort 2, and the combined cohort (; Supplementary Tables S19-23). Additionally, the univariate and multivariate Cox regression analyses performed in the randomized training and validation cohorts confirmed these findings (Supplementary Tables S24-25). The findings were also observed using another RASSF10 antibody; thus, validating the above results (Supplementary Tables S26-28). These results demonstrate that RASSF10 and TAMs are independent risk factors for ccRCC patients’ prognosis.
Table 3. Univariate and multivariate cox regression analysis of RASSF10, CD68 and clinicopathologic characteristics with overall survival and progression-free survival in cohort 1 (n = 110)
RASSF10 and the TAM-based classifier serve as a more accurate evaluation method for the prognosis of ccRCC patients
Our study as well as previous studies have demonstrated that integrated biomarkers or combined intratumoral biomarkers and the existing clinical indicators exhibit better accuracy in predicting the prognosis of ccRCC patients.Citation8,Citation29 Thus, we next examined whether combining the RASSF10-TAM-based classifier and the clinical indicators (TNM stage and SSIGN score) yielded better accuracy in predicting ccRCC patients’ prognosis compared with that of any one of the indicators alone. A time-dependent c-index analysis was also performed in cohort 1. As expected, the RASSF10-CD68 (or CD163)-based classifier showed better accuracy in predicting the postoperative OS and PFS of ccRCC patients, in contrast to that of RASSF10, CD68 or CD163, or any one of the clinical indicators alone (; Supplementary Tables S29). Furthermore, the combination of the RASSF10-CD68 (or CD163)-based classifier and the clinical indicators TNM stage or SSIGN score presented the best prediction accuracy of ccRCC patients’ prognosis (; Supplementary Tables S29), which was further validated in cohort 2 and the combined cohort (Supplementary Tables S29-30), and confirmed by using another RASSF10 antibody (Supplementary Tables S31). Moreover, these results were further validated in the randomized training cohort and validation cohort (Supplementary Tables S30). In summary, more accurate prognostic accuracy for ccRCC patients’ prognosis can be achieved by combining the RASSF10-CD68-based classifier with the current clinical indicators.
Table 4. C-index analysis of the prognostic accuracy of RASSF10, CD68 and other variables for overall survival and progression-free survival in cohort 1
Discussion
Although many studies have demonstrated prognostic biomarkers for ccRCC patients, most of them are single biomarkers that may not accurately predict the progression and prognosis of ccRCC patients. In addition, intratumoral biomarkers seem to be inadequate to comprehensively reflect tumor heterogeneity, while the tumor microenvironment should simultaneously be given more attention.Citation28 Accordingly, the present study not only assessed the expression and prognostic value of the novel biomarker RASSF10 in ccRCC but also examined its correlation with common immune cells (e.g., TAMs, CAFs, Treg, and CTLs) in the microenvironment and compared the prognostic value and accuracy of RASSF10 with TAMs and the existing clinical indicators in ccRCC patients. We conclude that RASSF10 expression is negatively associated with disease progression, OS, PFS, and the infiltration of TAMs. RASSF10, TAMs, TNM stage, and SSIGN score are independent prognostic factors for ccRCC patients. Moreover, the combination of RASSF10 and TAMs resulted in a higher index than that of each alone in the postoperative prognosis of ccRCC patients, and the integration of RASSF10 and TAMs with the TNM stage or SSIGN score resulted in better accuracy in predicting the prognosis of ccRCC patients.
RASSF10 has been shown to serve as a tumor suppressor in many types of cancers, including glioma, colorectal cancer, and childhood leukemias.Citation30-Citation32 In addition, RASSF10 is a useful prognostic indicator for evaluating the prognosis of tumor patients.Citation31 The methylation and downregulation of RASSF10 could be associated with an advanced tumor stage and an advanced age of patients with prostate cancer.Citation33 However, whether RASSF10 is also downregulated in ccRCC and could be a prognostic indicator for ccRCC patient prognosis remains unknown. Thus, we first analyzed the mRNA expression level of RASSF10 in ccRCC specimens (n = 551) through the online TCGA datasets, which demonstrated that most ccRCC tissues exhibited lower RASSF10 expression than the adjacent renal tissues. The same results were also observed in ccRCC samples (n = 375) from our institutions. Additionally, low RASSF10 expression predicted a higher TNM stage, SSIGN score, and WHO/ISUP grading and worse survival of ccRCC patients. Therefore, a negative correlation between RASSF10 expression and the prognosis of ccRCC patients was observed in our study, which is similar to the RASSF10 correlations in many other tumor types.
Most previous studies have focused only on intratumoral signaling pathways and searched for many tumor biomarkers for ccRCC. In fact, carcinogenesis, tumor progression and metastasis also largely depend on the tumor microenvironment, which includes inflammatory cells, immune cells, and their secreted factors.Citation34 Additionally, biomarkers from the microenvironment could better predict tumor heterogeneity and the disease diversity of patients.Citation35 A recent study demonstrated that tumor-infiltrating immune cells, including CD8+ T cells, Tregs and macrophages, were important determinants of ccRCC patients’ prognosis and could be used as potential targets for immunotherapy.Citation36 Among the tumor-infiltrating immune cells in the tumor microenvironment, tumor-associated macrophages promote ccRCC progression and metastasis.Citation37 In addition, TAMs have served as a helpful indicator for the prediction of the outcome of ccRCC patients.Citation38 However, whether the combination of intratumoral biomarkers and the indicators from the microenvironment, including TAMs, is more accurate in evaluating patient prognosis should be examined in ccRCC patients.
Thus, we next examined whether RASSF10 expression was associated with tumor-infiltrating immune cells. The correlation analysis revealed that RASSF10 expression was negatively associated with CD68+ TAMs in human ccRCC specimens from a total of 253 patients in two independent clinical centers, while there was no significant correlation between RASSF10 and other immune cells (e.g., CTLs, Tregs, or CAFs) in ccRCC. Furthermore, after multivariable adjustment for the clinical variables that were examined in the multivariate analysis, RASSF10 and TAMs were identified as independent risk factors for predicting the prognosis of ccRCC patients.
A potential association between RASSF10 and TAMs in a reverse manner was suggested by the data but not the physical basis was not addressed in this study. We speculate that one of the possibilities is that TAMs themselves, but not T cells, also express RASSF10, which, when overexpressed, has been shown to inhibit cell migration and invasion.Citation15,Citation39 In other words, the TAMs observed in ccRCC tissues may have been “pre-selected” for low RASSF10 expression with increased migratory ability and invasiveness to percolate the tumor stroma. Alternatively, the downregulation of RASSF10 in ccRCC may cell-intrinsically result in selective upregulation of TAM-attracting chemokines but not of the T cell-attracting counterparts. Based on the relative looseness of the RASSF10-TAM association we observed ()), it is more likely that TAMs are not exclusively regulated by the RASSF10 status.
Moreover, in contrast to any single variable (e.g., RASSF10, TAMs, TNM stage, and SSIGN classifier), the integrated system model (RASSF10-TAMs-TNM stage or SSIGN) exhibited a better prognostic value for predicting the prognosis of ccRCC patients. To avoid a potential selection bias in the recruitment and group division of ccRCC patients, our findings were examined not only in cohort 1 and cohort 2 but also in the randomized training and validation sets. Although our study indicates the value of combining RASSF10-TAMs-TNM stage or SSIGN score to better predict the prognosis of ccRCC patients, further clinical validation with more, larger cohorts should be performed to confirm the postoperative value of the classifier model. In addition, whether RASSF10 serves as a tumor suppressor in ccRCC through regulating the interaction of ccRCC and TAMs should be explored in depth in future work.
Abbreviation
| AUC | = | area under the curve |
| C-index | = | concordance index |
| CAFs | = | cancer-associated fibroblasts |
| ccRCC | = | Clear cell renal cell carcinoma |
| CSC | = | cancer stem-like cell |
| CTLs | = | cytotoxic T cells |
| H&E | = | hematoxylin and eosin |
| IHC | = | immunohistochemistry |
| NK cells | = | natural killer cells |
| OS | = | overall survival; PFS: progression-free survival. |
| RASSF10 | = | ras association domain-containing protein 10 |
| ROC | = | receiver operating characteristics |
| SSIGN | = | Stage Size Grade and Necrosis |
| TAMs | = | tumor-associated macrophages |
| TCGA | = | The Cancer Genome Atlas |
| TME | = | tumor microenvironment |
| TNM | = | tumor node metastasis |
| Tregs | = | regulatory T cells |
| WHO/ISUP grading | = | World Health Organization/International Society of Urological Pathology grading |
Authors’ contributions
C.W., J.L., L.Z., and X.C. designed the study; C.W. wrote the manuscript; C.W., T.H., Y.W., S.G., and Q.W. analyzed the data, performed the experiments, and statistical analysis; J.L., and Q.W. provided the ccRCC patient samples; J.L., L.Z., and X.C. supervised the study and reviewed the manuscript.
Disclosure of potential conflicts of interest
No potential conflicts of interest were disclosed.
Supplemental Material
Download ()Acknowledgments
We thank Dr. Aiping Zhang (Department of Urinary Surgery, Gongli Hospital, Second Military Medical University, Shanghai, China) for her assistance in providing the clinical samples of ccRCC patients.
Supplemental material
Supplemental data for this article can be accessed on the publisher’s website.
Additional information
Funding
References
- Hsieh JJ, Purdue MP, Signoretti S, Swanton C, Albiges L, Schmidinger M, Heng DY, Larkin J, Ficarra V. Renal cell carcinoma. Nat Rev Dis Primers. 2017;3:17009. doi:10.1038/nrdp.2017.9.
- Rini BI, Campbell SC, Escudier B. Renal cell carcinoma. Lancet. 2009;373(9669):1119–11. doi:10.1016/S0140-6736(09)60229-4.
- Li JK, Chen C, Liu JY, Shi JZ, Liu SP, Liu B, Wu DS, Fang ZY, Bao Y, Jiang MM, et al. Long noncoding RNA MRCCAT1 promotes metastasis of clear cell renal cell carcinoma via inhibiting NPR3 and activating p38-MAPK signaling. Mol Cancer. 2017;16(1):111. doi:10.1186/s12943-017-0681-0.
- Parker WP, Cheville JC, Frank I, Zaid HB, Lohse CM, Boorjian SA, Leibovich BC, Thompson RH. Application of the stage, size, grade, and necrosis (SSIGN) score for clear cell renal cellcarcinoma in contemporary patients. Eur Urol. 2017;71(4):665–673. doi:10.1016/j.eururo.2016.05.034.
- Barata PC, Rini BI. Treatment of renal cell carcinoma: current status and future directions. CA Cancer J Clin. 2017;67(6):507–524. doi:10.3322/caac.21411.
- Wang M, Li X, Zhang J, Yang Q, Chen W, Jin W, Huang YR, Yang R, Gao WQ. AHNAK2 is a novel prognostic marker and oncogenic protein for clear cell renal cell carcinoma. Theranostics. 2017;7(5):1100–1113. doi:10.7150/thno.18198.
- Hakimi AA, Chen YB, Wren J, Gonen M, Abdel-Wahab O, Heguy A, Liu H, Takeda S, Tickoo SK, Reuter VE, et al. Clinical and pathologic impact of select chromatin-modulating tumor suppressors in clear cell renal cell carcinoma. Eur Urol. 2013;63(5):848–854. doi:10.1016/j.eururo.2012.09.005.
- Wang C, Li Y, Chu CM, Zhang XM, Ma J, Huang H, Wang YN, Hong TY, Zhang J, Pan XW, et al. Gankyrin is a novel biomarker for disease progression and prognosis of patients with renal cell carcinoma. EbioMedicine. 2019;39:255–264. doi:10.1016/j.ebiom.2018.12.011.
- Giraldo NA, Becht E, Vano Y, Petitprez F, Lacroix L, Validire P, Sanchez-Salas R, Ingels A, Oudard S, Moatti A, et al. Tumor-infiltrating and peripheral blood T-cell immunophenotypes predict early relapse in localized clear cell renal cell carcinoma. Clin Cancer Res. 2017;23(15):4416–4428. doi:10.1158/1078-0432.CCR-16-2848.
- Bakhtyar N, Wong N, Kapoor A, Cutz JC, Hill B, Ghert M, Tang D. Clear cell renal cell carcinoma induces fibroblast-mediated production of stromal periostin. Eur J Cancer. 2013;49(16):3537–3546. doi:10.1016/j.ejca.2013.06.032.
- Chittezhath M, Dhillon MK, Lim JY, Laoui D, Shalova IN, Teo YL, Chen J, Kamaraj R, Raman L, Lum J, et al. Molecular profiling reveals a tumor-promoting phenotype of monocytes and macrophages in human cancer progression. Immunity. 2014;41(5):815–829. doi:10.1016/j.immuni.2014.09.014.
- Fu Q, Xu L, Wang Y, Jiang Q, Liu Z, Zhang J, Zhou Q, Zeng H, Tong S, Wang T, et al. Tumor-associated macrophage-derived interleukin-23 interlinks kidney cancer glutamine addiction with immune evasion. Eur Urol. 2019;75(5):752–763. doi:10.1016/j.eururo.2018.09.030.
- Komohara Y, Hasita H, Ohnishi K, Fujiwara Y, Suzu S, Eto M, Takeya M. Macrophage infiltration and its prognostic relevance in clear cell renal cell carcinoma. Cancer Sci. 2011;102(7):1424–1431. doi:10.1111/j.1349-7006.2011.01945.x.
- Han X, Dong Q, Wu J, Luo Y, Rong X, Han Q, Zheng X, Wang E. RASSF10 suppresses lung cancer proliferation and invasion by decreasing the level of phosphorylated LRP6. Mol Carcinog. 2019;58(7):1168–1180. doi:10.1002/mc.23000.
- Liu W, Wang J, Wang L, Qian C, Qian Y, Xuan H, Zhuo W, Li X, Yu J, Si J. Ras-association domain family 10 acts as a novel tumor suppressor through modulating MMP2 in hepatocarcinoma. Oncogenesis. 2016;5(6):e237. doi:10.1038/oncsis.2016.24.
- Richter AM, Walesch SK, Dammann RH. Aberrant promoter methylation of the tumour suppressor RASSF10 and its growth inhibitory function in breast cancer. Cancers (Basel). 2016;8:3. doi:10.3390/cancers8030026.
- Lu D, Ma J, Zhan Q, Li Y, Qin J, Guo M. Epigenetic silencing of RASSF10 promotes tumor growth in esophageal squamous cell carcinoma. Discov Med. 2014;17:169–178.
- Jin Y, Cao B, Zhang M, Zhan Q, Herman JG, Yu M, Guo M. RASSF10 suppresses hepatocellular carcinoma growth by activating P53 signaling and methylation of RASSF10 is a docetaxel resistant marker. Genes Cancer. 2015;6(5–6):231–240. doi:10.18632/genesandcancer.67.
- Li X, Liang Q, Liu W, Zhang N, Xu L, Zhang X, Zhang J, Sung JJ, Yu J. Ras association domain family member 10 suppresses gastric cancer growth by cooperating with GSTP1 to regulate JNK/c-Jun/AP-1 pathway. Oncogene. 2016;35(19):2453–2464. doi:10.1038/onc.2015.300.
- Dong T, Zhang M, Dong Y, Herman JG, van Engeland M, Zhong G, Guo M. Methylation of RASSF10 promotes cell proliferation and serves as a docetaxel resistant marker in human breast cancer. Discov Med. 2015;20:261–271.
- Deng J, Liang H, Ying G, Li H, Xie X, Yu J, Fan D, Hao X. Methylation of ras association domain protein 10 (RASSF10) promoter negative association with the survival of gastric cancer. Am J Cancer Res. 2014;4:916–923.
- Younesian S, Shahkarami S, Ghaffari P, Alizadeh S, Mehrasa R, Ghavamzadeh A, Ghaffari SH. DNA hypermethylation of tumor suppressor genes RASSF6 and RASSF10 as independent prognostic factors in adult acute lymphoblastic leukemia. Leuk Res. 2017;61:33–38. doi:10.1016/j.leukres.2017.08.016.
- McShane LM, Altman DG, Sauerbrei W, Taube SE, Gion M, Clark GM. Reporting recommendations for tumor MARKer prognostic studies (REMARK). Nat Clin Pract Urol. 2005;2:416–422.
- Moch H, Cubilla AL, Humphrey PA, Reuter VE, Ulbright TM. The 2016 WHO classification of tumours of the urinary system and male genital organs-part A: renal, penile, and testicular tumours. Eur Urol. 2016;70(1):93–105. doi:10.1016/j.eururo.2016.02.029.
- Zhao Y, Lu QJ, Li CG, Wang XY, Jiang L, Huang L, Wang C, Chen HZ. PRMT1 regulates the tumour-initiating properties of esophageal squamous cell carcinoma through histone H4 arginine methylation coupled with transcriptional activation. Cell Death Dis. 2019;10(5):359. doi:10.1038/s41419-019-1595-0.
- Fu H, Zhu Y, Wang Y, Liu Z, Zhang J, Xie H, Fu Q, Dai B, Ye D, Identification XJ. Validation of stromal immunotype predict survival and benefit from adjuvant chemotherapy in patients with muscle-invasive bladder cancer. Clin Cancer Res. 2018;24(13):3069–3078. doi:10.1158/1078-0432.CCR-17-2687.
- Wang C, Yan FH, Zhang JJ, Huang H, Cui QS, Dong W, Zhang WW, Zhao Y, Chen HZ, Zhao TJ. OV6+ cancer stem cells drive esophageal squamous cell carcinoma progression through ATG7-dependent β-catenin stabilization. Cancer Lett. 2017;391:100–113. doi:10.1016/j.canlet.2017.01.026.
- Graham J, Dudani S, Heng DYC. Prognostication in kidney cancer: recent advances and future directions. J Clin Oncol. 2018:JCO2018790147. doi:10.1200/JCO.2018.79.0147.
- Xiong Y, Liu L, Xia Y, Qi Y, Chen Y, Chen L, Zhang P, Kong Y, Qu Y, Wang Z, et al. Tumor infiltrating mast cells determine oncogenic HIF-2α-conferred immune evasion in clear cell renal cell carcinoma. Cancer Immunol Immunother. 2019;68(5):731–741. doi:10.1007/s00262-019-02314-y.
- Hill VK, Underhill-Day N, Krex D, Robel K, Sangan CB, Summersgill HR, Morris M, Gentle D, Chalmers AD, Maher ER, et al. Epigenetic inactivation of the RASSF10 candidate tumor suppressor gene is a frequent and an early event in gliomagenesis. Oncogene. 2011;30(8):978–989. doi:10.1038/onc.2010.471.
- Ma J, Zhang S, Hu Y, Li X, Yuan F, Sun D, Wang L, Zhang F, Chen G, Cui P. Decreased expression of RASSF10 correlates with poor prognosis in patients with colorectal cancer. Medicine (Baltimore). 2017;96(42):e7011. doi:10.1097/MD.0000000000007011.
- Hesson LB, Dunwell TL, Cooper WN, Catchpoole D, Brini AT, Chiaramonte R, Griffiths M, Chalmers AD, Maher ER, Latif F. The novel RASSF6 and RASSF10 candidate tumour suppressor genes are frequently epigenetically inactivated in childhood leukaemias. Mol Cancer. 2009;8:42. doi:10.1186/1476-4598-8-42.
- Dansranjavin T, Wagenlehner F, Gattenloehner S, Steger K, Weidner W, Dammann R, Schagdarsurengin U. Epigenetic down regulation of RASSF10 and its possible clinical implication in prostate carcinoma. Prostate. 2012;72(14):1550–1558. doi:10.1002/pros.22510.
- Andersen R, Westergaard MCW, Kjeldsen JW, Müller A, Pedersen NW, Hadrup SR, Ö M, Seliger B, Kromann-Andersen B, Hasselager T, et al. T-cell responses in the microenvironment of primary renal cell carcinoma-implications for adoptive cell therapy. Cancer Immunol Res. 2018;6(2):222–235. doi:10.1158/2326-6066.CIR-17-0467.
- Kawashima A, Kanazawa T, Goto K, Matsumoto M, Morimoto-Okazawa A, Iwahori K, Ujike T, Nagahara A, Fujita K, Uemura M, et al. Immunological classification of renal cell carcinoma patients based on phenotypic analysis of immune check-point molecules. Cancer Immunol Immunother. 2018;67(1):113–125. doi:10.1007/s00262-017-2060-5.
- Zhang S, Zhang E, Long J, Hu Z, Peng J, Liu L, Tang F, Li L, Ouyang Y, Zeng Z. Immune infiltration in renal cell carcinoma. Cancer Sci. 2019;110(5):1564–1572. doi:10.1111/cas.13996.
- Komohara Y, Morita T, Annan DA, Horlad H, Ohnishi K, Yamada S, Nakayama T, Kitada S, Suzu S, Kinoshita I, et al. The coordinated actions of TIM-3 on cancer and myeloid cells in the regulation of tumorigenicity and clinical prognosis in clear cell renal cell carcinomas. Cancer Immunol Res. 2015;3(9):999–1007. doi:10.1158/2326-6066.CIR-14-0156.
- Dannenmann SR, Thielicke J, Stöckli M, Matter C, von Boehmer L, Cecconi V, Hermanns T, Hefermehl L, Schraml P, Moch H, et al. Tumor-associated macrophages subvert T-cell function and correlate with reduced survival in clear cell renal cell carcinoma. Oncoimmunology. 2013;2(3):e23562. doi:10.4161/onci.23562.
- Xie J, Chen Y, Meng F, Shu T, Liu Y, Zhang L, Zhang ZX. Study on the relationship between the RASSF10 gene and the biological behavior of hepatocellular carcinoma cells. Eur Rev Med Pharmacol Sci. 2017;21:3576–3580.