
ABSTRACT
Recent studies have proposed that tumor-specific tumor-infiltrating CD8+ T lymphocytes (CD8 TIL) can be classified into two main groups: “exhausted” TILs, characterized by high expression of the inhibitory receptors PD-1 and TIM-3 and lack of transcription factor 1 (Tcf1); and “memory-like” TILs, with self-renewal capacity and co-expressing Tcf1 and PD-1. However, a comprehensive definition of the heterogeneity existing within CD8 TILs has yet to be clearly established. To investigate this heterogeneity at the transcriptomic level, we performed paired single-cell RNA and TCR sequencing of CD8 T cells infiltrating B16 murine melanoma tumors, including cells of known tumor specificity. Unsupervised clustering and gene-signature analysis revealed four distinct CD8 TIL states – exhausted, memory-like, naïve and effector memory-like (EM-like) – and predicted novel markers, including Ly6C for the EM-like cells, that were validated by flow cytometry. Tumor-specific PMEL T cells were predominantly found within the exhausted and memory-like states but also within the EM-like state. Further, T cell receptor sequencing revealed a large clonal expansion of exhausted, memory-like and EM-like cells with partial clonal relatedness between them. Finally, meta-analyses of public bulk and single-cell RNA-seq data suggested that anti-PD-1 treatment induces the expansion of EM-like cells. Our reference map of the transcriptomic landscape of murine CD8 TILs will help interpreting future bulk and single-cell transcriptomic studies and may guide the analysis of CD8IL subpopulations in response to therapeutic interventions.
Introduction
Chronic antigen stimulation and inflammation lead to CD8 T cell differentiation and function that differ from those generated during acute infections. Chronically stimulated CD8 T cells acquire an “exhausted” state characterized by a progressive loss of cytolytic activity, reduced cytokine production and proliferative capacity, upregulation of multiple co-inhibitory receptors, such as PD-1, CTLA4, LAG3, TIGIT and TIM3, and a unique epigenetic state.Citation1 Although initially considered hypofunctional effector T cells, several observations suggest that exhausted T cells are heterogeneous and have crucial roles in limiting viral infection or tumor growth while avoiding damage to normal tissues.Citation2 Yet, tumor-specific T cells often lack effector function and fail to control tumor growth and therefore they are also referred to as “dysfunctional”.Citation3,Citation4 Notwithstanding, immune-checkpoint blockade (ICB) therapies using anti-PD-1 can result in a proliferative response of CD8 tumor-infiltrating lymphocytes (TILs) and improve effector functions.Citation5
Understanding how anti-PD-1 therapy affects distinct CD8 TIL subsets is a major challenge in cancer immunotherapy. Recently, a novel intratumoral tumor-specific CD8 T cell subpopulation was discovered among murine TILs that mediates cellular expansion in response to immune-checkpoint blockade.Citation6,Citation7 These cells have been isolated and characterized using different combinations of surface markers and reporter genes (e.g. PD-1+ Tcf7:GFP+ and PD-1+ TIM3− SLAMF6+) and were named “memory-like”Citation7 or “progenitor exhausted.”Citation6 Memory-like CD8 TIL cells have the capacity to expand, self-renew and give rise to terminally differentiated cells (PD-1+ TIM3+ Tcf1−, GZMB+; termed “exhausted”) in the context of chronic antigenic stimulation, similarly to progenitor CD8 T cell subsets previously described in chronic infection.Citation8-Citation12 However, there are still many unknowns regarding how T cells committed to the exhaustion lineage develop from pre-exhausted T cell states and which of these states are present in the tumor. Therefore, a comprehensive definition of the heterogeneity existing within CD8 TILs has yet to be clearly established.
Here we aimed at defining a reference transcriptomic map and determining clonal relatedness of CD8 TILs, including cells of known tumor-specificity, in the pre-clinical melanoma model B16. To this aim, we have sequenced the transcriptome including full-length T cell receptor genes of >3500 single-cell CD8 TILs from seven tumor-bearing mice including wild-type C57BL/6 and PMEL transgenic mice. Furthermore, to study how the CD8 TIL landscape is modulated by immunotherapy, we performed a meta-analysis of published bulk and single-cell RNA-seq (scRNA-seq) data. Our study provides new insights into the heterogeneity of CD8 TILs, including novel markers to define T cell subpopulations, as well as freely accessible bioinformatics tools to guide the analysis of scRNA-seq data sets.
Materials and methods
Mice
For scRNA-seq 6–12 week-old male C57BL/6 mice (CD45.1+) and PMEL (Jackson Laboratory, Cat#005023) were bred and housed under SPF conditions in the conventional animal facility of the University of Lausanne. Experiments were performed in compliance with the University of Lausanne Institutional regulations and were approved by the veterinarian authorities of the Canton de Vaud.
Tumor experiments and isolation of TILs
Right flanks of mice (C57BL/6 or PMEL) were shaved and B16F10 cells (2.5x10⁵) were injected subcutaneously. Tumor volumes were estimated by measuring the tumor size in two dimensions using a caliper. The tumor volume was calculated according to the formula (length x width2)/2. Mice were sacrificed at the indicated time point and the weight of the excised tumor mass was determined.
Tumors were excised post 15 days of tumor engraftment, manually dissociated and digested enzymatically with Tumor Dissociation Kit (Miltenyi Biotec). Digested tumors were mashed through 70 µm filters. Hematopoietic cells were further purified using a discontinuous Percoll gradient (GE Healthcare). Cells at the interface were harvested and washed twice before further use. For cell sorting, tumor-infiltrating T cells were further purified using mouse CD8 T cell enrichment kit (StemCell Technologies) and sorted by flow cytometry using following antibodies – CD8a (Clone 53–6.7; eBiosciences), CD45 (Clone MI/89; eBiosciences) and Zombie Aqua (423102; Biolegend). The purity of sorted cells was greater than 99%. Flow sorted tumor-infiltrating CD8 T cells were thus used for single-cell RNA sequence purpose.
10x genomics single-cell gene expression sample processing and sequencing
After sorting, intratumoral CD8 T cells were loaded into a Chromium Single Cell Instrument (10x Genomics, Pleasanton, CA) together with beads, master mix reagents (containing RT enzyme and poly-dt RT primers) and oil to generate single-cell-containing Gel Beads-in-emulsion (GEMs). Single-cell Gene Expression libraries were then prepared using Chromium Single Cell 5ʹ Library & Gel Bead Kit (PN-1000006) following the manufacturer’s instruction (protocol CG000086 Rev E). With this procedure, the cDNAs from distinct droplets harbor a distinct and unique 10x “cell barcode”. These sequencing libraries were loaded onto Illumina NextSeq High Output Flow Cells and sequenced using read lengths of 26 nt for read1 and 132 nt for read2. The Cell Ranger Single Cell Software Suite 2.1.1 (https://support.10xgenomics.com/single-cell-gene-expression/software/pipelines/latest/using/mkfastq) was used to perform sample demultiplexing, barcode processing, reads downsampling per sample (down to 118,806 mean reads per cell) and single-cell 5ʹ gene counting using default parameters and mouse genome assembly mm10.
Single-cell TCR sequencing and analysis
Intratumoral CD8 T cell cDNAs that were generated as an intermediate step during the aforementioned single-cell gene expression libraries preparation were subsequently used in a distinct workflow. Briefly, the 10x mouse V(D)J Enrichment Kit (PN-1000071) was used to enrich for T cell receptor (TCR) sequences, after which V(D)J-enriched libraries were constructed with the Chromium Single Cell 5ʹ Library Construction Kit (PN-1000020). The Cell Ranger Single Cell Software Suite 2.2.0 (https://support.10xgenomics.com/single-cell-gene-expression/software/pipelines/latest/using/mkfastq) was used to perform sample demultiplexing, barcode processing and clonotype identification, using default parameters.
For each mouse separately, T cells sharing identical alpha and beta TCR chains were assigned to a unique clonotype ID. PMEL-specific cells were identified based on the expression of the transgenic PMEL-specific TCR (CASSFHRDYNSPLYF and CAVNTGNYKYVF for beta and alpha CDR3 sequences, respectively, Overwijk et al.Citation13, GenBank entries EF154513.1 and EF154514.1). Single-cell TCR sequences are available as Supplementary Files at GEO under accession GSE116390).
TCR repertoire similarity was calculated using the Morisita-Horn (MH) index as implemented in the R package ‘divo’ v1.0.0Citation14 with parameters resample = 10,000, CI = 0.95 and size = 1.
For clonal analysis of the Singer dataset, we reconstructed TCR alpha and beta chains using Tracer v0.5.0 (https://github.com/Teichlab/tracer) with the option ‘-q salmon’ for transcript quantification (Supplemental Table 4). Next, we defined clusters of T cell clones (clonotypes) as those sharing identical productive alpha and beta chains, as described above. Mouse 4 corresponded to a PMEL transgenic mouse, expressing the alpha and beta chains TRAV7 N-5_TGAAC(A)CAGGA_TRAJ40 and TRBV14_GTTTCCACAGGGA(CT)ATAAT_TRBJ1-6 (Supplemental Figure 6(a)). Detected TCR recombinants and assigned clonotype clusters are available in Supplemental Table 4. TCR repertoire similarity between WT mice (1,2,3) and TIL states (as predicted by TILPRED) was calculated using the Morisita-Horn (MH) index as implemented in the R package ‘divo’ v1.0.0Citation14 with parameters resample = 10,000, CI = 0.95 and size = 1 (Supplemental Figure 6(d, e)).
Processing, dimensionality reduction and clustering of newly generated scRNA-seq data
A total of 7174 single-cell transcriptomes (with a median of 4908 UMIs and 1424 detected genes per cell) were obtained from 7 samples (4 WT + 3 PMEL mice) after Cell Ranger pre-processing and UMI quantification. Next, UMI counts were normalized by dividing them by the total UMI counts in each cell and multiplying by a factor of 10,000. Then, we took the log of the normalized UMI counts the prior sum of 1 (log normalized UMI counts+1). Then, cells were filtered based on quality control and expression of CD8 T cell markers to remove low-quality cells, doublets and contaminating non-CD8 T cells, as follows: Upon examination of parameter distributions, we filtered out cells having less than 1,500 or more than 30,000 UMIs; cells having less than 1,500 or more than 5,000 detected genes, cells in which ribosomal protein-coding genes represented more than 50% of UMI content and cells in which mitochondrial protein-coding genes represented more than 5% of UMI content. The 5542 quality-passed cells were further filtered based on the expression of CD8 T cell markers: 3574 cells expressing Cd8a, Cd8b1 and Cd2 but not Cd4 were kept for further analysis (processed data available as supplementary file in GEO entry).
For dimensionality reduction, we first identified the set of most variable genes using Seurat 2.3.4 method ‘mean.var.plot’ (using 20 bins, minimum mean expression = 0.25 and z-score threshold for dispersion = 0), which identified 1107 highly variable genes while controlling for the relationship between variability and average expression. Briefly, this method divides genes into 20 bins based on average expression, and then calculates z-scores for dispersion (calculated as log(variance/mean)) within each bin. From this initial set of highly variable genes, we removed 204 genes involved in cell cycle (as annotated by Gene Ontology under code GO:0007049 or highly correlated with them, i.e. with Pearson’s correlation coefficient >0.5) or coding for ribosomal or mitochondrial proteins. The remaining 903 highly variable genes were used for dimensionality reduction using Principal Components Analysis (PCA). PCA was performed on standardized gene expression values by subtracting from normalized UMI counts, their mean and dividing by the standard deviation. Upon scree plot inspection of PCA eigenvalues contributions, we selected the first 10 Principal Components for clustering and tSNE visualization (Supplemental Figure 10(a)). For visualization, we used tSNE with default parameters (perplexity = 30 and seed set to 12345). For clustering, we performed hierarchical clustering on the top 10 PCs using Euclidean distance and Ward’s criteria. Silhouette coefficient analysis over different number K of clusters indicated a big drop of cluster silhouette after K = 4, and this was selected as the optimal number of clusters. To evaluate clustering robustness, we additionally ran K-means (with K = 4) and the shared nearest neighbor (SNN) modularity optimization clustering algorithm implemented in Seurat 2.3.4 with resolution parameter = 0.3 (which produced 4 clusters) and other parameters by default. Clustering agreement analysis using adjusted Rand Index (as implemented in mclust R packageCitation15) indicated high agreement between the three clustering results (Rand Index 0.70–0.81). Moreover, this analysis indicated that the SNN clustering produced the most consistent result with the other two (with Rand Index of 0.81 against hierarchical and 0.76 against K-means, while K-means vs hierarchical had 0.7), and therefore was kept as the final clustering solution. Robustness of our clustering results in data normalization, scaling and detection of variable genes was confirmed by re-analysis using Seurat 3 SCTransformCitation16 (Supplemental Figure 10(b)).
The code to reproduce the clustering is available at https://gitlab.unil.ch/carmona/workflow_Carmona_etal_2019_CD8TIL for the original analysis with Seurat 2, and at https://gitlab.unil.ch/carmona/workflow_Carmona_etal_2019_CD8TIL_Sv3 for validation using Seurat 3.
Gene-signature analysis
To obtain cluster-specific gene signatures, we performed differential expression analysis of each cluster against the others using MASTCitation17 with default parameters, and further required that for each cluster, differentially expressed genes had a log fold-change higher than 0.25, were expressed at least in 10% of its cells, and that this fraction is at least 10% higher than in the other clusters. Lists of differentially expressed genes in each cluster can be found in Supplemental Table 1.
To identify cycling cells we evaluated enrichment of the cell-cycle signature (Supplemental Table 3) in each cell, using the Area Under the Curve (AUC) method implemented in AUCell Bioconductor’s package.Citation18 Briefly, the AUC value represents the fraction of genes, within the top 1500 genes in the ranking (ordered by decreasing expression) that are included in the signature. Upon examination of AUCs distribution, we set an AUC cutoff of 0.2 for cell cycling classification (which corresponded to a z-score of ~2.5).
For CD8 T cell subtypes reference signature enrichment analysis, we first collected different T cell signatures from literature and generated other signatures by performing differential expression analysis (using Geo2R NCBI Gene Expression Omnibus tool, with default parameters) from public transcriptomic datasets. For every gene signature, up to 200 top genes (same limit used by MSigDB Immunologic Signatures collection) were kept sorted by fold-change from the differentially expressed genes (defined as FDR adjusted p-value <0.05 and |log2 fold-change| >1). The list of genes in each signature can be found in Supplemental Table 3.
For signatures of naïve (CD44-), effector (KLRG1+ at day 4.5 p.i.) and memory (day 60 p.i.) virus-specific CD8 T cell isolated in the context of acute infection (“Memory vs effector (acute inf.)”), we used the LCMV Armstrong virus infection data from Sarkar et al.Citation19, GEO accession GSE10239, considering differentially expressed genes of effector vs naive, memory vs naïve and effector vs memory. The signatures of (PD-1+ Tcf1+) memory-like vs (PD-1+ Tcf1−) exhausted virus-specific (P14) CD8 T cells in LCMV chronic infection clone 13 (“memory-like vs exhausted (chronic inf.)”) were obtained from Utzschneider et al.Citation11 (GSE83978) by taking differentially expressed genes between PD-1+ Tcf7:GFP+ vs PD-1+ Tcf7:GFP– . The signatures of (PD-1+ Tcf1+) memory-like vs (PD-1+ Tcf1−) exhausted tumor-specific (P14) CD8 T cells in B16-gp33 melanoma tumors (“memory-like vs exhausted (tumor)”) were obtained from GEO GSE114631Citation7 by taking differentially expressed genes between Tcf7:GFP+ vs Tcf7:GFP−. For the signatures of tumor-infiltrating vs spleen-derived in acute infection at day 8 post listeria infection (“Tumor vs acute infection”), we used the data of Schietinger et al.Citation20 (GEO GSE60501).
For cell-cycle signature we used the gene set (cellCycle_union, Supplemental Table 3) obtained by combining the G1/S and G2/M signature genes from Tirosh et al.Citation21 (cellCycle, Supplemental Table 3) with the set of genes whose expression in our dataset was highly correlated with cell-cycle-related genes (Pearson’s correlation > 0.5, cellCycleCorrelated, Supplemental Table 3).
To evaluate associations (overlap) between cluster signatures and reference signatures ( and Supplemental Figure 1), for each pair of cell cluster signature genes and reference signatures, contingency tables were calculated by counting how many genes among all expressed genes (15337) are present or absent in the cluster or the reference signature, and then one-sided Fisher’s exact test with FDR adjustment for multiple testing was used to calculate statistical significance of associations.
For the quantification of stemness (Tcf7, Lef1, Sell, Il7r), cytotoxicity (Prf1, Fasl, Gzmb) and inhibition/exhaustion (Pdcd1, Havcr2, Tigit, Lag3, Ctla4) scores, we calculated single-cell AUC enrichment scores (using AUCell package, as described for cell cycling). For , average enrichment scores for each cluster (after removing cycling cells from all clusters) were scaled to range between 0 and 1 and plotted using ggradar R’s package (https://github.com/ricardo-bion/ggradar).
To evaluate enrichment of EM-like, memory-like and exhausted signatures in public bulk RNA-seq data of CD8 T cells upon PD-1 blockade or TOX KO, we performed signature enrichment analysis (GSEA) using Bioconductor package clusterProfiler with default parameters (version 3.10.1Citation22). Reads were pre-filtered using Trimmomatic v0.39Citation23 transcript abundances were estimated using Salmon v0.14.0 Citation24 with default parameters and mouse reference transcriptome version GRCm38, summarized at gene-level using tximport v1.10.1Citation25 and differential gene expression analysis was conducted using DESeq2 v1.22.2 with default parameters.Citation26 RNA-seq data of CD8 TILs in murine sarcoma (tumors were harvested at day 12 post-transplant, 3 days after treatment) was obtained from GEO accession GSE62771 (anti-PD-1 vs control).Citation27 RNA-seq data of CD8 TILs in non-small cell lung cancer (anti-PD1 vs control) were obtained from GEO accession GSE114300.Citation28 RNA-seq data from adoptively transferred (in vitro activated) OT-1 cells infiltrating B16-OVA tumors (anti-PD1 vs control) were obtained from GEO GSE93014.Citation29 Differential expression data from tumor-specific CD8 TILs (liver cancer) knockout for TOX (TOX-KO) vs wildtype were obtained from Table S1 of Scott et al.Citation30
Cluster validation using independent dataset
To confirm the robustness of the transcriptomic states identified in our data, we re-analyzed an independent publicly available single-cell RNA-seq dataset of ~400 CD8 TILs from B16 melanoma tumors.Citation31 Gene expression data processing and clustering were conducted in the same way as described for our dataset. Consistently, four distinct transcriptomic states were identified corresponding to naïve, terminal exhausted, memory-like and EM-like populations (Supplemental Figure 3(a, b)), plus a cluster of cycling cells in proximity to exhausted and memory-like cells. Despite the different technologies used (smart-seq2 vs 10X 5ʹ counting), we found a remarkable correspondence between the CD8 TIL states identified in the two datasets, both in terms of gene markers (Supplemental Figure 3(b)) and systematic comparison of gene signatures (Supplemental Figure 3(g)). To evaluate associations (overlap) between cluster signatures from the two datasets, one-sided Fisher’s exact test with FDR adjustment for multiple testing was used (Supplemental Figure 3(g)).
Flow cytometry analysis of CD8 TILs
For the flow cytometry analysis purified CD8 cells specific for the surrogate tumor antigen LCMV gp33 (P14) were adoptively transferred (106 cells) into naive C57BL/6 (B6) mice (CD45.1). One day later, mice were implanted subcutaneously with B16 melanoma cells expressing LCMV gp33 (B16-gp33). Tumors were excised post 12 days of tumor engraftment and tumor-infiltrating T cells were isolated as described above. Surface staining was performed with mAbs for 30 min at 4°C in PBS supplemented with 2% FCS and 0.01% azide (FACS buffer) using antibodies listed in the table.
For intranuclear staining cells were first stained at the surface before fixation and permeabilization using the transcription factor staining kit (eBioscience) followed by intranuclear staining for transcription factor.
Flow cytometry measurements of cells were performed on an LSR-II or Fortessa flow cytometer (BD). Data were analyzed using FlowJo (TreeStar).
Construction and validation of the tumor-infiltrating CD8T cell transcriptomic state predictor (TILPRED)
Integrated knowledge on CD8 tumor-infiltrating T cells states was used to develop a novel transcriptomic classifier of CD8 T cell states for mice and human (TILPRED). A major challenge for the classification of single-cell transcriptomes across experiments is that gene expression measurements are affected by the large variability in single-cell library sizes, and experimental and data processing protocols used. To overcome some of these issues, our classifier uses only gene expression rankings to quantify TIL state signature enrichment. Moreover, since cell cycle has a significant transcriptomic impactCitation32-Citation34 we also included cell-cycle signature detection in TILPRED, which allows for quantification of cycling T cells in the different states.
To classify tumor-infiltrating CD8 T cells from single-cell RNA-seq data we first generated 12 sets of differently expressed genes (DEG) corresponding to all possible pairs between the four transcriptomic states. Differential expression between pairs of clusters was assessed with MAST 1.8.2 using default parameters (after excluding cycling cells in all clusters, in order to avoid this confounding factor), and further filtering genes with a log fold-change higher than 0.5, expressed at least in 10% of one of the clusters, and with a cellular detection rate difference of at least 10% between clusters. Next, pairwise DEG sets were further filtered to keep those having orthologs in humans (as annotated in Ensembl 95Citation35 or NCBI HomoloGene 68 if orthologs missing in Ensembl).
The 12 pairwise DEG sets were then used to score all single-cells in our dataset, calculating gene-set enrichment AUC (area under the ‘enrichment’ curve) within the top 1500 genes in the ranking, using AUCell.Citation18
Next, the dataset was randomly split into a training and a test dataset with 70% and 30% of the cells, respectively. The AUC scores for the 12 pairwise DEG (a training set of 70% of the cells) were used to train a multinomial logistic regression model with lasso penalty using R package glmnetCitation36 with parameter alpha = 1 (lasso penalty) and intercept set to 0. The regularization parameter lambda for the lasso was evaluated by 10-fold cross-validation using cv.glmnet function, and was set to the minimum value (lambda = e−6) for which the mean cross-validated error (cve) was at most 50% higher (i.e. cve = 0.539) than the minimum mean cross-validation error (cve = 0.374, for lamda = 4.2 e−5).
Performance of the model was assessed in the test set (remaining 30% of the cells) assigning T cell state predictions to all cells where the model output (logistic response variable) was higher than 0.5 in any state (~5% of the cells did not pass the threshold and were annotated as ‘unknown’); its accuracy was 0.94 (95% CI: 0.92, 0.95) with a mean specificity of 0.98 and a mean sensitivity of 0.90. Finally, the model was trained on the full dataset and implemented as an R package, publicly available at http://github.com/carmonalab/TILPRED. To detect cycling cells with TILPRED, we recommend a cutoff for cellCycleThreshold between 0.1 and 0.2 depending on desired sensitivity/specificity; the optimal value might differ between datasets of different quality levels.
To evaluate predictive performance in an independent dataset, we compared TILPRED predictions against the result of unsupervised clustering of the CD8 TIL dataset of Singer et al.Citation31 (GEO GSE86042) (Supplementary Figure 4(a)). The clustering analysis was performed in the same way as for our dataset (on the first 10 principal components of the most highly variable genes), except that instead of using a unique clustering solution (such as SNN clustering used to define clusters in our dataset), we used as T cell states ‘ground truth’ the consensus between SNN, K-means and hierarchical clustering (using Ward’s criteria) solutions. Classification accuracy using this dataset was 91% (Supplementary Figure 4(a)).
While we showed that TILPRED performed very well in multiple murine datasets, one of its potential limitations is that its classification is restricted to the currently known mouse CD8 TIL states (i.e. terminally exhausted, progenitor exhausted/memory-like, effector memory and naïve, plus “cycling”). Hence, if under certain perturbations (e.g. for certain gene knock-outs or immuno-modulatory therapies) CD8 T cells undergo alternative differentiation pathways and acquire novel transcriptomic states, these will not be correctly classified by TILPRED. Once additional CD8 TIL states are described and more data are used for training, future versions of TILPRED will be updated to predict them.
TILPRED analysis of public datasets
For the prediction of TIL states in MC38 carcinoma, we analyzed tumor-infiltrating T cells of the Xiong dataset.Citation37 UMI counts matrix was obtained from ArrayExpress (accession E-MTAB-7919). Upon examination, high-quality CD8 T cells were filtered as those having between 1000 and 5000 expressed genes, 1000 and 20,000 UMI counts, less than 4% of UMI counts mapping to mitochondrial genes, less than 40% of genes mapping to ribosomal proteins coding genes, and that expressed Cd2, Cd3g, Cd8a, Cd8b1 and did not express Cd4, Foxp3, Tyrobp or Spi1 (that are associated to CD4 T cells or myeloid cells). Next, TILPRED was run to classify CD8 TIL states, with parameters scoreThreshold = 0.6 and cellCycleThreshold = 0.1. For visualization, we identified the most variable genes (using Seurat 2.3.4 FindVariableGenes function with y.cutoff = 0), performed PCA on scaled variable genes excluding ribosomal, mitochondrial and cell-cycle-related genes, and ran tSNE on the top 10 principal components (with perplexity by default, equal to 30). For prediction of (PD-1low) CD8 TIL states in MC38 upon ICB (NCBI GEO GSE122969 Citation38), high-quality cells were filtered based on number of detected genes (between 500 and 5000), number of UMIs (1–50 K) and percentage of UMIs mapping to mitochondrial (<10%) or ribosomal genes (<60%). CD8 T cells were further filtered by based on co-expression of Cd2, Cd8a, Cd8b1 and Cd3g (≥1 UMI each) and lack of Cd4 expression. For the sarcoma dataset (NCBI GEO GSE122969 Citation39), after examining distributions, high-quality cells were filtered based on number of detected genes (between 500 and 5000), number of UMIs (1.5–20 K) and percentage of UMIs mapping to mitochondrial (<10%) or ribosomal genes (<50%). CD8 T cells were further filtered from other immune cell infiltrates based on co-expression of Cd2, Cd8a and Cd8b1 (≥1 UMIs each), lack of Cd4 expression (0 UMI) and lack of – or low expression of – Fcer1g and Tyrobp (<2 UMIs). Next, for T cell classification TILPRED was run with default parameters.
For the prediction of CD8 TIL states in the melanoma patients dataset, we downloaded processed gene expression data from NCBI GEO (accession GSE120575Citation40). High-quality cells were filtered based on the number of detected genes (between 1000 and 6000) and the percentage of TPMs mapping to ribosomal genes (<10%). CD8 T cells were further filtered from other immune cell infiltrates based on co-expression of CD2, CD8A, CD8B (log2 (TMP+1) ≥1), lack of CD4 expression (TPM = 0) and lack of – or low expression of – non-T cell genes FCER1G, TYROBP, SPI1, IGKC, IGJ, IGHG3 (log2 (TPM+1) <3). Next, TILPRED was run using parameters set for human cells (human = TRUE) and with a lower score threshold for prediction (scoreThreshold = 0.3, instead of the default 0.5), in order to increase sensitivity to weaker signals. TILPRED was trained on mouse data and therefore the classification of human TILs is done via ortholog mapping. For the visualization of these data in Supplemental Figure 9(a), we used Seurat 2.3.4 to identify highly variable genes and perform dimensionality reduction using tSNE on the first 10 Principal Components computed on centered and variance-scaled expression values. The four CD8 TIL states (naïve, EM-like, exhausted and memory-like) as well as cycling TILs were predicted in all patients (Supplemental Figure 9(a)). To evaluate compositional shifts upon therapy, we selected patients having samples before and after ICB and at least 30 cells in each sample (Supplemental Figure 9(b)). Seven patients matched these criteria, three of which responded (P1, P7, P28) and four that failed to respond to ICB (P2, P3, P12, P20). Interestingly, compared to non-responders, responders had an increased proportion of EM-like cells upon therapy (Supplemental Figure 9(c), p = .0317 one-sided Wilcoxon test).
For the prediction of TIL states of the Miller dataset of (B16-OVA) tumor-specific tumor-infiltrating CD8+ T cells, UMI counts matrix was obtained from GEO (accession GSE122675). Upon examination, high-quality CD8 T cells were filtered as those having between 1000 and 5000 expressed genes, 1000 and 30,000 UMI counts, less than 6% of UMI counts mapping to mitochondrial genes, less than 50% of genes mapping to ribosomal proteins coding genes, and that expressed Cd2, Cd3 g, Cd8a, Cd8b1 and did not express Cd4 or high levels of Tyrobp or Spi1 (that are associated to CD4 T cells or myeloid cells, respectively). Next, cell states were predicted with TILPRED (using cellCycleThreshold = 0.1 for increased sensitivity). Cells classified as cycling were excluded from the analysis.
WebApp deployment for scRNA-seq data exploration
Our web application uses interactive Summarized Experiment Explorer “iSEE”Citation41 and R Shiny, and is available at http://TILAtlas.org.
Results
Single-cell RNA-seq of CD8 TILs reveals the presence of exhausted, memory-like, naïve and effector memory-like T cells
To obtain an unbiased view of the transcriptomic landscape of tumor-infiltrating CD8 T cells from B16 melanoma tumor-bearing mice, we performed single-cell transcriptomic profiling paired with VDJ locus sequencing of CD8 TILs. We individually analyzed four wild-type (WT) C57BL/6 mice and three PMEL transgenic mice, whose CD8 T cells express a transgenic TCR specific for the B16 tumor-associated antigen gp100/PMEL on a C57BL/6 genetic background (). After data processing and quality control, >3500 CD8 T cells from the seven tumors were kept for downstream analyses (see Methods). Unsupervised clustering on the high-dimensional space revealed the presence of four robust CD8 TIL clusters with distinct transcriptomic profiles. Cluster 1 (C1) was defined by high expression of inhibitory receptors Pdcd1, Havcr2, Ctla4, Tigit and Lag3, exhaustion-related transcription factors such as Batf and ToxCitation30,Citation42-Citation44 and high expression of cytotoxic molecules (e.g. Gzmb, Prf1, Fasl), compatible with an exhausted state (). Cluster 2 (C2), in proximity to C1, was defined by the co-expression of inhibitory receptors (expressing Pdcd1, Tigit and Lag3 but not Havcr2 or Entpd1) and memory-related genes (e.g. Tcf7, Lef1, Sell), and low levels of cytotoxicity genes (), compatible with the recently described memory-like subset.Citation6,Citation7 Cluster 3 (C3) was defined by high expression of markers of naïve/memory (e.g. Tcf7, Sell, Ccr7, Lef1, Il7r) and no expression of cytotoxicity genes or inhibitory receptors, compatible with a naïve or central memory state (). Based on the lack of Cd44 expression in this cluster () we provisionally refer to it as naïve cells cluster. Finally, cells in cluster 4 (C4) expressed high levels of memory-related genes (e.g. Tcf7, Lef1, Il7r) together with cytotoxicity genes (e.g. Gzmk, Gzmb). Compared to the memory-like C2, C4 was characterized by low expression of the inhibitory receptors Pdcd1, Tigit, Lag3 and the exhaustion-related transcription factors Tox and Batf (). Expression of granzymes and lack of Sell and Ccr7 expression suggested an effector memory rather than a central memory phenotype (). Hence, this cluster was referred to as Effector Memory-like (“EM-like”) state (). Note that, while T cells with effector memory phenotype have been previously observed among TILs,Citation45,Citation46 EM-like cells have never been characterized at the transcriptomic level on murine tumors, and a gene signature for this population remains to be defined. Differentially expressed genes in each cluster are shown in Supplemental Table 1. Gene expression differences between these four clusters could be further summarized by the expression of three gene sets associated with 1) cytotoxicity (Gzmb, Prf1 and Fasl), 2) inhibition/exhaustion (Pdcd1, Havcr2, Tigit, Lag3, Ctla4) and 3) “stemness” (Tcf7, Sell, Il7 r, Lef1). While the naïve cluster (C3) presented the highest level of stemness and the lowest inhibition and cytotoxicity, the exhausted cluster (C1) presented the lowest levels of stemness with the highest levels of inhibition and cytotoxicity (). The memory-like (C2) cluster displayed higher levels of “stemness” compared to exhausted, together with lower levels of inhibition and very low levels of cytotoxicity, in line with previous observations.Citation6,Citation7 Instead, the EM-like (C4) cluster displayed intermediate levels of cytotoxicity and “stemness”, with low levels of inhibition ().
Figure 1. Defining CD8 TIL states
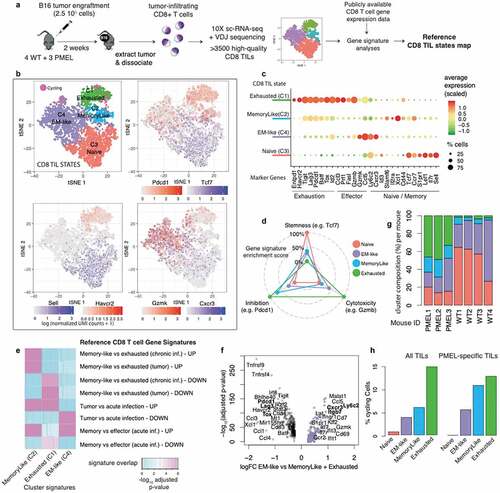
We next evaluated to what extent these CD8 TIL states relate to previously described CD8 T cell subsets found in the context of cancer or infection. An initial gene-signature enrichment analysis confirmed that C3 matched the transcriptomic state of splenic naïve T cells,Citation19 while the other three clusters up-regulated genes associated with differentiated CD8 T cells (Supplemental Figure 1, see Methods). Next, we focused on the three differentiated states to evaluate signature enrichment against specific CD8 T cell subtypes. We found a consistent mapping of the memory-like (C2) cluster with the tumor-resident PD-1+ Tcf1+ “memory-like” subsetCitation7 (), whereas the exhausted cluster (C1) was mapped to the “exhausted” PD-1+ Tcf1− subset described in the same study. Further, these two clusters also matched the memory-like and exhausted subsets, respectively, found in chronic infectionCitation11 ().
The EM-like cluster did not match the exhausted nor the memory-like signatures, and instead showed specific enrichment for the signature of pathogen-specific CD8 T cells found upon acute infection (“Tumor vs acute infection – DOWN”, row 6 in ).Citation20 Further, among pathogen-specific CD8 T cells found upon acute infection, the EM-like cluster was specifically enriched in the signature of memory (day 60 post LCMV Armstrong infection, “Memory vs effector (acute inf.) – UP”) rather than effector (KLRG1+ day 4.5 post LCMV Armstrong infection) CD8 T cells (“Memory vs effector (acute inf.) – DOWN”) (rows 7 and 8 in (e)). Hence, signature enrichment analysis confirmed an effector memory (EM-like) phenotype for this population. Since EM-like cells have not been previously characterized in B16 tumors, we analyzed this cluster in more detail. Differential gene expression analysis of EM-like vs exhausted and memory-like cells revealed potential novel markers for this population (), including Ly6c2 that encodes a surface molecule that has been previously associated to memory CD8 T cellsCitation48-Citation50 and Cxcr3, a chemokine receptor that guides the recruitment of T cells into inflamed peripheral tissue.Citation51
Next, we analyzed how CD8 TIL states were distributed among and within WT and PMEL mice. We found that T cells from all mice were present in all four states (, Supplemental Figure 2 and Supplemental Table 2), although a clear distribution bias was observed between WT and PMEL mice (i.e. according to antigen-specificity). TILs from PMEL mice were enriched in exhausted (33–49% of PMEL vs 2–4% of WT) and memory-like (14–20% of PMEL vs 3-8% of WT) states. TILs from WT mice were enriched in EM-like (17–37% of PMEL vs 26–69% of WT) and naïve (14–20% of PMEL vs 27–65% of WT) T cells. Thus, while tumor-specific cells are enriched in the exhausted and memory-like states, total polyclonal CD8 TILs are enriched in the EM-like and naïve states. Interestingly, our analysis revealed the presence of tumor-reactive (PMEL) cells in the EM-like state.
Cycling cells (i.e. with high expression of cell cycle-related genes) were detected within exhausted (16%), memory-like (6%) and EM-like (4%) states (cells in magenta in left panel), as opposed to cells from the naïve cluster that did not cycle (<1%). When considering PMEL-specific T cells (effectively expressing PMEL TCR receptor, see Methods), a similar distribution was observed (, right panel). This indicates that in addition to exhausted and memory-like, EM-like cells, including tumor-specific EM-like cells, replicate in the tumor.
The robustness of the four identified transcriptomic states was confirmed by unsupervised clustering of an independent publicly available scRNA-seq dataset of CD8 TILs from B16 melanoma tumors,Citation31 where a consistent cluster correspondence was verified between datasets (Supplemental Figure 3). Furthermore, re-analysis of a recently published scRNA-seq dataset of tumor-specific CD8 TILs in B16-OVA tumorsCitation6 revealed the presence of EM-like cells (12% among OVA Tetramer+ CD8 TILs) in addition to memory-like (11%) and exhausted (76%) cells (Supplemental ), further supporting that part of the EM-like subset contains tumor-specific cells.
Overall, we were able to define the landscape of transcriptomic states of endogenous CD8 TILs in B16 melanoma tumors and recapitulate the naïve, memory-like and exhausted CD8 TIL subsets through an unbiased analysis of single-cell heterogeneity. Moreover, we observed that among total CD8 TILs the most prominent subset corresponded to a transcriptomically distinct state that resembles that of effector memory T cells found in the context of acute infections.
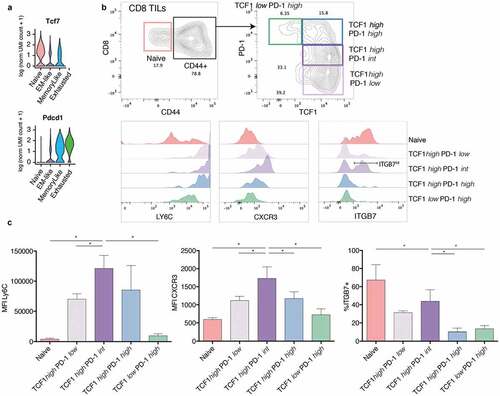
EM-like cells can be identified as Tcf1 high PD-1 intermediate CD8 TILs by flow cytometry
Our scRNA-seq data showed that the levels of Tcf7 (encoding Tcf1) expression were high among naïve, memory-like and EM-like, and zero among exhausted cells (). Pdcd1 (encoding PD-1) expression was highest in exhausted and memory-like, intermediate in EM-like and absent in naïve CD8 TILs (). To validate these observations at the protein level, we performed flow cytometry analysis of CD8 TILs infiltrating B16 tumors at day 12 post tumor engraftment. In agreement with previous studiesCitation52 and consistently with our scRNA-seq data, we found both naïve (CD44low, 4–20%) and antigen-experienced (CD44high) cells among CD8 TILs. Next, CD44high CD8 TILs were classified into four compartments according to Tcf1 and PD-1 expression: Tcf1low PD-1high (~9% on average), Tcf1high PD-1high (~31%) and Tcf1high cells with low (~21%) or intermediate (~30%) PD-1 levels (). According to the transcriptomic profiles and in line with previous evidenceCitation6,Citation7 exhausted cells are mostly found in the Tcf1low PD-1high compartment and memory-like cells in the Tcf1high PD-1high gate. From our transcriptomics data EM-like cells were predicted to be in the Tcf1high PD-1int compartment () and to display high levels of Ly6c2, Cxcr3 and Itgb7 (). Indeed, the Tcf1high PD-1int compartment showed the highest levels of EM-like predicted markers Ly6C and CXCR3 and a higher proportion of ITGB7+ cells compared to PD-1 high cells (), confirming our predictions. Hence, EM-like cells can be identified by flow cytometry as Tcf1high PD-1int CD8 TILs.
Figure 2. Flow cytometry validation of CD8 TIL populations
Exhausted, memory-like and EM-like CD8 TILs are clonally expanded and show partial clonal relatedness
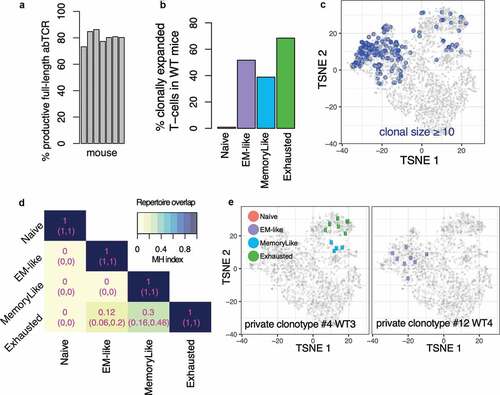
In order to assess the clonal relatedness of CD8 TIL states, we analyzed T cell receptors' alpha and beta chain sequences in the >3500 single-cells shown in (see Methods). We obtained full-length productive paired alpha and beta chain sequences (VJ or VDJ, respectively) in 81% of the CD8 TILs ( and Supplemental Figure 5(a)).
In each WT mouse, we identified T cells of the same clonotype, i.e. those expressing identical CDR3 sequences for both alpha and beta T cell receptor chains. We found that between 10% and 39% of the TILs were expanded (i.e. their TCR were shared with at least another T cell in the same mouse, Supplemental Figure 5(a)). As expected, less than 1% of expanded T cells were found in the naïve state (). In contrast, 68% of the T cells were expanded in the exhausted state, 52% in the EM-like state and 39% in the memory-like state ( and Supplemental Figure 5(b,c)). Expanded clonotypes did not match reported invariant chains and no known epitopes were found for these TCRs by literature and database searches. Furthermore, clonotypes in WT mice were largely private (mouse-specific) (see Methods and Supplemental Figure 5(d)). As a control, a large clonal overlap was observed between different PMEL mice, due to the common transgenic PMEL TCR (Supplemental Figure 5(d,e)).
Next, we quantified TCR repertoire overlap between transcriptomic states. To this aim, we assessed TCR repertoire similarity using the Morisita-Horn (MH) similarity index that considers the relative frequencies of clonotypes between samples, where 0 indicates no overlap, and 1 is an exact match.Citation53 Interestingly, this analysis revealed a large clonal overlap between exhausted and memory-like states (MH index = 0.30, confidence interval of (0.16,0.46), , see Methods). A smaller yet considerable overlap was observed between exhausted and EM-like states (MH = 0.12, confidence interval (0.06,0.2)), indicating that these are also clonally related. Finally, overlaps between EM-like and memory-like or between naïve and any other state were not detected (MH = 0). Examples of expanded clones are shown in . A consistent clonal structure was observed in an independent dataset and in individual tumors (Supplemental Figure 6(d), see Methods).
These results show that single clonotypes within endogenous CD8 TILs span both exhausted and memory-like states in line with recent studies demonstrating that memory-like tumor-specific T cells can give rise to exhausted T cells in the tumor.Citation6,Citation7 Furthermore, although EM-like and exhausted states presented largely distinct TCR repertoires, some clones were present in both, suggesting that occasionally EM-like cells (most likely tumor-specific) may yield exhausted T cells, yet to a lesser degree than the memory-like state.
Figure 3., Clonal relatedness of CD8 TIL states
PD-1 checkpoint blockade expands EM-like cells
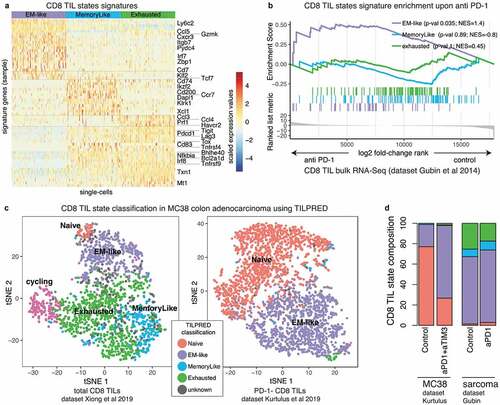
Multiple studies have established that PD-1 blockade expands intratumoral T cells and improves tumor control.Citation39,Citation54-Citation56 However, it is less clear how different CD8 T cell states are affected by immune-checkpoint blockade (ICB). Hence, here we aimed at evaluating the impact of ICB on the murine CD8 TIL transcriptomic landscape. To this end, we first extracted gene signatures of the exhausted, memory-like and EM-like states from our scRNA-seq dataset ( and Supplemental Table 1). Next, we performed gene-set enrichment analysis (GSEA) on published bulk RNA-seq data of CD8 TILs following anti-PD-1 therapy (raw data in murine sarcoma from Gubin et al.Citation27). Our results indicated that ICB led to a selective enrichment of the EM-like signature (p = .035, ). A similar effect was observed for non-small-cell lung cancer CD8 TILs upon ICB (Supplemental Figure 7(a), raw data from Markowitz et al.Citation28).
In order to assess whether the bulk transcriptomic signature shift toward the EM-like state upon ICB is explained by differences in CD8 TIL states composition, we re-analyzed publicly available scRNA-seq data of CD8 TILs pre vs post ICB. To this end, we developed a new machine learning tool, named TILPRED, that accurately classifies murine CD8 TIL states (see Methods). We used TILPRED to classify CD8 TILs in multiple datasets and cancer types, including melanoma, colon adenocarcinoma and sarcoma (, Supplemental Figure 4). TILPRED showed high accuracy in cross-validation (specificity of 0.98 and sensitivity of 0.90, see Methods) and high concordance with clustering approaches in independent datasets (Supplemental Figure 4(a)). TILPRED classification of CD8 TILs from MC38 colon adenocarcinomaCitation38 and sarcomaCitation39 showed an increase in the proportion of EM-like TILs upon ICB at the single-cell level (, Supplemental Figure 4), consistent with the enrichment of the EM-like signature in the bulk transcriptomics data. Hence, our analyses indicate that EM-like T cells expand upon ICB.
Finally, to investigate whether ICB resulted in an enrichment of EM-like cells in cancer patients, we ran TILPRED on CD8 TIL scRNA-seq data from melanoma patients. TILPRED was trained on mouse data only and thus it might not fully capture human TIL heterogeneity. Regardless, patients that responded to ICBCitation40 showed an increased proportion of predicted EM-like cells (p = .032, see Methods and Supplemental Figure 9). These data suggest that intratumoral EM-like T cells in cancer patients might also be modulated by ICB.
Figure 4. CD8 TIL landscape modulation upon anti-PD-1 therapy
Discussion
In the past few years, single-cell transcriptomics studies have revealed a large complexity of CD8 T cells in the tumor microenvironmentCitation3,Citation21,Citation46,Citation57-Citation59 and this heterogeneity is likely to be a determining factor in therapy outcome.Citation40,Citation60 Murine pre-clinical models have been instrumental to characterize this heterogeneity.Citation6,Citation7 To correctly interpret murine scRNA-seq data, robust transcriptomic maps of the total CD8 TIL subtypes are needed. Such maps can further facilitate interpretation of human CD8 TIL samples that are typically characterized by large biological and technical variability and for which antigen specificity is often unknown.
Here we have defined a reference transcriptomic map of CD8 TILs in the common B16 melanoma model. Our single-cell RNA-seq analysis enabled us to robustly and unbiasedly define four distinct CD8 TIL transcriptomic states: exhausted, memory-like, naïve and effector memory-like (EM-like). Consistent with previous observations, tumor-specific PMEL TILs were enriched in exhausted and memory-like states.Citation6,Citation7 In contrast, total polyclonal CD8 TILs were enriched in the EM-like and naïve states. Therefore, an intriguing question is why the EM-like population is abundant in the endogenous polyclonal CD8 TIL compartment, but small among tumor-specific cells. A likely explanation is that the EM-like compartment is enriched in non-tumor-specific cells, as multiple studies have shown the presence of large numbers of “bystander” T cells in human tumors.Citation61,Citation62 However, the presence of tumor-specific PMEL T cells in the EM-like state ( and Supplemental Figure 2) as well as the clonal expansion and partial TCR repertoire overlap between the EM-like and exhausted states ( and Supplemental Figure 6 D) indicates that at least part of the EM-like population is indeed tumor-specific.
Compared to exhausted and memory-like, EM-like cells have lower expression of inhibitory receptor genes such as Pdcd1, Tigit, Lag3 and of the transcription factor Tox (Supplemental Figure 7 D), which is essential to establish and maintain the epigenetic T cell exhaustion program enabling T cells to persist in the context of chronic antigenic stimulation.Citation30,Citation42-Citation44 Interestingly, reanalysis of published data indicated that tumor-specific CD8 TILs knock-out for Tox down-regulated the signature of the exhausted state and up-regulated the EM-like signature (and the memory-like signature to a lesser extent, Supplemental Figure 7(c)). This suggests that Tox-KO tumor-specific CD8 TILs, which are unable to differentiate into exhausted cells, might remain in the pre-exhausted EM-like and memory-like states. Hence, our data suggest that the EM-like may be an early differentiation state of tumor-infiltrating CD8 TILs before receiving persistent antigenic stimulation. In this scenario, upon tumor migration, immunodominant clones in the EM-like state would rapidly activate the exhaustion program and differentiate in response to strong antigenic stimulation. In line with this hypothesis, our re-analysis of scRNA-seq data of tumor-specific CD8 TILs from Miller and colleaguesCitation6 indicated that while 12% of EM-like cells were detected at day 10 (Supplemental Figure 4(c)), only 1% were detected at day 20 post-tumor engraftment, suggesting a temporal progression toward more differentiated states. Cognate antigen dose and T cell avidity might be relevant factors controlling the dynamics of such intratumoral differentiation. For example, it has been shown that increased antigen dose and T cell avidity promote CD8 T cell differentiation into the exhausted phenotype in cancer and chronic infection.Citation11,Citation63 It is possible that subdominant clones, less subject to persistent stimulation, undergo a retarded differentiation and accumulate in the EM-like state. Hence, our results have potential implications on the understanding of intratumoral differentiation of CD8 T cells, an open central question in immunology.Citation64
Our flow cytometry analysis revealed that the EM-like population is enriched within the Tcf1high PD-1intermediate CD8 TIL compartment and expresses high levels of the surface markers Ly6C, CXCR3 and ITGB7, as predicted from the transcriptomic analysis. These are novel EM-like CD8 TIL surface markers that can be useful in functional studies of this population. Ly6C is an adhesion molecule expressed by neutrophils, monocytes, dendritic cells and also in subsets of CD4 and CD8 T cells, including memory CD8 T cells.Citation48-Citation50,Citation65 Interestingly, Ly6C+ CD8 T cells with effector memory phenotype isolated from spleens of tumor-primed mice have shown anti-tumor activity in vitro,Citation66 supporting the hypothesis that tumor-specific EM-like cells are related to pre-exhaustion states. The chemokine receptor CXCR3 is important for the recruitment of T cells into inflamed peripheral tissueCitation51 in response to CXCL9 and CXCL10 and is also required by CD8 TILs for effective response to anti-PD-1 therapy.Citation67 As the EM-like state expressed the highest levels of CXCR3, this chemokine system might contribute to the enrichment of EM-like cells upon anti-PD-1 therapy observed in our study. The EM-like state – together with naïve cells – also showed differential expression of the integrin subunit β7 (Itgb7). At the protein level, however, ITGB7 was expressed only by a subset of EM-like cells (). Of note, Itgb7 was co-expressed in EM-like cells with the integrin subunit α4 (Itga4) but not with Itgae (CD103), with which ITGB7 dimerizes in tissue-resident T cells.Citation68 Instead, the α4β7 integrin has been previously shown to mediate lymphocyte migration to gut-associated lymphoid tissue and might have a different function in the context of tumors.Citation69
Multiple studies have established that PD-1 blockade increases T cell infiltrations in tumors leading to improved anti-tumor control.Citation39,Citation54-Citation56 Moreover, recent studies have shown that ICB promotes the expansion of tumor-specific memory-like cells and their differentiation into (terminally) exhausted cells.Citation6,Citation7 However, it is less clear how the total CD8 TIL landscape is impacted by ICB. Our meta-analysis of bulk and single-cell transcriptomic data showed a selective enrichment of the EM-like signature (e.g. Cxcr3, Ly6c2, Ccl5, Gzmk, Itgb7) following ICB. As the EM-like is a relatively undifferentiated state, we reasoned that the EM-like signature would not be enriched upon ICB among T cell subsets that were already differentiated before treatment. Indeed, we observed that in vitro activated tumor-specific cells did not up-regulate the EM-like signature following adoptive transfer and ICB but instead up-regulated the exhaustion signature (e.g. Mt1, Havcr2, Prf1, Gzmb, etc., Supplemental Figure 7(b), sequencing data from Mognol et al.Citation29). This suggests that the enrichment in EM-like cells upon ICB depends on the expansion of relatively undifferentiated clones whereas tumor-specific T cells that have already activated the exhaustion program will only progress further toward exhaustion in response to ICB. In line with our observations, other studies have shown up-regulation of Cxcr3, Ccl5 and Ifit3 (EM-like state genes) or expansion of PD-1low CD8 T cells that partially contain EM-like cells, among CD8 TILs following ICB in murine models.Citation38,Citation39 In humans, a CD8 TIL subset differentially expressing GZMK and CXCR3 (EM-like state markers) has been previously observed in scRNA-seq analysis of basal and squamous cell carcinomaCitation70 hepatocellular carcinomaCitation59 and small-cell lung cancerCitation57 suggesting that a similar population might be conserved between mice and human. However, in these studies tumor specificity was unknown, limiting our understanding of EM-like TILs in cancer patients. Our finding of novel EM-like markers will facilitate future investigations aimed at defining the function of this intratumoral population and may provide better biomarkers of T cell response to immune-checkpoint blockade.
In conclusion, our scRNA-seq study defined a reference map of the transcriptomic landscape of CD8 TILs in B16 melanoma. As such, this resource provides a base upon which to interpret more complex CD8 TIL transcriptomic landscapes such as those derived from clinical samples, where T cell specificity and clonality are usually unknown. Future studies of additional mouse strains and cancer types will help us further refine the CD8 TIL landscape allowing for the translation of these findings to human TIL populations. Our new CD8 TIL classifier (https://github.com/carmonalab/TILPRED) might be an instrumental tool for this task. Finally, to enable seamless exploration of our scRNA-seq data we have deployed a streamlined web interface at http://TILAtlas.org.
Authors’ contributions
SJC, WH and DG conceived and designed the project, SJC analyzed the data and developed the bioinformatics tools; IS performed wet experiments and analyzed data; MB contributed to data analysis; SJC, WH and DG wrote the manuscript. All authors read and approved the final manuscript.
Consent for publication
All authors have approved the manuscript.
Disclosure of potential conflicts of interest
No potential conflicts of interest were disclosed.
Ethics approval
Animal experiments were performed in compliance with the Helsinki Declaration and the University of Lausanne Institutional regulations, and were approved by the veterinarian authorities of the Canton de Vaud.
Supplemental Material
Download ()Acknowledgments
We are grateful to Amaia Martinez Usatorre, Jesus Corria Osorio, Maria Eugenia Zaballa, Massimo Andreatta and Julien Racle for fruitful discussions and critical reading of the manuscript; to Prof. Pedro Romero for kindly providing the PMEL mice; to the Gene Expression Facility of EPFL (École Polytechnique Fédérale de Lausanne) that performed the 10x Genomics single-cell assays and the UNIL Flow Cytometry Facility for their assistance. Computations were performed at the Vital-IT Center for high-performance computing of the Swiss Institute of Bioinformatics (http://www.vital-it.ch).
Data availability
The single-cell sequencing data generated in this study are available in NCBI Gene Expression Omnibus (GEO) under accession number GSE116390. Single-cell datasets re-analyzed in this study are available in NCBI GEO under accession numbers GSE86042 (CD8 TILs from B16 melanomaCitation31), GSE122969 (PD-1- CD8 TILs from MC38Citation38), GSE119352 (whole-tumor sarcomaCitation39), GSE120575 (CD8 TILs of melanoma patientsCitation40); and in EBI Array Express E-MTAB-7919 (T cells from MC38 tumorsCitation37).
Supplementary material
Supplemental data for this article can be accessed on the publisher’s website.
Additional information
Funding
References
- Mclane LM, Abdel-Hakeem MS, Wherry EJ. CD8 T Cell exhaustion during chronic viral infection and cancer. 2019. doi: 10.1146/annurev-immunol-041015.
- Speiser DE, Utzschneider DT, Oberle SG, Münz C, Romero P, Zehn D. T cell differentiation in chronic infection and cancer: functional adaptation or exhaustion? Nat Rev Immunol. 2014;14(11):768–15. doi: 10.1038/nri3740.
- Li H, van der Leun AM, Yofe I, Lubling Y, Gelbard-Solodkin D, van Akkooi ACJ, van den Braber M, Rozeman EA, Haanen JBAG, Blank CU. et al. Dysfunctional CD8 T cells form a proliferative, dynamically regulated compartment within human melanoma. Cell. 2019; 176(4):775–789.e18. doi: 10.1016/j.cell.2018.11.043.
- Philip M, Schietinger A. Heterogeneity and fate choice: T cell exhaustion in cancer and chronic infections. Curr Opin Immunol. Elsevier Current Trends. 2019;58:98–103. doi: 10.1016/J.COI.2019.04.014.
- Tumeh PC, Harview CL, Yearley JH, Shintaku IP, Taylor EJM, Robert L, Chmielowski B, Spasic M, Henry G, Ciobanu V. et al. PD-1 blockade induces responses by inhibiting adaptive immune resistance. Nature. 2014;515:568–571. doi: 10.1038/nature13954
- Miller BC, Sen DR, Al Abosy R, Bi K, Virkud YV, LaFleur MW, Yates KB, Lako A, Felt K, Naik GS. et al. Subsets of exhausted CD8+ T cells differentially mediate tumor control and respond to checkpoint blockade. Nat Immunol. Nature Publishing Group. 2019; 20(3):326–336. doi: 10.1038/s41590-019-0312-6.
- Siddiqui I, Schaeuble K, Chennupati V, Fuertes Marraco SA, Calderon-Copete S, Pais Ferreira D, Carmona SJ, Scarpellino L, Gfeller D, Pradervand S. et al. Intratumoral Tcf1+PD-1+CD8+ T cells with stem-like properties promote tumor control in response to vaccination and checkpoint blockade immunotherapy. Immunity. Cell Press. 2019;50 (1):195–211.e10. doi: 10.1016/J.IMMUNI.2018.12.021.
- He R, Hou S, Liu C, Zhang A, Bai Q, Han M, Yang Y, Wei G, Shen T, Yang X. et al. Follicular CXCR5-expressing CD8+ T cells curtail chronic viral infection. Nat. 2016;537(7620):412–416. doi: 10.1038/nature19317.
- Im SJ, Hashimoto M, Gerner MY, Lee J, Kissick HT, Burger MC, Shan Q, Hale JS, Lee J, Nasti TH, et al. Defining CD8 + T cells that provide the proliferative burst after PD-1 therapy. Nat. 2016;537(7620):417–421. doi: 10.1038/nature19330.
- Kallies A, Zehn D, Utzschneider DT Precursor exhausted T cells: key to successful immunotherapy ? Nat Rev Immunol. Nature Publishing Group. 2019:1–9. doi: 10.1038/s41577-019-0223-7.
- Utzschneider DT, Charmoy M, Chennupati V, Pousse L, Ferreira DP, Calderon-Copete S, Danilo M, Alfei F, Hofmann M, Wieland D, et al. T cell factor 1-expressing memory-like CD8+ T cells sustain the immune response to chronic viral infections. Immunity. 2016;45(2):415–427. doi: 10.1016/j.immuni.2016.07.021.
- Wu T, Ji Y, Moseman EA, Xu HC, Manglani M, Kirby M, Anderson SM, Handon R, Kenyon E, Elkahloun A. et al. The TCF1-Bcl6 axis counteracts type I interferon to repress exhaustion and maintain T cell stemness. Sci Immunol. 2016;1 (6):eaai8593–eaai8593. doi: 10.1126/sciimmunol.aai8593.
- Overwijk WW, Theoret MR, Finkelstein SE, Surman DR, de Jong LA, Vyth-Dreese FA, Dellemijn TA, Antony PA, Spiess PJ, Palmer DC. et al. Tumor regression and autoimmunity after reversal of a functionally tolerant state of self-reactive CD8 + T cells. J Exp Med. 2003;198(4):569–580. doi: 10.1084/jem.20030590.
- Rempala GA, Seweryn M. Methods for diversity and overlap analysis in T-cell receptor populations. J Math Biol. 2013;67(6–7):1339–1368. doi: 10.1007/s00285-012-0589-7.
- Scrucca L, Fop M, Murphy T, Raftery A. mclust 5: clustering, classification and density estimation using gaussian finite mixture models.. R J. 2016;8:289. doi: 10.32614/RJ-2016-021
- Stuart T, Butler A, Hoffman P, Hafemeister C, Papalexi E, Mauck WM, Hao Y, Stoeckius M, Smibert P, Satija R. et al. Comprehensive integration of single-cell data. Cell. Cell Press. 2019;177:1888–1902.e21. doi: 10.1016/J.CELL.2019.05.031.
- Finak G, McDavid A, Yajima M, Deng J, Gersuk V, Shalek AK, Slichter CK, Miller HW, McElrath MJ, Prlic M. et al. MAST: A flexible statistical framework for assessing transcriptional changes and characterizing heterogeneity in single-cell RNA sequencing data. Genome Biol. 2015;16. doi: 10.1186/s13059-015-0844-5.
- Aibar S, González-Blas CB, Moerman T, Huynh-Thu VA, Imrichova H, Hulselmans G, Rambow F, Marine JC, Geurts P, Aerts J, et al. SCENIC: single-cell regulatory network inference and clustering. Nat Methods. Nature Publishing Group. 2017;14(11):1083–1086. doi: 10.1038/nmeth.4463.
- Sarkar S, Kalia V, Haining WN, Konieczny BT, Subramaniam S, Ahmed R. Functional and genomic profiling of effector CD8 T cell subsets with distinct memory fates. J Exp Med. 2008;205(3):625–640. doi: 10.1084/jem.20071641.
- Schietinger A, Philip M, Krisnawan VE, Chiu EY, Delrow JJ, Basom RS, Lauer P, Brockstedt DG, Knoblaugh SE, Hämmerling GJ. et al. Tumor-specific T cell dysfunction is a dynamic antigen-driven differentiation program initiated early during tumorigenesis. Immunity. Cell Press. 2016;45(2):389–401. doi: 10.1016/J.IMMUNI.2016.07.011.
- Tirosh I, Izar B, Prakadan SM, Wadsworth MH, Treacy D, Trombetta JJ, Rotem A, Rodman C, Lian C, Murphy G. et al. Dissecting the multicellular ecosystem of metastatic melanoma by single-cell RNA-seq. Science. 2016;352(6282):189–196. doi: 10.1126/science.aad0501.
- Yu G, Wang L-G, Han Y, He Q-Y. Clusterprofiler: an R package for comparing biological themes among gene clusters. OMICS J Integr Biol. Mary Ann Liebert, Inc. 140 Huguenot Street, 3rd Floor New Rochelle, NY 10801 USA. 2012;16 (5):284–287. doi: 10.1089/omi.2011.0118.
- Bolger AM, Lohse M, Usadel B. Trimmomatic: a flexible trimmer for Illumina sequence data. Bioinformatics. 2014;30(15):2114–2120. doi: 10.1093/bioinformatics/btu170.
- Patro R, Duggal G, Love MI, Irizarry RA, Kingsford C. Salmon provides fast and bias-aware quantification of transcript expression. Nat Methods. 2017;14(4):417–419. doi: 10.1038/nmeth.4197.
- Soneson C, Love MI, Robinson MD. Differential analyses for RNA-seq: transcript-level estimates improve gene-level inferences.. F1000Res. Faculty of 1000 Ltd. 2015;4:1521. doi: 10.12688/f1000research.7563.2.
- Love MI, Huber W, Anders S. Moderated estimation of fold change and dispersion for RNA-seq data with DESeq2. Genome Biol. BioMed Central. 2014;15(12):550. doi: 10.1186/s13059-014-0550-8.
- Gubin MM, Zhang X, Schuster H, Caron E, Ward JP, Noguchi T, Ivanova Y, Hundal J, Arthur CD, Krebber W-J. et al. Checkpoint blockade cancer immunotherapy targets tumour-specific mutant antigens. Nat. NIH Public Access. 2014;515(7528):577–581. doi: 10.1038/nature13988.
- Markowitz GJ, Havel LS, Crowley MJ, Ban Y, Lee SB, Thalappillil JS, Narula N, Bhinder B, Elemento O, Wong ST, et al. Immune reprogramming via PD-1 inhibition enhances early-stage lung cancer survival. JCI Insight. American Society for Clinical Investigation. 2018;3(13). doi: 10.1172/jci.insight.96836.
- Mognol GP, Spreafico R, Wong V, Scott-Browne JP, Togher S, Hoffmann A, Hogan PG, Rao A, Trifari S. Exhaustion-associated regulatory regions in CD8+ tumor-infiltrating T cells. Proc Natl Acad Sci U S A. National Academy of Sciences 2017;114(13):E2776–E2785. doi: 10.1073/pnas.1620498114.
- Scott AC, Dündar F, Zumbo P, Chandran SS, Klebanoff CA, Shakiba M, Trivedi P, Menocal L, Appleby H, Camara S. et al. TOX is a critical regulator of tumour-specific T cell differentiation. Nat. 2019;571:270–274. doi: 10.1038/s41586-019-1324-y
- Singer M, Wang C, Cong L, Marjanovic ND, Kowalczyk MS, Zhang H, Nyman J, Sakuishi K, Kurtulus S, Gennert D, et al. A distinct gene module for dysfunction uncoupled from activation in tumor-infiltrating T cells HHS public access graphical abstract. Cell. 2016;166 (6):1500–1511. doi: 10.1016/j.cell.2016.08.052.
- Barron M, Li J. Identifying and removing the cell-cycle effect from single-cell RNA-sequencing data. Sci Rep. 2016;6. doi: 10.1038/srep33892
- McDavid A, Dennis L, Danaher P, Finak G, Krouse M, Wang A, Webster P, Beechem J, Gottardo R. Modeling Bi-modality improves characterization of cell cycle on gene expression in single cells. PLoS Comput Biol. 2014;10:e1003696. doi: 10.1371/journal.pcbi.1003696.
- Scialdone A, Natarajan KN, Saraiva LR, Proserpio V, Teichmann SA, Stegle O, Marioni JC, Buettner F. Computational assignment of cell-cycle stage from single-cell transcriptome data. Methods. 2015;85:54–61. doi: 10.1016/j.ymeth.2015.06.021
- Zerbino DR, Achuthan P, Akanni W, Amode M, Barrell D, Bhai J, Billis K, Cummins C, Gall A, Girón CG. et al. Ensembl 2018. Nucleic Acids Res. Narnia. 2018;46(D1):D754–D761. doi: 10.1093/nar/gkx1098.
- Friedman J, Hastie T, Tibshirani R. Regularization paths for generalized linear models via coordinate descent.. J Stat Softw. 2010;33 doi: 10.18637/jss.v033.i01
- Xiong H, Mittman S, Rodriguez R, Pacheco-Sanchez P, Moskalenko M, Yang Y, Elstrott J, Ritter AT, Müller S, Nickles D. et al. Coexpression of inhibitory receptors enriches for activated and functional CD8+ T cells in murine syngeneic tumor models. Cancer Immunol Res. 2019;7(6):963–976. doi: 10.1158/2326-6066.CIR-18-0750.
- Kurtulus S, Madi A, Escobar G, Klapholz M, Nyman J, Christian E, Pawlak M, Dionne D, Xia J, Rozenblatt-Rosen O et al. Checkpoint blockade immunotherapy induces dynamic changes in PD-1-CD8 + tumor-infiltrating T cells. Immunity. 2019;50:181–194.e6. doi: 10.1016/j.immuni.2018.11.014.
- Gubin MM, Esaulova E, Ward JP, Malkova ON, Runci D, Wong P, Noguchi T, Arthur CD, Meng W, Alspach E. et al. High-dimensional analysis delineates myeloid and lymphoid compartment remodeling during successful immune-checkpoint cancer therapy. Cell. Cell Press. 2018;175 (4):1014–1030.e19. doi: 10.1016/J.CELL.2018.09.030.
- Sade-Feldman M, Yizhak K, Bjorgaard SL, Ray JP, de Boer CG, Jenkins RW, Lieb DJ, Chen JH, Frederick DT, Barzily-Rokni M. et al. Defining T cell states associated with response to checkpoint immunotherapy in melanoma. Cell. 2018;175(4):998–1013.e20. doi: 10.1016/j.cell.2018.10.038.
- Rue-Albrecht K, Marini F, Soneson C, Lun ATL. iSEE: interactive summarized experiment explorer. F1000Research. 2018;7:741. doi: 10.12688/f1000research.14966.1.
- Alfei F, Kanev K, Hofmann M, Wu M, Ghoneim HE, Roelli P, Utzschneider DT, von Hoesslin M, Cullen JG, Fan Y. et al. TOX reinforces the phenotype and longevity of exhausted T cells in chronic viral infection. Nature. 2019;571:265–269. doi: 10.1038/s41586-019-1326-9
- Khan O, Giles JR, McDonald S, Manne S, Ngiow SF, Patel KP, Werner MT, Huang AC, Alexander KA, Wu JE. et al. TOX transcriptionally and epigenetically programs CD8+ T cell exhaustion Nature. 2019;571:211–218. doi: 10.1038/s41586-019-1325-x.
- Yao C, Sun H-W, Lacey NE, Ji Y, Moseman EA, Shih H-Y, Heuston EF, Kirby M, Anderson S, Cheng J. et al. Single-cell RNA-seq reveals TOX as a key regulator of CD8+ T cell persistence in chronic infection. Nat Immunol. Nature Publishing Group. 2019;20(7):890–901. doi: 10.1038/s41590-019-0403-4.
- Haas Q, Boligan KF, Jandus C, Schneider C, Simillion C, Stanczak MA, Haubitz M, Seyed Jafari SM, Zippelius A, Baerlocher GM et al. Siglec-9 regulates an effector memory CD8 + T-cell subset that congregates in the melanoma tumor microenvironment. Cancer Immunol Res. American Association for Cancer Research. 2019;7(5):707–718. doi: 10.1158/2326-6066.CIR-18-0505.
- Zhang L, Yu X, Zheng L, Zhang Y, Li Y, Fang Q, Gao R, Kang B, Zhang Q, Huang JY et al. Lineage tracking reveals dynamic relationships of T cells in colorectal cancer. Nature. Nature Publishing Group. 2018;564(7735):268–272. doi: 10.1038/s41586-018-0694-x.
- Utzschneider DT, Alfei F, Roelli P, Barras D, Chennupati V, Darbre S, Delorenzi M, Pinschewer DD, Zehn D. High antigen levels induce an exhausted phenotype in a chronic infection without impairing T cell expansion and survival. J Exp Med. The Rockefeller University Press. 2016;213(9):1819–1834. doi: 10.1084/jem.20150598.
- Cerwenka A, Reome JB, Swain SL, Dutton RW, Carter LL. In vivo persistence of CD8 polarized T cell subsets producing type 1 or type 2 cytokines. J Immunol. 1998;161:97–105.
- Pihlgren M, Dubois PM, Tomkowiak M, Sjögren T, Marvel J Resting memory CD8+ T cells are hyperreactive to antigenic challenge in vitro. J Exp Med. 1996;184:2141–2152. doi: 10.1084/jem.184.6.2141.
- Walunas TL, Bruce DS, Dustin L, Loh DY, Bluestone JA. Ly-6C is a marker of memory CD8+ T cells. J Immunol (Baltimore, Md. : 1950). American Association of Immunologists. 1995;155(4):1873–1883. [accessed 2019 Aug 6]. http://www.ncbi.nlm.nih.gov/pubmed/7543536.
- Groom JR, Luster AD CXCR3 ligands: redundant, collaborative and antagonistic functions. Immunol Cell Biol. NIH Public Access. 2011;89(2):207–215. doi: 10.1038/icb.2010.158.
- Thompson ED, Enriquez HL, Fu Y-X, Engelhard VH. Tumor masses support naive T cell infiltration, activation, and differentiation into effectors. J Exp Med. 2010;207(8):1791–1804. doi: 10.1084/jem.20092454.
- Weinberger J, Jimenez-Heredia R, Schaller S, Suessner S, Sunzenauer J, Reindl-Schwaighofer R, Weiss R, Winkler S, Gabriel C, Danzer M. et al. Immune repertoire profiling reveals that clonally expanded B and T cells infiltrating diseased human kidneys can also be tracked in blood. PLoS One. 2015;10:e0143125. doi: 10.1371/journal.pone.0143125.
- Curran MA, Montalvo W, Yagita H, Allison JP. PD-1 and CTLA-4 combination blockade expands infiltrating T cells and reduces regulatory T and myeloid cells within B16 melanoma tumors. Proc Natl Acad Sci U S A. National Academy of Sciences. 2010;107(9):4275–4280. doi: 10.1073/pnas.0915174107.
- Gide TN, Quek C, Menzies AM, Tasker AT, Shang P, Holst J, Madore J, Lim SY, Velickovic R, Wongchenko M. et al. Distinct immune cell populations define response to anti-PD-1 monotherapy and anti-PD-1/anti-CTLA-4 combined therapy. Cancer Cell. Cell Press. 2019;35(2):238–255.e6. doi: 10.1016/J.CCELL.2019.01.003.
- Wei SC, Levine JH, Cogdill AP, Zhao Y, Anang NAAS, Andrews MC, Sharma P, Wang J, Wargo JA, Pe’er D et al. Distinct cellular mechanisms underlie anti-CTLA-4 and anti-PD-1 checkpoint blockade’, Cell. Cell Press. 2017;170 (6):1120–1133.e17. doi: 10.1016/J.CELL.2017.07.024.
- Guo X, Zhang Y, Zheng L, Zheng C, Song J, Zhang Q, Kang B, Liu Z, Jin L, Xing R. et al. Global characterization of T cells in non-small-cell lung cancer by single-cell sequencing. Nat Med. 2018;24(7):978–985. doi: 10.1038/s41591-018-0045-3.
- Jerby-Arnon L, Shah P, Cuoco MS, Rodman C, Su M-J, Melms JC, Leeson R, Kanodia A, Mei S, Lin J-R. et al. A cancer cell program promotes T cell exclusion and resistance to checkpoint blockade. Cell. Cell Press. 2018;175(4):984–997.e24. doi: 10.1016/J.CELL.2018.09.006.
- Kang B, Zheng C, Zheng L, Yoo JK, Guo H, Zhang Y, Guo X, Kang B, Hu R, Huang JY, et al. Landscape of infiltrating T cells in liver cancer revealed by single-cell sequencing. Cell. 2017;169(7):1342–1356.e16. doi: 10.1016/j.cell.2017.05.035.
- Brummelman J, Mazza EMC, Alvisi G, Colombo FS, Grilli A, Mikulak J, Mavilio D, Alloisio M, Ferrari F, Lopci E. et al. High-dimensional single cell analysis identifies stem-like cytotoxic CD8+ T cells infiltrating human tumors. J Exp Med. Rockefeller University Press. 2018;215(10):2520–2535. doi: 10.1084/jem.20180684.
- Scheper W, Kelderman S, Fanchi LF, Linnemann C, Bendle G, de Rooij MAJ, Hirt C, Mezzadra R, Slagter M, Dijkstra K. et al. Low and variable tumor reactivity of the intratumoral TCR repertoire in human cancers. Nat Med. 2019;25(1):89–94. doi: 10.1038/s41591-018-0266-5.
- Simoni Y, Becht E, Fehlings M, Loh CY, Koo S-L, Teng KWW, Yeong JPS, Nahar R, Zhang T, Kared H. et al. Bystander CD8+ T cells are abundant and phenotypically distinct in human tumour infiltrates. Nat. Nature Publishing Group. 2018;557(7706):575–579. doi: 10.1038/s41586-018-0130-2.
- Martínez-Usatorre A, Donda A, Zehn D, Romero P. PD-1 blockade unleashes effector potential of both high- and low-affinity tumor-infiltrating T cells. J Immunol. 2018;201:792–803. doi: 10.4049/jimmunol.1701644.
- Blank CU, Haining WN, Held W, Hogan PG, Kallies A, Lugli E, Lynn RC, Philip M, Rao A, Restifo NP, et al. Defining “T cell exhaustion”. Nat Rev Immunol. Nature Publishing Group. 2019:1–10. doi: 10.1038/s41577-019-0221-9.
- Lee PY, Wang J-X, Parisini E, Dascher CC, Nigrovic PA. Ly6 family proteins in neutrophil biology. J Leukoc Biol. John Wiley & Sons, Ltd. 2013;94(4):585–594. doi: 10.1189/jlb.0113014.
- Piranlioglu R, Lee E, Ouzounova M, Bollag RJ, Vinyard AH, Arbab AS, Marasco D, Guzel M, Cowell JK, Thangaraju M et al. Primary tumor-induced immunity eradicates disseminated tumor cells in syngeneic mouse model. Nat Commun. Nature Publishing Group. 2019;10(1):1430. doi: 10.1038/s41467-019-09015-1.
- Chow MT, Ozga AJ, Servis RL, Frederick DT, Lo JA, Fisher DE, Freeman GJ, Boland GM, Luster AD. Intratumoral activity of the CXCR3 chemokine system is required for the efficacy of anti-PD-1 therapy. Immunity. Elsevier. 2019. doi: 10.1016/j.immuni.2019.04.010.
- Corgnac S, Boutet M, Kfoury M, Naltet C, Mami-Chouaib F. The emerging role of CD8+ tissue resident memory T (TRM) cells in antitumor immunity: a unique functional contribution of the CD103 integrin. Front Immunol. Frontiers Media SA. 2018;9:1904. doi: 10.3389/fimmu.2018.01904.
- Denucci CC, Mitchell JS, Shimizu Y Integrin function in T-cell homing to lymphoid and nonlymphoid sites: getting there and staying there. Crit Rev Immunol. NIH Public Access. 2009;29(2):87–109. [accessed 2019 Oct 8]. http://www.ncbi.nlm.nih.gov/pubmed/19496742.
- Yost KE, Satpathy AT, Wells DK, Qi Y, Wang C, Kageyama R, McNamara KL, Granja JM, Sarin KY, Brown RA, et al. Clonal replacement of tumor-specific T cells following PD-1 blockade. Nat Med. Nature Publishing Group. 2019:1–9. doi: 10.1038/s41591-019-0522-3