
ABSTRACT
Immune checkpoint proteins, such as PD-L1 and PD-1, are important in several cancers; however, their role in osteosarcoma (OSA) and soft tissue sarcoma (STS) remains unclear. Our aims were to determine whether subsets of OSA/STS harbor tumor-infiltrating lymphocytes (TILs) and express PD-L1, and how PD-L1 expression is related to clinical outcome. Tissue sections of 25 cases each of untreated undifferentiated pleomorphic sarcoma (UPS), myxofibrosarcoma (MFS), liposarcoma (LPS) and 24 of leiomyosarcoma (LMS) were subjected to immunohistochemistry (IHC) for immune cells, PD-L1 and PD-1. RT-qPCR was utilized to quantify levels of PD-L1 mRNA from 33 UPS, 57 MFS and 79 OSA primary-untreated specimens. PD-L1 mRNA levels were tested for their correlation with overall survival in patients presenting without metastases. Transcriptome analysis evaluated biological pathway differences between high and low PD-L1 expressers. A subset of UPS and MFS contained TILs and expressed PD-L1 and PD-1; LMS and LPS did not. PD-L1 levels by IHC and RT-qPCR were positively correlated. PD-L1 over-expression was associated with better survival for UPS and OSA, but not MFS. The Th1 pathway was significantly activated in UPS with high levels of PD-L1 and improved survival. Some sarcoma subtypes harbor TILs and express PD-L1. Patients with UPS and OSA with high levels of PD-L1 had better overall survival than those with low expression levels. Important biological pathways distinguish PD-L1 high and low groups. The stratification of patients with OSA/STS with respect to potential immune therapies may be improved through investigation of the expression of immune cells and checkpoint proteins.
Introduction
Sarcomas are rare tumors with over 60 different subtypes making diagnosis and treatment challenging. Both the rarity and heterogeneity of soft-tissue sarcomas (STS) and osteosarcoma (OSA) make the search for novel biomarkers and effective treatments essential.
Immune checkpoint therapy is a promising new treatment option that leverages the immune system’s regulatory pathways to enhance antitumor immune responses. Blockade of the cell surface receptor ‘programmed death 1 (PD-1)’ and its ligand ‘programmed death ligand 1 (PD-L1)’ is an integral approach to immune checkpoint therapy based on encouraging response rates seen in patients with certain cancers.Citation1–Citation3
PD-1 plays a crucial role in the attenuation of cytotoxic T-cell response in the immune system.Citation4 PD-L1, which can be expressed on hematopoietic and non-hematopoietic cells after stimulation from inflammatory molecules and cytokines,Citation5 has a prominent role in regulating PD-1 activityCitation4,Citation6 and maintaining immune homeostasis.Citation7 Homeostatic imbalances in cancers often lead to a pro-inflammatory and angiogenic microenvironment.Citation8 Tumor-infiltrating lymphocytes (TILs) within the tumor microenvironment have been utilized as effective prognostic and predictive markers for several cancers.Citation9,Citation10 Research into how the PD-1/PD-L1 pathway affects TIL density and immune cell composition in sarcoma may reveal potential biomarkers for clinical benefit.
PD-L1/PD-1 has been shown to be up-regulated in some solid tumors based on immunohistochemistry (IHC) to detect PD-L1 protein expression on tumor cells and PD-1 on immune cells. Over-expression of PD-L1 in some cancers has been shown to be significantly associated with better response to PD-1/PD-L1 blockade;Citation11–Citation13 however, other studies found the clinical efficacy of antibodies to PD-1/PD-L1 to be independent of PD-L1 status.Citation14,Citation15 The prognostic value of PD-1/PD-L1 expression in STS is unclear. PD-L1 mRNA expression was shown to differ among STS subtypesCitation16-Citation18 and to be a poor prognostic indicator.Citation16 PD-L1 positivity detected by IHC on tissue microarrays (TMAs) from formalin-fixed paraffin-embedded (FFPE) tissues predicted favorable survival,Citation19 but was found to be a negative prognostic factor in another study.Citation9 Using whole FFPE tissue sections, PD-L1 was not associated with clinical features of STSCitation20 but correlated with worse clinical characteristics in OSA.Citation21,Citation22
The discrepancies in sarcoma studies of PD-1/PD-L1 expression may be due to differences in method of detection (mRNA versus IHC), lack of a gold standard for measurement of expression, utilization of different antibodies, and use of TMAs versus whole tissue sections. In addition, differences in number of cases of individual subtypes, inclusion of tissues collected before or after treatment, and tumor heterogeneity may have contributed to the varying results.
We hypothesized that there may be specific subtypes of sarcomas that contain TILs but these may be overlooked in a large heterogeneous group of STS. Here, we focused on four common STS subtypes: undifferentiated pleomorphic sarcoma (UPS), myxofibrosarcoma (MFS), liposarcoma (LPS), and leiomyosarcoma (LMS) and characterized the immune cells by IHC on whole FFPE tissue sections. We complemented this by examining the expression of PD-L1 in STS and OSA and determined the relationship of expression with clinical characteristics and outcome. Furthermore, we applied Ingenuity Pathway Analysis to identify molecular differences between tumors with high and low levels of PD-L1 expression.
Materials and methods
Patients and tissue samples
Cases identified as liposarcoma (LPS), leiomyosarcoma (LMS), myxofibrosarcoma (MFS), undifferentiated pleomorphic sarcoma (UPS) and osteosarcoma (OSA) were selected from a registry of patients who underwent surgical management of an extremity sarcoma. Eligible patients provided a signed consent form before study entry, as approved by the institution’s Research Ethics Board. Histologic slides/blocks were retrieved from the Department of Pathology and Laboratory Medicine. Cases with neither slides nor paraffin blocks available were excluded from further analysis. Pathology re-review of each case was conducted by a dedicated sarcoma pathologist (BCD). Overall Survival (OS) was measured from date of tumor resection until last follow-up or death. As shown in , 25 cases of LPS, 24 LMS, 57 MFS, 33 UPS and 87 OSA were included in this study. At diagnosis, 193 of the cases were non-metastatic including 50 MFS, 29 UPS, 70 OSA, 24 LPS, and 20 LMS; characteristics of the non-metastatic MFS, UPS and OSA cohorts for which we had complete clinical data and follow up are given in and for LPS and LMS cohorts in Supplementary Table 1. The other 33 cases were patients who presented with metastatic disease. The assays performed on the various tumor subtypes are given in .
Table 1. Number of sarcomas analyzed by assay method
Table 2. Characteristics of UPS, MFS and OSA patient cohorts presenting with non-metastatic disease
In each of the 4 histologic categories of STS, 25 cases underwent IHC using standard methods on a DAKO Autostainer Link 48 for: T-cell markers CD3 (clone: F7.2.38; Dako), CD4 (clone: SP35; Roche), and CD8 (clone: C8/144B; Dako), B cell marker CD20 (clone: L26; Dako) and on Ventana Benchmark ULTRA for PD-1 (clone: NAT105; Roche), and PD-L1 (clone: SP263; Roche). Ten recent cases of OSA were stained for PD-L1. One OSA and 1 LMS case each were excluded due to excessive tissue lifting from slides. UPS and MFS cases were also stained for myeloid lineage markers CD68 (clone: PG-M1; Dako) and CD163 (clone: MRQ-29; Cell Marque). Stained slides were quantified by an investigator (BL) blinded to outcome data. Ten percent of slides were randomly selected for independent quantification (BCD) to ensure concordance in interpretation. Immune cells were quantified using methods described by Kakavand et al.Citation23 Briefly, immune marker staining within the tumor was quantified in 4 representative high power fields (HPFs) (40x magnification; field diameter = 0.55 mm). TIL staining was scored semi-quantitatively using a 4-tiered scale: 0 (no lymphocytes); 1 (1–10 per HPF); 2 (11–50 per HPF); 3 (51–100 per HPF); 4 (>100 per HPF). Scoring of CD68 and CD163 also included a score of 5 for >200 per HPF. Attention was given to avoid quantifying CD4+ histiocytes and lymphocytic aggregates.
We attempted to perform IHC for PD-L1 from FFPE OSA cases that had been processed years ago using an older protocol that included a decalcification step. Because of technical issues, we were not able to obtain reliable IHC staining using these older bone tumor cases. To address this issue, we selected 10 OSA cases processed using a more recent pathology department protocol and were able to obtain PD-L1 IHC staining for 9 of the 10 cases.
For gene expression and/or sequencing analyses, 177 of the cases (57 MFS, 33 UPS, and 87 OSA) were identified based on having sufficient radiation- and chemo-naïve frozen tumor tissue obtained at time of surgical biopsy or resection. A portion of each frozen tumor was pulverized, resuspended in lysis solution, and subjected to DNA and RNA extraction.
Real-time quantitative RT-PCR (RT-qPCR), sequencing and transcriptome analysis
RT-qPCR of STS and OSA cDNA was performed on 169 cases () in an Applied Biosystems 7900HT Sequence Detection System. 200 ng of total RNA was reverse transcribed, and cDNA added to Power SYBR Green PCR Master Mix (Applied Biosystems), forward and reverse primers (Supplementary Table 2) for both PD-L1 (30uM) and control gene, signal-transducing adaptor molecule 2 (STAM2) (30uM). Pooled cancer cell line cDNA was used to construct standard curves for PD-L1 and STAM2. PD-L1 expression was quantified as a ratio relative to STAM2. PD-L1 level was assigned using the median expression of PD-L1 among the UPS, MFS and OSA samples as the bifurcating value.
RNA-seq for UPS and MFS was performed by The Center for Applied Genomics (TCAG), Hospital for Sick Children, Toronto from 400 ng of total RNA using Illumina HiSeq 2500. RNA-seq reads were aligned to the hg19 human reference genome using STAR aligner to create BAM files for each sample. Gene expression for cases from our institution that had been sequenced as part of the National Cancer Institute’s “Therapeutically Applicable Research to Generate Effective Treatments” (TARGET) Osteosarcoma initiative (TARGET OSA) was accessed through the TARGET data matrix (ftp://caftpd.nci.nih.gov/pub/OCG-DCC/TARGET/OS/mRNA-seq/L3/expression/NCI-Meltzer). Expression of PD-L1 and STAM2 from RNA-seq for the STS and OSA cases was obtained using the Cufflinks program from the BAM files.
To identify genes and pathways differentially expressed between PD-L1-high and PD-L1-low tumors, RNA-seq data from 22 UPS, 17 MFS and 17 OSA were used and log2 (fold-change) calculations were performed using DESeq2. For OSA, raw RNA-seq data were obtained from the Sequence Read Archive at the National Center for Biotechnology Information (dbGAP, http://www.ncbi.nlm.nih.gov/gap), accession number phs000218. Read counts for each gene were collected using HT-Seq and GENCODE release 19 from the BAM files. Genes were removed if expression values were absent in >50% of cases and DESeq2 was used to transform the normalized read count by log 2. Differentially expressed genes were considered statistically significant if the multiple testing adjusted p-values (FDR) were <0.05. Ingenuity Pathway Analysis (IPA) was used to interrogate the gene expression results. Ontology analysis was performed by the GO Term Finder developed at the Lewis-Sigler Institute for Integrative Genomics Princeton (https://go.princeton.edu/cgi-bin/GOTermFinder).
DNA sequencing
Whole-exome (WXS) or whole-genome sequencing (WGS) was performed on 22 UPS and 17 MFS primary tumors (Seto et al., in preparation). WGS and WXS were performed at TCAG to an average depth of ~32X and 74X, respectively, on the HiSeq2000 instrument. The MuTect2 algorithm was used to identify somatic single nucleotide variants, small insertions and deletions; annotation of variants was performed using ANNOVAR using hg19 supported databases.
Statistical analysis of overall survival (OS)
Log2 transformed PD-L1 mRNA expression levels by RT-PCR were dichotomized at the median of the UPS, MFS, OSA non-metastatic groups (n = 134). The additional 10 recent OSA cases were not included due to insufficient clinical follow-up time. Fisher’s exact test/Chi-square test or the Student’s t-tests were used to analyze associations between PD-L1 mRNA expression status (high versus low) and clinical-pathologic factors. All tests were two-sided. Clinical-pathologic variables used represent traditional and/or known sarcoma prognostic factors. Analyses for associations between OS and PD-L1 status for UPS, MFS and OSA were conducted using the method of Kaplan–Meier and tested statistically by the log-rank test (statistical significance: p-value <0.05). To evaluate the independent prognostic contribution of PD-L1, Cox multivariate survival analysis was performed controlling for known clinical-pathologic factors; therefore we limited statistical inference to the primary PD-L1 factor without multiple testing adjustment for other factors. Firth bias correction for inference in sparse data was applied in UPS, MFS, and OSA (including penalized hazard ratio (HR) estimates, 95% profile CI for HR, penalized likelihood ratio test (LRT) p-value). Statistical analyses of associations were performed using SAS 9.1 software (SAS Institute, Inc.). Survival curves were plotted using R statistical software, version 2.15.0 (http://www.r-project.org/).
Results
Detection of tumor-infiltrating immune cells and PD-1 and PD-L1 expressing cells
IHC for immune markers and PD-1 and PD-L1 was performed on 99 STS cases; examples of IHC for PD-L1 are shown in and for immune markers in Supplementary Figure 1. LPS and LMS contained few if any TILs and either lacked expression of PD-L1 (LPS) or expressed very little PD-L1 (LMS) on tumor cells. In contrast, a subset of UPS and MFS contained TILs and expressed both immune PD-1 and immune and tumor PD-L1 based on semi-quantitative IHC scoring (). All UPS and MFS stained positive for macrophage IHC markers CD68 and CD 163 scoring between 2 and 5.
Figure 1. IHC of PD-L1; (a) UPS case with high PD-L1, (b) UPS case with low PD-L1, (c) MFS case with high PD-L1, (d) MFS case with low PD-L1, (e) OSA case with high PD-L1 and (f) OSA case with low PD-L1. All immunohistochemical-stained images were taken at the equivalent of x20 magnification
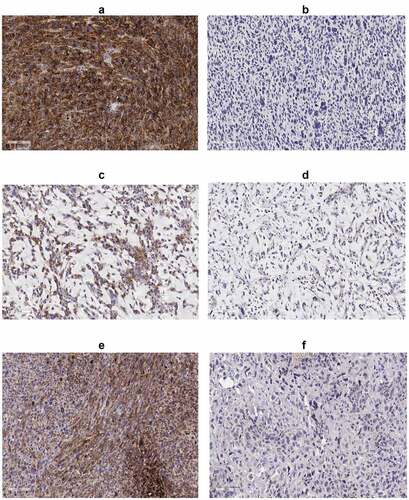
Figure 2. Distribution of IHC scoring in soft-tissue sarcomas by dot plots: (a) PD-L1 tumor, PD-L1 immune, PD-1 immune in 25 UPS, 25 MFS, 25 LPS, 24 LMS; (b) CD3, CD8, CD4, CD20 in 25 UPS, 25 MFS, 25 LPS, 24 LMS; (c) CD68, CD163 in 25 UPS, 25 MFS; (d) PD-L1 tumor, PD-L1 immune in 9 osteosarcomas
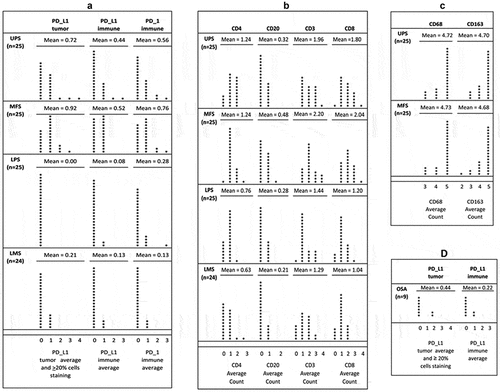
The percentage of cells staining for PD-L1 and PD-1 is shown in Supplementary Table 3. We considered tumors to be positive for PD-L1 by IHC if the average of 4 HPFs scored ≥2 and ≥20% of the tumor cells expressed PD-L1 (). The subset of tumors that was positive for PD-L1 by IHC included 4 of the 25 MFS, 3 of 25 UPS and 2 of 9 OSA and we therefore focused further molecular analyses on these sarcoma subtypes.
Correlation of immune cell markers
The strength of relationships between the immune cell markers and PD-1 and PD-L1 expression level by semi-quantitative IHC was assessed using Spearman correlation coefficients; see for combined soft-tissue subtypes. Subtype-specific pairwise correlations (Supplementary Table 4) indicated generally consistent associations for the immune cell markers across all subtypes, and for the PDL-1 and PD-1 expression levels in UPS and MFS. CD3 was highly positively correlated with CD8, and positively correlated with all other markers except CD20. CD8 was also correlated with CD4. CD68 and CD163 were highly positively correlated. CD3, CD8 and CD4 were similarly positively correlated with PD-L1 tumor, immune and PD-1 immune. Immune PD-L1 was positively correlated with PD-L1 tumor and PD-1 immune levels.
Table 3. Spearman correlations for immunohistochemical staining across STS subtypes
PD-L1 mRNA expression in STS and OSA
Since evaluating PD-L1 and PD-1 expression by IHC is particularly challenging for bone tumors such as OSA (due to decalcification prior to histologic processing), we investigated whether RT-qPCR could be used to determine PD-L1 levels in OSA as well as in UPS and MFS. We found that PD-L1 levels quantified by RT-qPCR varied from almost undetectable to high (). In OSA for example, a 50-fold difference was observed between the highest and lowest quartile of PD-L1 expression. We did not find any clinical characteristics that differed between the cases with the highest and lowest level of PD-L1 for each subtype (Supplementary Table 5).
Figure 3. Expression of PD-L1 relative to STAM 2 in: (a) 33 UPS, (b) 57 MFS, (c) 79 osteosarcomas. RT-qPCR was performed in duplicate and the average of two independent experiments (N = 2) was utilized to calculate standard deviation and relative PD-L1 values
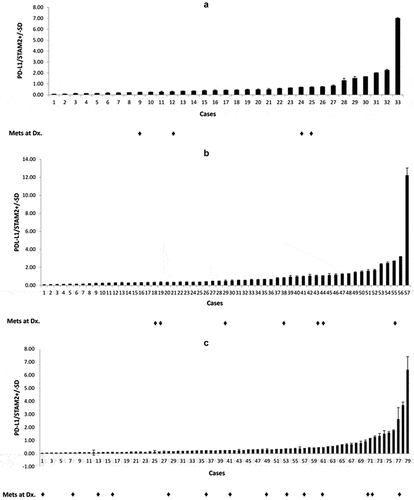
To investigate whether metastasis status at presentation was related to PD-L1 expression we compared PD-L1 expression in cases that were metastatic at presentation versus those that were non-metastatic at presentation, as indicated in . We did not observe differences in expression between the cases that were non-metastatic versus those that were metastatic at diagnosis in any of the three subgroups (UPS, MFS and OSA) nor for the groups combined (p = .918; Supplementary Table 6).
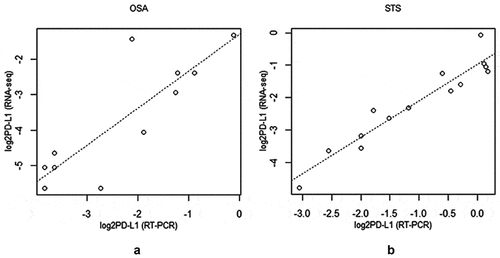
We also compared relative PD-L1 expression from RNA-seq data and RT-qPCR for 11 OSA and 14 STS for which we had data from both methods. Significant, positive Spearman correlations of PD-L1 expression were detected between the RT-qPCR and RNA-seq for both OSA (N = 11, rho = 0.821, p-value = .002) and soft-tissue sarcoma (N = 14, rho = 0.937, p-value = 7.7e-07) ().
Figure 4. Scatterplot of log2 RNAseq versus log2RT-qPCR generated PD-L1 values for (a) osteosarcoma (N = 11, rho = 0.821, p-value = 0.002) and (b) soft-tissue sarcoma (N = 14, rho = 0.937, p-value = 7.7e-07)
To determine whether there was a relationship between the levels of PD-L1 mRNA by RT-qPCR and protein by IHC, we compared PD-L1 levels in 20 MFS, 22 UPS and 9 OSA tumors for which we had both measures. RT-qPCR data were log2 transformed and a t-test was applied to compare tumor groups according to IHC staining status. Mean RNA expression levels were higher in the MFS and UPS groups with any positive IHC protein staining compared to the groups with no IHC staining (p = .015). This same correlation was also observed for the nine recent OSA cases which were available for assessment (p = .0005). ROC curve analysis demonstrated strong potential for use of mRNA level to predict the presence/absence of PDL-1 at the protein level in sarcoma (Supplementary Figure 2). For example, use of an optimal threshold obtained in our dataset correctly classified 100% of 8 IHC+ samples and 93% of 43 IHC- samples. Given the modest number of IHC+ samples in our study, we recommend further validation studies.
Association between PD-L1 expression and clinico-pathologic parameters and outcome
The association between PD-L1 RNA levels with clinical factors was determined for the 29 UPS, 50 MFS and 55 OSA cases that were non-metastatic at diagnosis and with sufficient clinical follow-up time. We did not observe a statistically significant association between any clinical-pathological characteristics and PD-L1 level in UPS (), OSA () or MFS (data not shown).
Table 4. Association between PD-L1 RNA level and clinical parameters in 29 UPS patients
Table 5. Association between PD-L1 RNA level and clinical parameters in 55 OSA patients
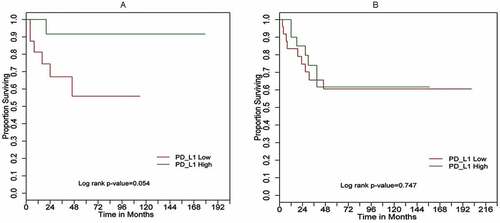
For 29 non-metastatic UPS patients, OS tended to be better in the group with high PD-L1 expression compared to those with low PD-L1 expression (: Log-rank p = .054; and : univariate Cox model HR = 4.47, 95%CI = (0.93,43.1), P(LRT) = 0.0622). In multivariate analysis including established prognostic factors, the PD-L1 HR increased to 6.27 and the p-value decreased to 0.0352 ().
Table 6. Overall survival (OS) analysis by Cox proportional hazards model# for UPS patients (n = 29)
Table 7. Overall survival (OS) analysis by Cox proportional Hazards Model# for MFS patients (n = 50)
Figure 5. Kaplan–Meier overall survival (OS) curves for (a) 29 UPS cases; (b) 50 MFS cases based on PD-L1 expression high (green) versus low (red) determined by RT-qPCR
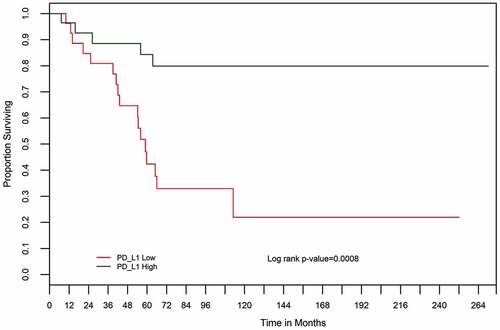
Patients with localized OSA (n = 55) at diagnosis also had significantly better survival if their tumors expressed high levels of PD-L1 (: Log-rank p = .001). In both univariate and multivariate Cox model analysis of cases with complete data (n = 45), low PD-L1 expression was strongly associated with worse prognosis (: univariate HR = 3.10, 95%CI = (1.21, 9.19), P(LRT) = 0.0173; multivariate HR = 2.71, 95%CI = (1.03, 8.19), P(LRT) = 0.0192). Similar findings of an independent PD-L1 prognostic association (HR = 3.75, 95%CI = (1.44, 11.3), P(LRT) = 0.0026) were obtained in multivariate analyses with the imputation of incomplete data (n = 55, see Supplementary Table 7).
Table 8. Overall survival analysis by Cox proportional Hazards model# for 45 osteosarcoma patients
Figure 6. Kaplan–Meier overall survival (OS) curves for 55 osteosarcoma cases based on PD-L1 expression high (green) versus low (red) determined by RT-qPCR
In contrast, high PD-L1 expression was not significantly associated with overall survival in 50 MFS patients (, Log-rank p-value = 0.747; univariate HR = 1.16, 95%CI = (0.44, 3.13), P(LRT) = 0.7638; ).
Comparison of PD-L1 high vs low tumors
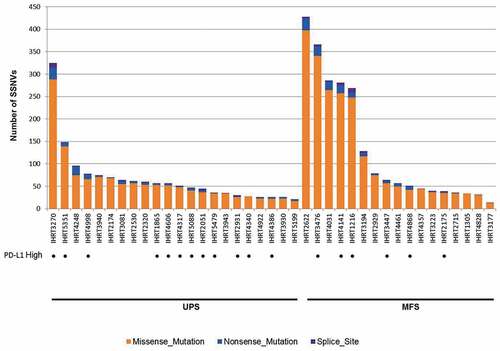
To determine whether differences in PD-L1 expression levels were related to non-silent mutational load that could produce neoantigens, we examined somatic variants by WGS and/or WXS in 22 UPS and 17 MFS for which we had DNA sequencing data and PD-L1 expression data. UPS and MFS tumors exhibited similar levels of mutational load, with no obvious relationship to PD-L1 expression for either subtype ().
Figure 7. Distribution of the number of non-silent SSNVs (orange – missense variants; blue – nonsense variants; purple – splice site variants) identified in the coding regions of the UPS and MFS tumor genomes analyzed by DNA next-generation sequencing. The UPS and MFS tumors with high PD-L1 expression are indicated
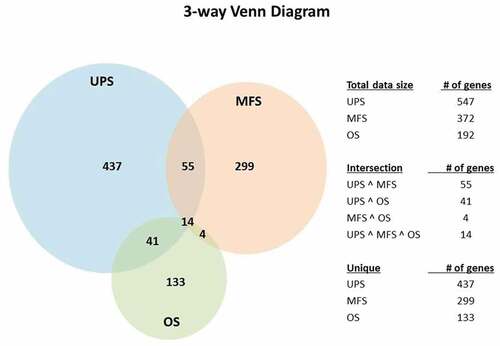
Although UPS and MFS exhibited TILs and expression of PD-1 and PD-L1, high PD-L1 mRNA levels correlated significantly with improved survival in UPS, but not in MFS. This same correlation between high PD-L1 expression and survival was also true in OSA. To understand this difference and potential clinical relevance, we investigated the genes/pathways that distinguished the high versus low PD-L1 expression groups from 22 UPS and 17 MFS. In addition, 17 OSA tumors for which we had RNA-seq data were grouped into low versus high PD-L1 expression for differential gene/pathway analysis. After multiple testing correction (Benjamin-Hochberg method) was applied, there were 547, 372 and 192 genes in the UPS, MFS and OSA groups, respectively (p < .001, FDR <0.05), which distinguished tumors with high vs low PD-L1 expression. Of these 437, 299 and 133 were unique to UPS, MFS and OSA, respectively. As shown in the Venn diagram (), 55 genes were shared between UPS and MFS, 41 were shared by UPS and OSA, and 14 (see Supplementary Table 8) were shared by all 3 sarcoma types.
Figure 8. Venn diagrams indicating differentially expressed genes comparing PD-L1 high versus PD-L1 low expression in UPS, MFS and OSA
In comparing STS subtypes UPS and MFS, there were 478 genes unique to UPS (i.e., not differentially expressed in MFS). A “core analysis” using IPA was applied to these 478 UPS unique genes to identify biological functions. The Th1 pathway was found to be one of the most significant pathways (z-score = 3.31, p-value 3.45E-08) (Supplementary Figure 3). The functions of genes associated with the Th1 pathway include immune cell development and activation, and inflammatory responses (Supplementary Table 9). We assayed Th1 pathway genes TBX21, STAT1 and CD40LG by RT-qPCR in UPS and MFS tumors and confirmed gene expression differences (data not shown). Complementary ontology analysis of the biological processes indicated the involvement of immune response and T-cell activation in PD-L1 high UPS cases (Supplementary Table 10A,B).
UPS and OSA tumors with high PD-L1 expression shared 41 unique genes including CD247, LAMP3 and a number of immunoglobulin genes (Supplementary Table 11). IPA core analysis of these 41 genes identified dendritic cell maturation (z-score = 2, p-value 2.83E-04), to be a significant pathway in both UPS and OS PD-L1 high cases.
Discussion
Immunotherapy is recognized as a promising novel treatment option and blockade of immune checkpoints has generated positive clinical responses in several malignancies. Studies evaluating the significance of TILs and PD-L1 in the sarcoma microenvironment have been increasing; however, results have been inconsistent.Citation7,Citation9,Citation16,Citation18-Citation20,Citation23 Our first objective was to determine whether certain subtypes of STS harbor significant TIL populations and express PD-L1, and we focused on four common subtypes (LPS, LMS, UPS and MFS) utilizing IHC on full-face sections. We found that a distinct subset of STS – specifically 14% of UPS and MFS – contained anti-tumoral TILs and exhibited positive PD-1 and PD-L1 protein expression, and determined that the presence of TILs was associated with expression of these immune checkpoint proteins. These results are in agreement with previous studies that showed PD-1 and PD-L1 expression to be increased during high levels of lymphocytic and macrophage activity.Citation5,Citation19 Other studies also reported that high PD-L1 mRNA expression in sarcomas was associated with higher expression of gene signatures relating to activated T cells.Citation21,Citation24 In the present study, we did not detect PD-L1 expression in LPS and only at very low levels in LMS. Other studies observed high expression in some LMS and liposarcomas (e.g., dedifferentiated subtype) on whole sectionsCitation18 or TMAs,Citation9 but reported that expression was lower than in UPS.Citation9,Citation18
The presence of TILs in cancers has been associated with the presence of neoantigens produced by tumors with high mutational loads (for review, please see ref. Citation25). DNA sequencing of UPS and MFS did not reveal differences in the number of somatic variants between tumors with high versus low PD-L1 expression. It is more likely to be the presence of tumor-specific neoantigens that we have not identified, not the simple number of variants, which play a role in the interaction of tumor and immune cells in sarcomas.
Since assessing PD-L1 expression via IHC is challenging we complemented IHC studies by evaluating mRNA expression by RT-qPCR and observed a positive association between the levels of PD-L1 protein and RNA expression. This indicates that mRNA expression can be used to measure PD-L1 expression as an alternative to IHC in sarcomas, and can be of benefit in studies that do not have access to full-face sections which may be more sensitive than TMAs for IHCCitation21,Citation26 particularly in OSA.
PD-L1 mRNA levels varied widely amongst the sarcomas and were not associated with clinical-pathological features. However, high PD-L1 levels did predict for improved overall survival in OSA and UPS, although not in MFS. Recent molecular analysis of The Cancer Genome Atlas (TCGA) data suggested that UPS and MFS may not be distinct clinically;Citation27 however, in this study, we identified differences in outcome related to PD-L1 expression. With further analysis and validation, this could become a favorable prognostic biomarker for UPS and OSA. Furthermore, our UPS data are consistent with the PD-L1 results using TMAsCitation19 for high-grade STS, as well as a recent Phase 2 study of Pembrolizumab (anti-PD-1 antibody) in advanced OSA/STS in which encouraging clinical results were reported for 10 UPS patients who demonstrated a 40% objective response rate.Citation28
Previous studies in various cancer types including sarcomas have reported conflicting results on the relationship between PD-L1 tumor expression and clinical outcome, however, studies of a variety of malignancies coincided with our finding that high PD-L1 expression was associated with significantly better survival.Citation11,Citation12,Citation29-Citation33 One explanation may lie in which cell types express PD-L1, and to what degree. We found that, although a proportion of UPS and MFS patients has tumors that contain TILs and express PD-L1, better survival was associated with high PD-L1 expression in UPS and OSA; we did not detect any association with survival in MFS.
We used transcriptome profiling to investigate potential pathway differences between UPS, MFS and OSA tumors with high PD-L1 expression. IPA analysis identified Th1 pathway activation in UPS, but not in MFS. Th1 cells are involved in tumor cell death by releasing cytokines that activate death receptors on the tumor cell surface.Citation34 A group of Th1 genes including TBX21, STAT1, lymphotoxin alpha and CD40LG are known to distinguish tumors with high (HEV) versus low endothelial venulesCitation35 and the presence of HEVs correlates with improved survival in a variety of cancers (for reviews, see refs. Citation36 and Citation37).
Ontology analysis of the biological processes of the 41 differentially expressed genes, including CD247, LAMP3 and a number of immunoglobulin genes in UPS and OSA (, Supplementary Table 11) indicated the involvement of an adaptive immune response and humoral immune response. LAMP3 has been shown to be highly expressed in dendritic cells during cell differentiation and maturation.Citation38 LAMP3 positive dendritic cells were found to be correlated with density of tumor HEVs, lymphocyte infiltration and favorable outcome in breast cancer.Citation39 Further characterization of the role of dendritic cells and LAMP3 will also be also important for the development of efficient therapeutic strategies in sarcoma tumors. These results require further study, but may suggest additional avenues for combined therapy for some sarcomas. PD-L1 expression in UPS is most likely part of an adaptive response to the ongoing inflammatory immune attack by TILsCitation15,Citation16 and may represent an effective anti-tumoral immune response leading to improved clinical outcomes.
Targeting macrophages together with PD-L1 is another possible avenue for combinatorial therapy for sarcomas that was raised by the results of this study. We identified high levels of macrophages in MFS and UPS, and macrophages have also been shown to be a common infiltrate in osteosarcoma.Citation40 Macrophage infiltration has been identified as a possible prognostic marker in some sarcomas, and macrophage blockade in sarcoma xenograft models has led to improved disease control.Citation40–Citation45 Since macrophages may play a role in immune-mediated resistance in sarcomas, further investigations into targeting both PD-L1 and macrophages are warranted.
Conclusion
Currently, clinical data on the efficacy of immune checkpoint inhibitors in the treatment of sarcoma are limited. There is a great need to develop biomarkers that can reliably distinguish the patients most likely to respond to PD-1/PD-L1 blockade, particularly in a heterogeneous group of malignancies like sarcoma. Therefore, our study aimed to further elucidate the potential significance of TILs and PD-L1 expression in revealing novel and clinically relevant differences with a focus on more common sarcoma subtypes. We found that a subset of patients with UPS and MFS exhibited high levels of PD-L1, PD-1 and TILs in their tumors, while patients with leiomyosarcoma and liposarcoma did not. The correlation observed between protein and mRNA expression of PD-L1 indicates that mRNA level can also be used to quantitate PD-L1 expression in sarcomas, particularly for bone tumors such as OSA. UPS and OSA patients, but not MFS patients, whose tumors had high PD-L1 expression, demonstrated better overall survival compared to those with low PD-L1 expression. PD-L1 expression and Th1 pathway activation were shown to be of potential importance in discriminating sarcomas with high vs low PD-L1 expression and better clinical outcome. These studies suggest that there may be individuals with specific sarcomas who would be good candidates to benefit from immunotherapies targeting PD-L1/PD-1 based on their tumor characteristics.
Disclosure of potential conflicts of interest
No potential conflicts of interest were disclosed.
Author contributions
J. S. Wunder and I. L. Andrulis: Conceptualization, funding acquisition, administration, resources, supervision, writing – original draft, review, and editing.
M. Lee and J. Nam: Investigation, writing – original draft, review and editing.
B. Y. Lau: Data curation, Investigation, writing – review and editing.
B. C. Dickson: Investigation, methodology, supervision, and writing – review and editing.
D. Pinnaduwage: Data, formal analysis, writing – original draft, review, and editing.
S. B. Bull: Formal analysis, writing – review and editing.
P. C. Ferguson: Resources, writing – review and editing.
A. Seto and N. Gokgoz: Data curation, investigation, and writing – review and editing.
Supplemental Material
Download ()Acknowledgments
We thank our colleagues in the Toronto Sarcoma Group, Drs. Grimer (Royal Orthopaedic Hospital), Healey (Memorial Sloan Kettering Cancer Center), Rock (Mayo Clinic) and Turcotte (Montreal General Hospital) for providing osteosarcomas, Anthony Griffin, Clinical Research Coordinator and Teresa Selander, Biospecimen Repository Coordinator.
Supplementary material
Supplemental data for this article can be accessed on the publisher’s website.
Additional information
Funding
References
- Brahmer JR, Tykodi SS, Chow LQ, Hwu WJ, Topalian SL, Hwu P, Drake CG, Camacho LH, Kauh J, Odunsi K, et al. Safety and activity of anti-PD-L1 antibody in patients with advanced cancer. N Engl J Med. 2012;366(26):2455–13. doi:10.1056/NEJMoa1200694.
- Robert C, Ribas A, Wolchok JD, Hodi FS, Hamid O, Kefford R, Weber JS, Joshua AM, Hwu W-J, Gangadhar TC, et al. Anti-programmed-death-receptor-1 treatment with pembrolizumab in ipilimumab-refractory advanced melanoma: a randomised dose-comparison cohort of a phase 1 trial. Lancet. 2014;384(9948):1109–1117. doi:10.1016/S0140-6736(14)60958-2.
- Topalian SL, Sznol M, McDermott DF, Kluger HM, Carvajal RD, Sharfman WH, Brahmer JR, Lawrence DP, Atkins MB, Powderly JD, et al. Survival, durable tumor remission, and long-term safety in patients with advanced melanoma receiving nivolumab. J Clin Oncol. 2014;32(10):1020–1030. doi:10.1200/JCO.2013.53.0105.
- Ohaegbulam KC, Assal A, Lazar-Molnar E, Yao Y, Zang X. Human cancer immunotherapy with antibodies to the PD-1 and PD-L1 pathway. Trends Mol Med. 2015;21(1):24–33. doi:10.1016/j.molmed.2014.10.009.
- He J, Hu Y, Hu M, Li B. Development of PD-1/PD-L1 pathway in tumor immune microenvironment and treatment for non-small cell lung cancer. Sci Rep. 2015;5:13110. doi:10.1038/srep13110.
- Latchman Y, Wood CR, Chernova T, Chaudhary D, Borde M, Chernova I, Iwai Y, Long AJ, Brown JA, Nunes R, et al. PD-L2 is a second ligand for PD-1 and inhibits T cell activation. Nat Immunol. 2001;2(3):261–268. doi:10.1038/85330.
- Keir ME, Butte MJ, Freeman GJ, Sharpe AH. PD-1 and its ligands in tolerance and immunity. Annu Rev Immunol. 2008;26:677–704. doi:10.1146/annurev.immunol.26.021607.090331.
- Gajewski TF, Schreiber H, Fu YX. Innate and adaptive immune cells in the tumor microenvironment. Nat Immunol. 2013;14(10):1014–1022. doi:10.1038/ni.2703.
- Kim JR, Moon YJ, Kwon KS, Bae JS, Wagle S, Kim KM, Park HS, Lee H, Moon WS, Chung MJ, et al. Tumor infiltrating PD1-positive lymphocytes and the expression of PD-L1 predict poor prognosis of soft tissue sarcomas. PLoS One. 2013;8(12):e82870. doi:10.1371/journal.pone.0082870.
- Sun S, Fei X, Mao Y, Wang X, Garfield DH, Huang O, Wang J, Yuan F, Sun L, Yu Q, et al. PD-1(+) immune cell infiltration inversely correlates with survival of operable breast cancer patients. Cancer Immunol Immunother. 2014;63(4):395–406. doi:10.1007/s00262-014-1519-x.
- Taube JM, Klein A, Brahmer JR, Xu H, Pan X, Kim JH, Chen L, Pardoll DM, Topalian SL, Anders RA. Association of PD-1, PD-1 ligands, and other features of the tumor immune microenvironment with response to anti-PD-1 therapy. Clin Cancer Res. 2014;20(19):5064–5074. doi:10.1158/1078-0432.CCR-13-3271.
- Topalian SL, Hodi FS, Brahmer JR, Gettinger SN, Smith DC, McDermott DF, Powderly JD, Carvajal RD, Sosman JA, Atkins MB, et al. Safety, activity, and immune correlates of anti-PD-1 antibody in cancer. N Engl J Med. 2012;366(26):2443–2454. doi:10.1056/NEJMoa1200690.
- Weber JS, D’Angelo SP, Minor D, Hodi FS, Gutzmer R, Neyns B, Hoeller C, Khushalani NI, Miller WH Jr., Lao CD, et al. Nivolumab versus chemotherapy in patients with advanced melanoma who progressed after anti-CTLA-4 treatment (CheckMate 037): a randomised, controlled, open-label, phase 3 trial. Lancet Oncol. 2015;16(4):375–384. doi:10.1016/S1470-2045(15)70076-8.
- Brahmer J, Reckamp KL, Baas P, Crino L, Eberhardt WE, Poddubskaya E, Antonia S, Pluzanski A, Vokes EE, Holgado E, et al. Nivolumab versus docetaxel in advanced squamous-cell non-small-cell lung cancer. N Engl J Med. 2015;373(2):123–135. doi:10.1056/NEJMoa1504627.
- Robert C, Long GV, Brady B, Dutriaux C, Maio M, Mortier L, Hassel JC, Rutkowski P, McNeil C, Kalinka-Warzocha E, et al. Nivolumab in previously untreated melanoma without BRAF mutation. N Engl J Med. 2015;372(4):320–330. doi:10.1056/NEJMoa1412082.
- Bertucci F, Finetti P, Perrot D, Leroux A, Collin F, Le Cesne A, Coindre JM, Blay JY, Birnbaum D, Mamessier E. PDL1 expression is a poor-prognosis factor in soft-tissue sarcomas. Oncoimmunology. 2017;6(3):e1278100. doi:10.1080/2162402X.2016.1278100.
- Budczies J, Mechtersheimer G, Denkert C, Klauschen F, Mughal SS, Chudasama P, Bockmayr M, Johrens K, Endris V, Lier A, et al. PD-L1 (CD274) copy number gain, expression, and immune cell infiltration as candidate predictors for response to immune checkpoint inhibitors in soft-tissue sarcoma. Oncoimmunology. 2017;6(3):e1279777. doi:10.1080/2162402X.2017.1279777.
- Pollack SM, He Q, Yearley JH, Emerson R, Vignali M, Zhang Y, Redman MW, Baker KK, Cooper S, Donahue B, et al. T-cell infiltration and clonality correlate with programmed cell death protein 1 and programmed death-ligand 1 expression in patients with soft tissue sarcomas. Cancer. 2017;123(17):3291–3304. doi:10.1002/cncr.v123.17.
- Boxberg M, Steiger K, Lenze U, Rechl H, von Eisenhart-rothe R, Wortler K, Weichert W, Langer R, Specht K. PD-L1 and PD-1 and characterization of tumor-infiltrating lymphocytes in high grade sarcomas of soft tissue - prognostic implications and rationale for immunotherapy. Oncoimmunology. 2018;7(3):e1389366. doi:10.1080/2162402X.2017.1389366.
- D’Angelo SP, Shoushtari AN, Agaram NP, Kuk D, Qin LX, Carvajal RD, Dickson MA, Gounder M, Keohan ML, Schwartz GK, et al. Prevalence of tumor-infiltrating lymphocytes and PD-L1 expression in the soft tissue sarcoma microenvironment. Hum Pathol. 2015;46(3):357–365. doi:10.1016/j.humpath.2014.11.001.
- Koirala P, Roth ME, Gill J, Piperdi S, Chinai JM, Geller DS, Hoang BH, Park A, Fremed MA, Zang X, et al. Immune infiltration and PD-L1 expression in the tumor microenvironment are prognostic in osteosarcoma. Sci Rep. 2016;6:30093. doi:10.1038/srep30093.
- Sundara YT, Kostine M, Cleven AH, Bovee JV, Schilham MW, Cleton-Jansen AM, Increased PD. L1 and T-cell infiltration in the presence of HLA class I expression in metastatic high-grade osteosarcoma: a rationale for T-cell-based immunotherapy. Cancer Immunol Immunother. 2017;66(1):119–128. doi:10.1007/s00262-016-1925-3.
- Kakavand H, Wilmott JS, Long GV, Scolyer RA. Targeted therapies and immune checkpoint inhibitors in the treatment of metastatic melanoma patients: a guide and update for pathologists. Pathology. 2016;48(2):194–202. doi:10.1016/j.pathol.2015.12.010.
- Sfanos KS, Bruno TC, Meeker AK, De Marzo AM, Isaacs WB, Drake CG. Human prostate-infiltrating CD8+ T lymphocytes are oligoclonal and PD-1+. Prostate. 2009;69(15):1694–1703. doi:10.1002/pros.v69:15.
- Schumacher TN, Schreiber RD. Neoantigens in cancer immunotherapy. Science. 2015;348(6230):69–74. doi:10.1126/science.aaa4971.
- Marcelo S-L, Van de Vijver K, Michaut M, Van der Linden R, Hooijer GKJ, Horlings HM, Severson TM, Mulligan AN, Weerasooriya N, Sanders J, et al. Assessment of PD-L1 expression across breast cancer molecular subtypes, in relation to mutation rate, BRCA1-like status, tumor-infiltrating immune cells and survival. Oncoimmunology. 2018;7(12):e1509820. doi:10.1080/2162402X.2018.1509820.
- Demicco EGD, Ladanyi M, Lazar AJ, Singer S. Comprehensive and integrated genomic characterization of adult soft tissue sarcomas. Cell. 2017;171(4):950–965. doi:10.1016/j.cell.2017.10.014.
- Tawbi HA, Burgess M, Bolejack V, Van Tine BA, Schuetze SM, Hu J, D’Angelo S, Attia S, Riedel RF, Priebat DA, et al. Pembrolizumab in advanced soft-tissue sarcoma and bone sarcoma (SARC028): a multicentre, two-cohort, single-arm, open-label, phase 2 trial. Lancet Oncol. 2017;18(11):1493–1501. doi:10.1016/S1470-2045(17)30624-1.
- Palmerini E, Agostinelli C, Picci P, Pileri S, Marafioti T, Lollini PL, Scotlandi K, Longhi A, Benassi MS, Ferrari S, et al. Tumoral immune-infiltrate (IF), PD-L1 expression and role of CD8/TIA-1 lymphocytes in localized osteosarcoma patients treated within protocol ISG-OS1. Oncotarget. 2017;8(67):111836–111846. doi:10.18632/oncotarget.22912.
- Shen JK, Cote GM, Choy E, Yang P, Harmon D, Schwab J, Nielsen GP, Chebib I, Ferrone S, Wang X, et al. Programmed cell death ligand 1 expression in osteosarcoma. Cancer Immunol Res. 2014;2(7):690–698. doi:10.1158/2326-6066.CIR-13-0224.
- Angella HK, Leeb J, Kimc K-M, Kimb K, Kimb S-T, Parkb SH, Kangb WK, Sharpea A, Ogdena J, Davenportd A, et al. PD-L1 and immune infiltrates are differentially expressed in distinct subgroups of gastric cancer. Oncoimmunology. 2019;8(2):e1544442. doi:10.1080/2162402X.2018.1544442.
- Yomoda T, Sudo T, Kawahara A, Shigaki T, Shimomura S, Tajiri K, Nagasu S, Fujita F, Kinugasa T, Akagi Y. The immunoscore is a superior prognostic tool in stages II and III colorectal cancer and is significantly correlated with programmed death-ligand 1 (PD-L1) expression on tumor-infiltrating mononuclear cells. Ann Surg Oncol. 2019;26(2):415–424. doi:10.1245/s10434-018-07110-z.
- Webb JR, Milne K, Kroeger DR, Nelson BH. PD-L1 expression is associated with tumor-infiltrating T cells and favorable prognosis in high-grade serous ovarian cancer. Gynecol Oncol. 2016;141(2):293–302. doi:10.1016/j.ygyno.2016.03.008.
- Amarnath S, Mangus CW, Wang JC, Wei F, He A, Kapoor V, Foley JE, Massey PR, Felizardo TC, Riley JL, et al. The PDL1-PD1 axis converts human TH1 cells into regulatory T cells. Sci Transl Med. 2011;3(111):111ra120. doi:10.1126/scitranslmed.3003130.
- Colbeck EJ, Jones E, Hindley JP, Smart K, Schulz R, Browne M, Cutting S, Williams A, Parry L, Godkin A, et al. Treg depletion licenses T cell-driven HEV neogenesis and promotes tumor destruction. Cancer Immunol Res. 2017;5(11):1005–1015. doi:10.1158/2326-6066.CIR-17-0131.
- Ager A, May M. Understanding high endothelial venules: lessons for cancer immunology. Oncoimmunology. 2015;4(6):p. e1008791. doi:10.1080/2162402X.2015.1008791.
- Campesato LF, Merghoub T. Antiangiogenic therapy and immune checkpoint blockade go hand in hand. Ann Transl Med. 2017;5(24):497. doi:10.21037/atm.
- Alessandrini F, Pezze L, Ciribilli Y. LAMPs: shedding light on cancer biology. Semin Oncol. 2017;44(4):239–253. doi:10.1053/j.seminoncol.2017.10.013.
- Martinet L, Filleron T, Le Guellec S, Rochaix P, Garrido I, Girard JP. High endothelial venule blood vessels for tumor-infiltrating lymphocytes are associated with lymphotoxin beta-producing dendritic cells in human breast cancer. J Immunol. 2013;191(4):2001–2008. doi:10.4049/jimmunol.1300872.
- Buddingh EP, Kuijjer ML, Duim RA, Burger H, Agelopoulos K, Myklebost O, Serra M, Mertens F, Hogendoorn PCW, Lankester AC, et al. Tumor-infiltrating macrophages are associated with metastasis suppression in high-grade osteosarcoma: a rationale for treatment with macrophage activating agents. Clin Cancer Res. 2011;17(8):2110–2119. doi:10.1158/1078-0432.CCR-10-2047.
- Troiani T, Schettino C, Martinelli E, Morgillo F, Tortora G, Ciardiello F. The use of xenograft models for the selection of cancer treatments with the EGFR as an example. C Crit Rev Oncol Hematol. 2008;65(3):200–211. doi:10.1016/j.critrevonc.2007.10.003.
- Hesketh AJ, Maloney C, Behr CA, Edelman MC, Glick RD, Al-Abed Y, Symons M, Soffer SZ, Steinberg BM.The macrophage inhibitor CNI-1493 blocks metastasis in a mouse model of Ewing Sarcoma through inhibition of extravasation. PLoS One. 2015;10(12):e0145197. doi:10.1371/journal.pone.0145197.
- Fujiwara T, Fukushi J, Yamamoto S, Matsumoto Y, Setsu N, Oda Y, Yamada H, Okada S, Watari K, Ono M, et al. Macrophage infiltration predicts a poor prognosis for human ewing sarcoma. Am J Pathol. 2011;179(3):1157–1170. doi:10.1016/j.ajpath.2011.05.034.
- Toulmonde M, Penel N, Adam J, Chevreau C, Blay JY, Le Cesne A, Bompas E, Piperno-Neumann S, Cousin S, Grellety T, et al. Use of PD-1 targeting, macrophage infiltration, and IDO pathway activation in sarcomas: a phase 2 clinical trial. JAMA Oncol. 2018;4(1):93–97. doi:10.1001/jamaoncol.2017.1617.
- Tsagozis P, Augsten M, Zhang Y, Li T, Hesla A, Bergh J, Haglund F, Tobin NP, Ehnman M. An immunosuppressive macrophage profile attenuates the prognostic impact of CD20-positive B cells in human soft tissue sarcoma. Cancer Immunol Immunother. 2019;68(6):927–936. doi:10.1007/s00262-019-02322-y.