
ABSTRACT
Immune checkpoint inhibition (ICI) of the PD-1/PD-L1 axis shows durable responses in a subset of patients with metastatic urothelial carcinoma (UC). However, PD-L1 expression in tumor biopsies does not necessarily correlate with response to PD-1/PD-L1 inhibitors. Thus, a reliable predictive biomarker is urgently needed. Here, the expression of PD-L1 on circulating tumor cells (CTCs) in blood from patients with advanced UC was analyzed. For this purpose, an assay to test PD-L1 expression on CTCs using the CellSearch® system was established using cells of five UC cell lines spiked into blood samples from healthy donors and applied to a heterogeneous cohort of UC patients. Enumeration of CTCs was performed in blood samples from 49 patients with advanced UC. PD-L1 expression in ≥1 CTC was found in 10 of 16 CTC-positive samples (63%). Both intra- and inter-patient heterogeneity regarding PD-L1 expression of CTCs were observed. Furthermore, vimentin-expressing CTCs were detected in 4 of 15 CTC-positive samples (27%), independently of PD-L1 analysis. Both CTC detection and presence of CTCs with moderate or strong PD-L1 expression correlated with worse overall survival. Analyses during disease course of three individual patients receiving ICI suggest that apart from CTC numbers also PD-L1 expression on CTCs might potentially indicate disease progression.
This is the first study demonstrating the feasibility to detect CTC-PD-L1 expression in patients with advanced UC using the CellSearch® system. This assay is readily available for clinical application and could be implemented in future clinical trials to evaluate its relevance for predicting and monitoring response to ICI.
Introduction
Treatment with immune checkpoint inhibitors confers promising new therapy options for patients with advanced urothelial carcinoma (UC). Targeting the immune receptor programmed death-1 (PD-1) or its ligand programmed death-ligand 1 (PD-L1) by therapeutic antibodies blocks the inhibitory signaling in T cells, which is mediated by the PD-1/PD-L1 interaction.Citation1 PD-1/PD-L1 inhibitors proved to be effective in patients with metastatic UC which recently led to clinical approval of different antibodies in first- and second-line treatment.Citation1-Citation3 However, predicting response to therapy still remains a challenge.Citation2 In this regard, the clinical value of PD-L1 expression of tumor cells and tumor-infiltrating leukocytes (TILs) as predictive biomarkers have been extensively discussed before.Citation1 Yet, neither the choice of diagnostic antibodies, the relevant cell population (tumor cells or TILs), nor cutoff-values for positivity have been harmonized for UC so far.Citation3,Citation4 Moreover, heterogeneity and dynamic changes of PD-L1 expression in the tumor microenvironment can be observed.Citation5,Citation6 PD-L1 can be regulated by a variety of signaling networksCitation7,Citation8 and can also be induced upon the secretion of cytokines such as IFNγ by immune cells.Citation9,Citation10 Furthermore, PD-L1 expression may vary between primary tumors and metastases.Citation11 Therefore, circulating tumor cells (CTCs) hold great potential to function as surrogate reflecting the actual heterogeneity of the tumor cell population.Citation12,Citation13 Notably, the presence of CTCs in peripheral blood of UC patients was shown to be of prognostic relevance.Citation14,Citation15 Using the CellSearch® system, CTCs can be further characterized by the expression of therapeutically relevant targets (e.g. HER2 or EGFR).Citation14,Citation16 Here, cells presenting with epithelial features are detected. For dissemination, however, tumor cells might potentially have undergone a process called epithelial-to-mesenchymal transition (EMT),Citation17-Citation19 during which they might downregulate or upregulate epithelial (e.g. EpCAM, keratins) or mesenchymal proteins (e.g. vimentin), respectively.Citation18 Gene expression analyses of tumor tissues suggested that detection of EMT markers might correlate with PD-L1 expression throughout various carcinoma entities.Citation20 Furthermore, PD-L1 expression was attributed to worse prognosis of UC.Citation21,Citation22
Regarding the current clinical challenges, PD-L1 expression on CTCs of metastatic UC patients holds promise to function as a predictive biomarker for PD-1/PD-L1 inhibition, potentially complementing or replacing PD-L1 detection on tumor cells and/or TILs in tumor tissue. Due to the minimal invasiveness of liquid biopsies on peripheral blood, longitudinal analyses might furthermore allow for monitoring therapy response.Citation23 In this study, we established a CellSearch®-based assay for evaluation of PD-L1 expression on CTCs of UC patients and applied it to patients with advanced stage UC. In addition, we evaluated the vimentin expression of CTCs using the CellSearch®-system to assess EMT-indicating features.
Results
Determination of PD-L1 expression in UC cell lines
Prior to developing an assay for PD-L1 detection in the CellSearch® system, the detection of PD-L1 expression by standard immunological methods was established using a panel of UC cell lines. The goal was to demonstrate antibody specificity and to perform PD-L1 detection on individual UC cells by a flow cytometric method and additionally in a background of blood cells.
First, PD-L1 expression of five UC cell lines was determined by Western blot analysis and compared to that of the breast adenocarcinoma cell line MDA-MB-231 with known PD-L1 expressionCitation24,Citation25 (). Using the antibody clone E1L3N®, PD-L1 expression was detected in 647V, 5637, T24, TCC-SUP and MDA-MB-231 cells, whereas RT-4 cells were PD-L1-negative. Specificity of the anti-PD-L1 antibody was confirmed by increased signal intensity following retroviral overexpression of the PD-L1 gene in 5637 cells (). Moreover, the cell lines were analyzed for the expression of the proteins CTC enrichment and detection during CellSearch® analysis is based on (EpCAM for cell capture; keratin for detection; vimentin as a custom marker indicating mesenchymal-like features) (). In this regard, strong EpCAM and keratin expression were found in RT-4, 647V, and 5637 cells, which indicated epithelial properties. In contrast, T24, TCC-SUP, and MDA-MB-231 cells were characterized by absent or low EpCAM and keratin expression. Vimentin expression in T24 and MDA-MB-231 cells further supported the presence of mesenchymal-like characteristics, while vimentin-positivity in 5637 cells rather suggested the presence of an epithelial/mesenchymal (EM)-intermediate or hybrid phenotype (). Importantly, strong PD-L1 expression can be detected both in epithelial as well as mesenchymal-like cell lines. However, PD-L1 expression was detected in all analyzed more basal cell lines but in none of the two analyzed cell lines defined as more luminal (Suppl. Figure 1).Citation26
Figure 1. Characterization of the anti-PD-L1 antibody clone E1L3N®. (a) Western blot analysis of PD-L1, EpCAM, pan-keratin and vimentin expression in UC cell lines (RT-4, 647V, 5637, T24, and TCC-SUP) and in the breast cancer cell line MDA-MB-231. Protein loading control: HSC70 (Heat shock cognate 71 kDa protein). The bar chart indicates EMT scores according to Tan et al. Citation27 (b) Specificity of the anti-PD-L1 antibody was confirmed by Western blot analysis of 5637 cells with the retroviral transfer of the CD274 gene encoding for PD-L1 or the empty vector (EV). Protein loading control: HSC70. (c) FACS (fluorescence activated cell sorting) analysis of PD-L1 expression in UC cell lines (RT-4, 647V, 5637, T24, and TCC-SUP). Cells were stained with the PE-conjugated anti-PD-L1 antibody clone E1L3N® (blue) in comparison to the respective isotype control clone DA1E (gray). Mean fluorescence intensities (MFI) were determined. (d) IF (immunofluorescence) analysis of PD-L1 expression in UC cell line cells (RT-4: PD-L1-negative, 647V: PD-L1-positive). Cells were spiked into whole blood from healthy donors prior to centrifugation. PD-L1 protein was detected by the PE-conjugated anti-PD-L1 antibody clone E1L3N®. The cells were additionally stained with the AlexaFluor488 (AF488)-conjugated anti-keratin antibodies (clones AE1/AE3 and C11) and the APC-conjugated anti-CD45 (clone REA747) antibody. Nuclei were stained by DAPI (4‘,6-Diamidin-2-phenylindol).
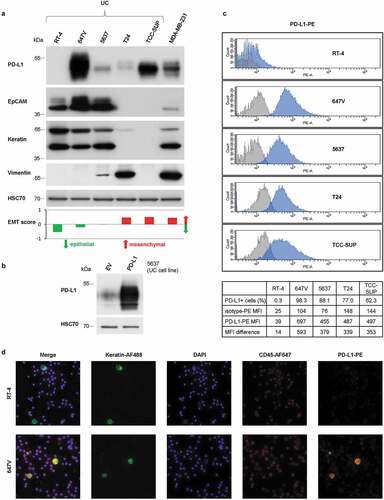
Furthermore, to better reflect cells circulating in the blood, the flow cytometric detection of PD-L1 expression on individual cells in suspension was established using the same antibody clone in FACS analysis. While staining with AlexaFluor488 (AF488)-conjugated anti-PD-L1 antibody did not result in good discrimination of PD-L1-negative, -moderately and -strongly positive cell lines (Suppl. Figure 2), staining with the PE-conjugated antibody () confirmed the PD-L1 expression patterns determined by Western blot analysis ().
In order to allow for in situ visualization of PD-L1-specific signals on individual tumor cells, IF analysis was established using PD-L1-negative (RT-4) and PD-L1-positive cell line (647V) cells spiked into the blood of healthy donors. Identification of tumor cells in a background of blood cells was performed by immunostaining of keratins and CD45. PD-L1 expression was simultaneously detected by applying the PE-conjugated PD-L1 antibody (). This multiplex IF analysis enabled discrimination of tumor cells (keratin+/CD45-) from leukocytes (keratin-/CD45+). As expected, PD-L1 expression was absent in RT-4 cells but strongly detectable in 647V cells and additionally present in a subpopulation of leukocytes. Also, different intensities of PD-L1 expression could be discriminated by immunofluorescence (Suppl. Figure 3).
Detection of PD-L1 expression on UC cells in blood using the CellSearch® system
After demonstrating the feasibility to detect PD-L1 expression on individual UC cells by IF, it was assumed that PD-L1 expression was also detectable on CTCs using the CellSearch® system.
In the first step, PD-L1 expression was detected using the CellSearch® CTC kit, which allows for detection of CTCs by PE-conjugated pan-keratin antibody. Therefore, one additional antigen can be detected in the fourth fluorescence channel by AF488 or fluorescein (FLU)-labeled antibodies. The AF488-conjugated anti-PD-L1 antibody (E1L3N®) was applied as recommended by the manufacturer for the use in flow cytometric methods. In agreement with the results of FACS analysis (Suppl. Figure 2), PD-L1 detection by the AF488-conjugate showed just a narrow range of signal intensities between PD-L1-negative RT-4 cells and PD-L1-positive 647V cells (Suppl. Figure 4).
Therefore, in the next step, the CellSearch® CXC kit was evaluated for its applicability to detect PD-L1 expression on CTCs. Following the idea to pair the dimmer antigen (lower expression) with the brighter fluorochrome, in this kit the additional antigen (e.g. PD-L1) was detected by PE and keratin expression was detected by FLU. Indeed, analyzing PD-L1 expression using the PE-conjugated antibody allowed for a broader range of fluorescence intensity when comparing PD-L1-negative RT-4 cells with strongly PD-L1-positive 647V cells (). PD-L1-specific fluorescence of 647V cells was slightly stronger when images were acquired with an exposition time of 1.6 sec instead of 0.8 sec, so that the prolonged exposition time was included into the protocol.
Figure 2. CellSearch® CXC kit analysis of UC cells spiked into the blood from healthy donors. Cells were enriched by anti-EpCAM magnetic beads using the CXC kit. Keratin+ (KER-FLU), CD45- (CD45-APC), DAPI+ cells were identified as tumor cells. (a) PD-L1 expression of RT-4 cells and (b) 647V cells were detected by the PE-conjugated anti-PD-L1 antibody clone E1L3N® (PD-L1-PE, right panel) in comparison to the isotype control clone DA1E (isotype-PE, left panel). Images of PD-L1-specific fluorescent signals were generated using the indicated exposure time. Furthermore, PD-L1 expression of (c) 5637, (d) T24 and (e) TCC-SUP cells were detected by the PE-conjugated anti-PD-L1 antibody clone E1L3N® (PD-L1-PE) using an exposure time of 1.6 sec. Identification of TCC-SUP cells was performed by manually evaluating fluorescent signals of stained cells in the CellSelect mode because of the low keratin expression impeding automatic selection. (f) TCC-SUP identity of the reported cells was confirmed by single-cell mutational analysis of the PIK3CA gene exon 9. Representative sequencing results showed a heterozygous mutation (G1633A) previously reported by Platt et al. Citation28 that was detected in a recovered single TCC-SUP cell but was absent in a leukocyte.
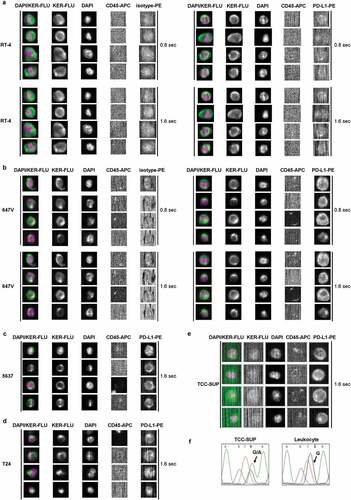
It was furthermore observed that RT-4 cells produced weak but detectable signals both when applying the isotype control or the anti-PD-L1 antibody E1L3N®, probably because of particularly high autofluorescence. Analysis of these cells with the CXC kit without applying any PE-conjugated antibody revealed a certain degree of intrinsic fluorescence of this cell line, which increased with exposure time (Suppl. Figure 5), thereby impeding discrimination of very weak PD-L1-specific immunostaining from background staining.
PD-L1 analysis of the UC cell lines 5637, T24 and TCC-SUP in the CellSearch® system (–e) also corresponded to the appropriate PD-L1 expression patterns determined by Western blot analysis () and FACS (). In summary, the established CellSearch® CXC kit assay allowed for reliable discrimination of UC cells with different PD-L1 expression levels.
These spiking experiments furthermore demonstrated that even subsets of mesenchymal-like cells could be detected by CellSearch® analysis. In the first step, anti-EpCAM antibodies coupled to ferrofluid are used for the enrichment of the cells. Of notice, despite undetectable EpCAM expression in T24 and TCC-SUP cells in Western blots and IF analysis ( and Suppl. Figure 6), even such low levels of EpCAM were still sufficient to enrich at least part of the tumor cells spiked into the blood of healthy donors. In the next step of CellSearch® analysis, tumor cells are identified among the enriched cells by expression of keratins. Even the weak keratin expression () still facilitated the automatic preselection of a small percentage of T24 cells (about 4% [20/500]) by the CellTracks® Analyzer II (). Since TCC-SUP cells did not show keratin expression (), there were no cells preselected automatically. However, evaluation of PE fluorescence in the CellSelect mode revealed the presence of PD-L1-positive, CD45-negative, keratin-negative or -weakly positive cells (). To evaluate their origin in TCC-SUP, individual cells were recovered from the cartridge using the DEPArrayTM. Detection of the previously described PIK3CA exon 9 hotspot mutation G1633A (E545K)Citation28 in putative TCC-SUP cells but not in leukocytes recovered from the same cartridge confirmed their identity (). Finally, applying the established CellSearch® PD-L1 assay to blood samples of patients with metastatic UC, CTCs with different levels of PD-L1 expression could be detected and categorized into negative (0), weakly positive (1+), moderately (2+) and strongly positive (3+) ().
Figure 3. Determination of PD-L1 expression on CTCs. (a) CellSearch® analysis of CTCs detected in the blood of an advanced UC patient. Cells were enriched by anti-EpCAM magnetic beads using the CXC kit. Keratin+ (KER-FLU), CD45- (CD45-APC), DAPI+ cells were identified as tumor cells. PD-L1 expression of individual CTCs was detected by the PE-conjugated anti-PD-L1 antibody clone E1L3N® (PD-L1-PE) and categorized into negative (0), weakly positive (1+), moderately positive (2+) and strongly positive (3+). Images of PD-L1-specific fluorescent signals were generated using an exposure time of 1.6 sec. (b) IF analysis of simultaneous binding of the therapeutic anti-PD-L1 antibody atezolizumab and the diagnostic anti-PD-L1 antibody E1L3N® to PD-L1 on tumor cells. PD-L1-negative RT-4 cells and PD-L1-positive 647V cells were spun onto glass slides and incubated in the presence of 1.2 µg/mL atezolizumab, which was detected by AlexaFluor488-labeled secondary antibody (AF488). Cells were additionally incubated with PE-conjugated anti-PD-L1 antibody. Nuclei were stained by DAPI. (c) Detection of atezolizumab in human blood samples. PD-L1-negative RT-4 cells and PD-L1-positive 647V cells spiked into the blood from healthy donors were spun onto glass slides and incubated in presence of 1.2 µg/mL atezolizumab, which was detected by anti-atezolizumab antibody and AF546-labeled secondary anti-mouse antibody. Mouse IgG served as an isotype control to anti-atezolizumab antibody. Keratins, CD45, and nuclei were stained by manually applying reagents of the CellSearch® CXC kit.
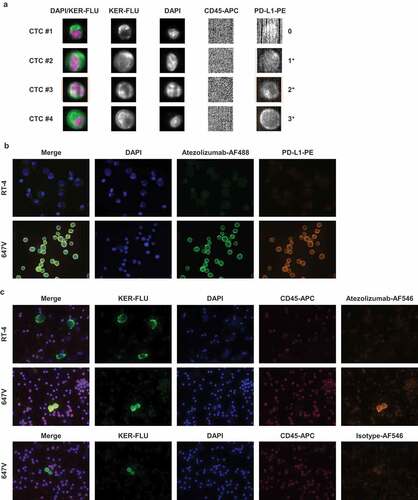
In order to demonstrate that PD-L1 detection on CTCs of patients receiving anti-PD-L1 therapy is not compromised by competition of the therapeutic (atezolizumab) and the diagnostic antibody (E1L3N®), simultaneous interaction of both antibodies with PD-L1-positive tumor cells was shown using IF analysis (). Incubation of cells with atezolizumab, which binds to an extracellular epitope of PD-L1, did not impede the subsequent binding of E1L3N® to its intracellular epitope. Here, atezolizumab was detected via an anti-human secondary antibody. Alternatively, atezolizumab could be detected by an anti-atezolizumab mouse antibody with subsequent binding of an anti-mouse secondary antibody (). The latter approach allowed for the detection of atezolizumab bound to individual UC cells and non-tumoral cells in human blood samples.
Detection of vimentin expression on UC cells in blood using the CellSearch® system
To detect EM-hybrid CTCs, a CellSearch® vimentin assay was applied. Using an AF488-conjugated anti-vimentin antibody, the detected levels of vimentin expression in UC and breast cancer cell line cells spiked into blood from healthy donors () correlated with those determined by Western blot analysis ().
Figure 4. CellSearch® CTC kit analysis of vimentin expression. Cells were enriched by anti-EpCAM magnetic beads using the CTC kit. Keratin+ (KER-PE), CD45- (CD45-APC), DAPI+ cells were identified as tumor cells. Vimentin expression of (a) RT-4, 5637 and MDA-MB-231 cells and of (b) CTCs detected in the blood of advanced UC patients was analyzed by the AlexaFluor488-conjugated anti-vimentin antibody clone V9 (VIM-AF488). Images of vimentin-specific fluorescent signals were generated using an exposure time of 0.8 sec. Vimentin expression of individual CTCs was categorized into negative (0), weakly positive (1+) and moderately positive (2+).
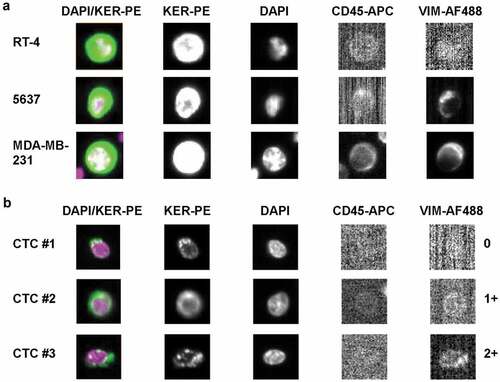
Vimentin expression could be detected in CTCs isolated from patients with advanced UC and categorized into negative (0), weakly (1+) and moderately positive (2+) (). There was no CTC with strong vimentin expression (3+) among the cells analyzed throughout this study.
Detection of CTCs in blood samples of UC patients
Blood samples collected from 49 patients with advanced UC (Suppl. Table 1) were analyzed in the CellSearch® system applying either the CTC kit and/or the CXC kit. Follow-up samples could be obtained from eight patients, resulting in a total sample number of 57. Since higher CTC detection rates were expected with the CTC than with the CXC kit, one of the two corresponding blood tubes was first analyzed with the CTC kit (n = 41). Only if CTCs were present, the second tube was analyzed using the CXC kit including PD-L1 detection. However, if blood volume was limited, samples were directly analyzed using the CXC kit (n = 16) for PD-L1 expression (Suppl. Figure 7).
By CTC kit analysis, ≥1 and ≥5 CTC/7.5 mL blood were identified in 22 of 41 (53.7%) and in 12 of 41 samples (29.3%), respectively. When combining both kits, 27 of 57 samples (47.4%) and 14 of 57 samples (24.6%) contained ≥1 and ≥5 CTCs/7.5 mL blood, respectively. Detected CTC counts varied from 0 to 400 (CTC kit) and 0 to 275 (CXC kit) (). In 12 matched samples analyzed by both kits (Suppl. Table 2), absolute CTC counts were in the majority of cases higher when using the CTC kit. However, the observed differences in CTC detection were acceptable in favor of improved sensitivity of PD-L1 detection by the CXC kit.
Table 1. CellSearch® analyses of blood samples from patients with advanced UC.
The median follow-up time of UC patients (n = 49) after first blood draw was 99 days (range 0 to 837). At first sample collection, three patients presented with locally advanced disease (LA), 18 patients had positive lymph node (LN) status without evidence of distant metastasis and 28 patients showed clinically proven distant metastasis (DM). Survival analyses revealed significant prognostic differences between these three categories (Suppl. Figure 8, p = .012). Furthermore, CTC kit analysis of 41 samples derived from 34 patients confirmed that presence of CTCs across all samples (first and second blood draw) was associated with worse overall survival (Suppl. Figure 9a-c, cutoff ≥1, >1 and ≥5 CTCs/7.5 mL blood, p = .029, p < .000 and p = .006, respectively). A similar association was observed in 57 samples derived from 49 patients when combining the results obtained by CTC and CXC kit and applying a cutoff of >1 or ≥5 CTCs/7.5 mL blood (Suppl. Figure 9d-f, cutoff ≥1, >1 and ≥5 CTCs/7.5 mL blood, p = .160, p = .003 and p = .007, respectively).
Evaluation of PD-L1 and vimentin expression on CTCs detected in blood samples of UC patients
Sixteen CTC-positive samples derived from 14 patients (Suppl. Table 1, Suppl. Figure 7) were further analyzed for PD-L1 expression of CTCs. PD-L1-specific signals of any intensity (1+/2+/3+) and medium to high intensity (2+/3+) on ≥1 CTC could be detected in 10 of 16 (62.5%) and 4 of 16 samples (25.0%), respectively (). Despite low sample numbers and heterogeneity of clinical characteristics of the patients, an association of CTC-PD-L1 expression with worse prognosis could be observed for patients with ≥1 CTC with moderate or strong PD-L1 expression (2+/3+) (, p = .008).
Table 2. Single cell-based evaluation of PD-L1 expression on CTCs from patients with advanced UC.
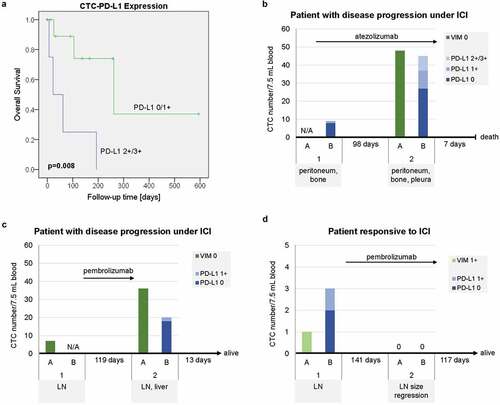
Figure 5. Disease courses and clinical outcome of patients with advanced UC in relation to CTC-PD-L1 expression. (a) Kaplan-Meier plot and Log Rank test for overall survival of UC patients according to CTC-PD-L1 expression (0/1+ compared to 2+/3+) of CTC-positive samples using the CXC kit. Values of p < .05 were considered statistically significant. (b, c) Disease courses of two individual patients with metastatic UC who progressed under ICI (immune checkpoint inhibition) (B, pretreated; C, first-line) and (d) one patient who responded to ICI (pretreated) accompanied by CTC numbers as well as CTC-vimentin (VIM) and CTC-PD-L1 expression levels analyzed using the CellSearch® system. For each sample (1 and 2), metastatic sites are indicated. CTC analyses were performed using the CTC kit and/or the CXC kit (A and B, respectively, with N/A indicating that the analysis was not applied). Time spans between samples and maximum follow-up times as well as survival information are given. Arrows depict the duration of ICI therapy in relation to the acquisition of samples.
Intra-patient heterogeneity was observed for CTC-PD-L1 expression. The range of PD-L1-positive CTCs per sample varied from 0% to 50%. For patient #4, PD-L1 expression of the CTCs (from 0 to 3+) could be compared to matched tissue of the primary tumor analyzed by immunohistochemistry (Suppl. Figure 10a,b). Interestingly, here the tumor cells revealed to be PD-L1-negative while some stromal cells were PD-L1-positive.
Vimentin expression of CTCs could be detected in 4 of 17 CTC-positive samples (23.5%, range 0–1) derived from 15 patients (Suppl. Figure 7). Precisely, only four of 258 of analyzed CTCs (1.6%) exhibited weak to moderate vimentin expression. Parallel analysis of PD-L1 and vimentin expression of CTCs could be performed in eight matched blood samples (Suppl. Tab. 3). Three of these CTC-positive samples contained PD-L1-positive, but no vimentin-positive CTCs.
The disease courses of three individual patients receiving ICI therapy followed-up by the acquisition of a second blood sample are shown in –d. One patient with pretreated metastatic UC presented with nine CTCs at the beginning of ICI therapy, with one of the CTCs being PD-L1 1+. After three cycles of treatment with atezolizumab, the follow-up sample contained 45 CTCs, with ten and eight of them being PD-L1 1+ and PD-L1 2+/3+, respectively (; , patient #3). The observed increase both in CTC counts as well as in the intensity of CTC-PD-L1 expression was accompanied by disease progression. The patient died within 1 week after the second blood draw.
A second patient with lymph node-positive UC who received first-line treatment with the anti-PD-1 antibody pembrolizumab also showed progressive disease along with substantially increasing CTC numbers and CTC-PD-L1 expression (1+) (). ICI was discontinued at the manifestation of a liver metastasis and the patient was scheduled for subsequent chemotherapy. The blood samples were taken before and after immunotherapy.
A third patient with pretreated, lymph node-positive UC showed low numbers of CTCs and weak vimentin and weak PD-L1 expression before initiation of pembrolizumab therapy (). The patient responded to ICI and size regression of the lymph node metastasis was reported. No CTCs were detected in a follow-up blood sample after six cycles of pembrolizumab. The treatment was continued.
Discussion
Liquid biopsies hold great potential to provide reliable biomarkers for predicting and monitoring response to therapies with immune checkpoint inhibitors (ICI). Therefore, the goal of this study was to establish a robust assay for the detection of PD-L1 expression on CTCs and to demonstrate its applicability for patients with advanced urothelial carcinoma (UC).
The PD-L1 assay was established based on the CellSearch® platform using the CXC kit. This guaranteed good discrimination of cells with different levels of PD-L1 expression by applying the PE-labeled anti-PD-L1 antibody E1L3N®. In comparison to the CTC kit, the CXC kit potentially identifies lower absolute numbers of CTCs; however, absence of substantial differences in CTC detection justified the use of the CXC kit in favor of a more sensitive PD-L1 detection. Furthermore, it could be demonstrated in vitro that the therapeutic anti-PD-L1 antibody atezolizumab does not compete with E1L3N® for binding to PD-L1 and therefore its potential presence in vivo during therapy is not expected to hamper specific detection of CTC-PD-L1 expression by our assay.
The CellSearch® system is the state of the art technique for CTC analysis and so far the only device that achieved clearance by the Food and Drug Administration (FDA) for metastatic breast, prostate and colorectal cancer.Citation29 Importantly, using the CellSearch® system, the presence of CTCs was shown to have prognostic relevance for non-metastatic UC patients.Citation14,Citation15,Citation30
The established CellSearch® assay was applied to a cohort of 49 patients with advanced or metastatic UC. To the best of our knowledge, this is the largest study on CTC detection in this tumor entity in the metastatic setting using the CellSearch® system. Although to date there is still few data on CTC enumeration in metastatic UC, our results are in line with findings of earlier studies on small patient cohorts analyzed by the CellSearch® system.Citation31-Citation35 In our study, CTC detection was prognostically relevant for overall survival (OS) in the heterogeneous patient cohort despite administration of different therapies.
Still, a considerable number of patients with advanced UC is lacking proof of CTCs. A possible explanation is the technical inability of the CellSearch® system to detect CTCs with complete loss of epithelial-specific proteins such as EpCAM and keratin.Citation36 For detection of these cells, label-independent CTC capture methods (e.g. the ParsortixTM system or filtration-based methods) or fluorescence in situ hybridization to identify genomic aberrations might provide promising alternatives.Citation37 However, in the present study, it was observed that even a portion of cells with very low EpCAM and keratin expression (e.g. UC cell lines T24 and TCC-SUP) can still be enriched and detected using the CellSearch® system. Regarding EMT in CTCs, we sought to evaluate the percentage of CTCs displaying an EM-hybrid phenotype by applying an assay for detection of vimentin expression of CTCs in the CellSearch® system. Interestingly, Jolly et al. proposed that the partial EMT state might be rather stable and furthermore associated with tumor progression.Citation38 Western blot analysis of UC cell lines revealed epithelial and mesenchymal-like characteristics. A generic EMT score established by Tan et al. confirms this phenotypical heterogeneity of UC cell lines and, importantly, also of UC tumors, attesting a good representation of the UC tumor landscape by the cell lines.Citation27 Surprisingly, vimentin-positive CTCs were only observed in four of 15 CTC-positive patients and only ata very low percentage. Higher numbers of vimentin-positive CTCs were detected by the CellSearch® system in patients with non-small cell lung cancer (NSCLC)Citation39 and also in patients with prostate carcinoma, where the presence of these cells was found to be associated with worse OS.Citation40 Thus, analysis of other EMT markers could provide more information about an EM-hybrid phenotype of CTCs in UC patients.
Determining the PD-L1 expression of CTCs was feasible in 16 CTC-positive blood samples derived from 14 patients. In 10 of these samples (62.5%), ≥1 PD-L1-positive CTC could be detected and PD-L1 expression of CTCs was characterized by intra-patient heterogeneity. As in general the portion of PD-L1-positive CTCs was substantially higher in comparison to vimentin-positive CTCs, it might be assumed that the majority of PD-L1-positive CTCs were negative for vimentin. This could be further substantiated by the direct comparison of matched blood samples, which suggests that CTC-PD-L1 expression was present in samples with absence of CTC-vimentin expression. Taken together with the Western blot analyses, our results imply that CTC-PD-L1 expression in UC patients might be not necessarily associated with the expression of EMT-indicating proteins, as suggested for NSCLC.Citation41 Instead, our cell line experiments indicated frequent PD-L1 expression in the aggressive basal subtype of UC whereas cells of the luminal subtype were PD-L1-negative. Concordantly, by IHC staining of 196 UC tumor tissues the basal subtype was linked to a ‘hot’ immunophenotype showing abundance of cytotoxic T cells and elevated expression of immune-inhibitory molecules such as PD-L1.Citation42 Moreover, by mRNA expression clustering of 412 muscle-invasive bladder cancers (TCGA cohort) Robertson et al. reported low PD-L1 expression in luminal tumors, medium expression of PD-L1 in a subgroup with increased EMT marker expression (‘luminal-infiltrated’) and high PD-L1 expression as well as signs of immune infiltration in tumors of the basal subtype.Citation43 Importantly, the anti-keratin antibody cocktail applied in CellSearch® analysis detects keratins characteristic for the luminal as well as for the basal subtype.
In the present study, intra- and inter-patient heterogeneity of CTC-PD-L1 expression was observed, which had also been reported by earlier studies on UC,Citation44 breast carcinoma,Citation45 and NSCLCCitation46,Citation47 patients. Anantharaman et al. displayed PD-L1 protein expression on CTCs of metastatic UC patients using the antibody clone E1L3N® in the Epic Sciences CTC platform. However, the cohort size was too small to derive clinical value.Citation44 Our study is the first to use the CellSearch® system to evaluate CTC-PD-L1 expression in patients with advanced UC. As shown for one UC patient, the detection of PD-L1-negative primary tumor cells, but also PD-L1-positive CTCs in the metastatic situation suggests that CTCs might provide additional information about tumor cell heterogeneity gained during tumor progression. In spite of the small sample size for CTC-PD-L1 evaluation (n = 16), the patients with PD-L1-expressing (2+/3+) CTCs were observed to have a shorter OS compared to those with only PD-L1-negative or weakly positive (0/1+) CTCs (p = .008). This result is in line with the studies of Boorjian et al. and Nakanishi et al. who reported a worse prognosis for UC patients showing PD-L1 expression in tumor cellsCitation21,Citation22 and is additionally reflected by a tendency of UC patients with PD-L1+ CTCs toward worse OS observed by Anantharaman et al.Citation44 It can be assumed that, regardless of the administered therapy, PD-L1 expression confers a survival advantage for CTCs by facilitating immune escape during circulation of the tumor cells in the blood which finally might promote initiation of metastasis.Citation48 With respect to ICI, in our study progressive disease under therapy might potentially be associated with an increased percentage of PD-L1-positive CTCs as also was shown for NSCLC patients.Citation46,Citation47 Noteworthy, while evaluation of PD-L1 expression on tumor tissue is performed on tumor cells and/or TILs, depending on the respective diagnostic test, our assay does not inform on PD-L1 expression on circulating immune cells. The interesting but preliminary findings of this study need to be validated in a larger cohort of UC patients uniformly treated by ICI in prospective trials. In conclusion, we established a robust CellSearch®-based assay for PD-L1 detection on CTCs readily available for clinical applications. Our results demonstrate the potential of CTC-PD-L1 expression to be implemented in monitoring response to ICI therapies.
Materials and methods
Tumor cell lines
The human UC cell lines RT-4, RT-112, 647V, T24, TCC-SUP, and the human breast adenocarcinoma cell line MDA-MB-231 were grown in DMEM at 37°C and 10% CO2 as described elsewhere.Citation49 The human UC cell line 5637 was grown in RPMI 1640 at 37°C and 5% CO2. All media were supplemented with 10% (v/v) FCS (PAA Laboratories), 100 U/mL penicillin, 0.1 mg/mL streptomycin (Gibco) and 2 mM L-glutamine (PAA Laboratories). All cell lines were regularly authenticated and tested negative for mycoplasma contamination.
The UC cell lines were provided by cooperation partners (see acknowledgments for details) and the breast cancer cell line MDA-MB-231 was obtained from the Central Cell Service Unit of the Imperial Cancer Research Fund (London, United Kingdom).Citation50
Western blot analysis
Whole cell extracts of UC cell line cells were prepared using RIPA buffer containing protease and phosphatase inhibitors (CST). Proteins were separated by SDS gel electrophoresis, transferred onto PSQ membrane (Pall Life Sciences) and subjected to Western blot analysis using antibodies specific to PD-L1 (E1L3N® XP® rabbit mAb, CST, dilution 1:1,000, which binds to an intracellular epitope of the transmembrane protein), EpCAM (VU-1D9 mouse mAb, Novocastra, dilution 1:1,000), pan-keratins (AE1/AE3 mouse mAb, Merck Millipore, dilution each 1:50,000), vimentin (V9 mouse mAb, Santa Cruz Biotechnology, dilution 1:1,000) and HSC70 (B-6 mouse mAb, Santa Cruz Biotechnology, dilution 1:500,000).
Flow cytometry
Tumor cell line cells were fixed in 4% formaldehyde, permeabilized by 90% (v/v) methanol on ice and incubated with the anti-PD-L1-antibody (E1L3N® XP® rabbit mAb, AF488/PE conjugate, CST, dilution 1:50) or an isotype control (DA1E rabbit mAb, AF488/PE conjugate, CST, dilution 1:50) for 1 h at room temperature (RT). PD-L1 expression of the cells was analyzed on FACSCanto II flow cytometer (BD Biosciences) by the acquisition of 10,000 events per sample and determination of the mean fluorescence intensity (MFI). To exclude cellular debris and cell doublets from analysis, events were gated by a forward and a side scatter.
Immunofluorescence (IF)
For IF assays either cultured UC cell line cells alone or PBMCs from healthy donors spiked with UC cell line cells after ficoll density gradient centrifugation were spun onto glass slides. Cells were fixed in 4% (v/v) paraformaldehyde and permeabilized in 0.1% (v/v) Tween® 20 in PBS. For slides from spiked blood samples, additional blocking of unspecific binding was performed with 10% (v/v) AB-serum (Bio-Rad Laboratories). Subsequently, the cells were incubated with the anti-PD-L1-antibody (E1L3N® XP® rabbit mAb, PE conjugate, CST, dilution 1:200) for 45 min at RT. To identify spiked tumor cells in the background of blood cells, the cells were simultaneously incubated with the anti-pan-keratin-antibodies (AE1/AE3 mouse mAb, AF488 conjugate, eBioscience, dilution 1:500; and C11 mouse mAb, AF488 conjugate, CST, dilution 1:200) and with the anti-CD45-antibody (REA747 human mAb, APC conjugate, MACS Miltenyi Biotec, dilution 1:200) for 45 min at RT. Nuclei were stained using DAPI (Carl Roth, dilution 1:1.000).
To test whether the diagnostic anti-PD-L1 antibody E1L3N® can still bind after incubation of the cells with a therapeutic anti-PD-L1 antibody commonly used to treat UC patients, PD-L1-positive and PD-L1-negative UC cell line cells were incubated with the humanized anti-PD-L1 antibody atezolizumab (Tecentriq®, Roche, 1.2 µg/mL) at 4°C overnight and detection was performed with the AF488-labeled secondary goat-anti-human IgG (Thermo Fisher Scientific, dilution 1:400) for 45 min at RT.
Binding of atezolizumab (1.2 µg/mL, at 4°C overnight) in human blood samples was detected by incubation with an anti-atezolizumab antibody (6B12 mouse mAb, GenScript, 5 µg/mL) for 60 min and subsequently with an AF546-labeled secondary goat-anti-mouse IgG (Thermo Fisher Scientific, dilution 1:200) for 45 min at RT. Mouse IgG (MOPC mouse mAb, dilution 1:500) was used as isotype control to anti-atezolizumab antibody. Subsequently, reagents of the CellSearch® CXC kit for immunostaining of keratins and CD45 and visualization of nuclei were manually applied in equal parts for 30 min at RT.
Fluorescence was evaluated with an Axioplan 2 imaging microscope connected to an AxioCam camera (Carl Zeiss).
Processing of clinical samples
Between June 2015 and March 2019, 49 patients with locally advanced or metastatic UC who were treated at the University Medical Center in Hamburg, Germany, were enrolled in this study, which was approved by the ethical commission of the ‘Hamburger Ärztekammer’ (PV3779, PV5392). All patients gave their written informed consent for the participation in this study. The cohort was not selected according to disease stage, therapeutic regimen or line of treatment. Instead, samples were taken randomly throughout palliative systemic treatment. From most patients, blood was collected in two CellSave® tubes (Menarini) à 7.5 mL, containing a specific fixative, and processed within 96 h. For eight patients, a second sample could be obtained during the follow-up period. CTC enumeration was performed with the CellSearch® system (Menarini) using either the CTC kit or CXC kit (Suppl. Figure 7). Briefly, after EpCAM-based immunomagnetic enrichment and automatic immunofluorescence staining, cells were automatically scanned and round to oval, nucleated, keratin-positive, CD45-negative cells with a diameter of at least 4 µm were identified as CTCs by experienced observers. The pan-keratin antibody used for CTC detection was either conjugated to PE (CTC kit) or FLU (CXC kit).
To perform experiments with spiked cell line cells, peripheral blood from healthy blood donors was collected by the Institute of Transfusion Medicine, University Medical Center Hamburg-Eppendorf, Hamburg, Germany. Only residual amounts of anonymous blood samples have been used which are routinely taken from all healthy blood donors and would have been discarded otherwise. All blood donors gave their general written consent to the use of their blood samples for scientific studies in an anonymized form. The anonymous use of this material is in compliance with a vote by the ethics committee of the German medical association.
Determination of PD-L1 expression of CTCs
Blood samples (n = 16) from 14 patients were further analyzed for PD-L1 expression on CTCs using the free fourth channel (PE) available for the CellSearch® CXC kit (Menarini). According to the protocol established in this study, the anti-PD-L1-antibody (E1L3N® XP® rabbit mAb, PE conjugate, Cell Signaling Technology [CST]) was diluted in Antibody Diluent (DAKO Cytomation) within Menarini-supplied reagent cups (1:50, final concentration in device 1:237). PD-L1-specific immunofluorescence of CTCs was evaluated after an exposure time of 1.6 sec and categorized into negative (0), weakly positive (1+), moderately (2+) and strongly positive (3+) by comparing to PD-L1 levels of UC cell line cells with previously determined PD-L1 expression.
Determination of vimentin expression of CTCs
Blood samples from 15 patients were further analyzed for vimentin expression of CTCs using the free fourth channel (FLU) available for the CellSearch® CTC kit (Menarini). Eight of them were analyzed for CTC-PD-L1 expression in parallel. The anti-vimentin-antibody (V9 mouse mAb, AF488 conjugate, 200 µg/mL, Santa Cruz Biotechnology) was diluted 1:50 (final concentration in device 1:237) in Antibody Diluent (DAKO Cytomation) in Menarini-supplied reagent cups. The exposure time of CellSearch® cartridges for the detection of vimentin-specific immunofluorescence was 0.8 sec.
Statistical analyses
Clinical outcome of UC patients was compared according to disease status (locally advanced, LN-positive, distant metastasis), CTC-positivity (≥1 CTC, >1 CTCs and ≥5 CTCs) and presence of PD-L1-positive CTCs (≥1 CTC) by non-parametric Kaplan-Meier estimates of the survival function and by Log Rank (Mantel-Cox) test. All blood samples (first and follow-up samples) tested by the respective assays were included into the analyses. Overall survival (OS) was defined as the time span between the collection of blood and death by any cause. Statistical calculations were performed using the IBM SPSS Statistics 24 program. P values <.05 were considered statistically significant.
Abbreviations
| CTCs | = | circulating tumor cells |
| DM | = | distant metastasis |
| EM | = | epithelial/mesenchymal |
| EMT | = | epithelial-to-mesenchymal transition |
| EpCAM | = | epithelial cell adhesion molecule |
| FACS | = | fluorescence activated cell sorting |
| HSC70 | = | Heat shock cognate 71 kDa protein |
| ICI | = | immune checkpoint inhibition |
| IF | = | immunofluorescence |
| IFNγ | = | interferon γ |
| KER | = | keratin |
| mAb | = | monoclonal antibody |
| IHC | = | immunohistochemistry |
| LA | = | locally advanced |
| LN | = | lymph node |
| NSCLC | = | non-small cell lung cancer |
| OS | = | overall survival |
| PD-1 | = | programed death-1 |
| PD-L1 | = | programed death-ligand 1 |
| RT | = | room temperature |
| TILs | = | tumor-infiltrating leukocytes |
| UC | = | urothelial carcinoma |
Disclosure of Potential Conflicts of Interest
No potential conflicts of interest were disclosed.
Ethics approval and consent to participate
This study was approved by the ethical commission of the ‘Hamburger Ärztekammer’ (PV3779, PV5392). All patients gave their written informed consent for the participation in this study.
Availability of data and material
The datasets used and/or analyzed during the current study are available from the corresponding author on reasonable request.
Competing interests
MR functions as a referee and advisory board member for Roche, MSD Sharp & Dohme, and Bristol-Myers Squibb. KP received grant/research support from Janssen and EU/IMI CANCER-ID EFPA and honoraria from Agena, Novartis, and Pfizer. All other authors declare that they have no competing interests.
Supplemental Material
Download ()Acknowledgments
The authors express their thanks to all patients who participated in this study. We also like to thank Antje Andreas, Oliver Mauermann, and Sonja Santjer for excellent technical assistance. Furthermore, we thank the FACS Sorting Core Unit (University Medical Center Hamburg-Eppendorf, Hamburg, Germany) for valuable support. Moreover, we thank Dr. Michael Rink (Department of Urology, University Medical Center Hamburg-Eppendorf, Hamburg, Germany) for kindly providing T24, TCC-SUP, and 5637 cells, Prof. Dr. Robert Stöhr (Department of Pathology, University Medical Center Erlangen, Germany) for kindly providing RT-4 cells, Dr. Katharina Röck (Institute for Pharmacology and Clinical Pharmacology, University Hospital Düsseldorf, Germany) for kindly providing RT-112 and 647V cells and Dr. Volker Assmann (Institute of Tumor Biology, University Medical Center Hamburg-Eppendorf, Hamburg, Germany) for kindly providing Phoenix-AMPHO cells.
Supplementary material
Supplemental data for this article can be accessed on the publisher’s website.
Additional information
Funding
References
- Bellmunt J, Powles T, Vogelzang NJ. A review on the evolution of PD-1/PD-L1 immunotherapy for bladder cancer: the future is now. Cancer Treat Rev. 2017;54:58–13. doi:10.1016/j.ctrv.2017.01.007.
- Powles T, Necchi A, Rosen G, Hariharan S, Apolo AB. Anti-programmed cell death 1/ligand 1 (PD-1/PD-L1) antibodies for the treatment of urothelial carcinoma: state of the art and future development. Clin Genitourin Cancer. 2018;16:117–129. doi:10.1016/j.clgc.2017.11.002.
- Aggen DH, Drake CG. Biomarkers for immunotherapy in bladder cancer: a moving target. J Immunother Cancer. 2017;5:94. doi:10.1186/s40425-017-0299-1.
- Carbognin L, Pilotto S, Milella M, Vaccaro V, Brunelli M, Calio A, Cuppone F, Sperduti I, Giannarelli D, Chilosi M, et al. Differential activity of nivolumab, pembrolizumab and MPDL3280A according to the tumor expression of programmed death-ligand-1 (PD-L1): sensitivity analysis of trials in melanoma, lung and genitourinary cancers. PLoS One. 2015;10:e0130142. doi:10.1371/journal.pone.0130142.
- Madore J, Vilain RE, Menzies AM, Kakavand H, Wilmott JS, Hyman J, Yearley JH, Kefford RF, Thompson JF, Long GV, et al. PD-L1 expression in melanoma shows marked heterogeneity within and between patients: implications for anti-PD-1/PD-L1 clinical trials. Pigment Cell Melanoma Res. 2015;28:245–253. doi:10.1111/pcmr.12340.
- Kerr KM, Tsao MS, Nicholson AG, Yatabe Y, Wistuba II, Hirsch FR, Committee IP. Programmed death-ligand 1 immunohistochemistry in lung cancer: in what state is this art? J Thorac Oncol. 2015;10:985–989. doi:10.1097/JTO.0000000000000526.
- Chen J, Jiang CC, Jin L, Zhang XD. Regulation of PD-L1: a novel role of pro-survival signalling in cancer. Ann Oncol. 2016;27:409–416. doi:10.1093/annonc/mdv615.
- Shi Y. Regulatory mechanisms of PD-L1 expression in cancer cells. Cancer Immunol Immunother. 2018;67:1481–1489. doi:10.1007/s00262-018-2226-9.
- Garcia-Diaz A, Shin DS, Moreno BH, Saco J, Escuin-Ordinas H, Rodriguez GA, Zaretsky JM, Sun L, Hugo W, Wang X, et al. Interferon receptor signaling pathways regulating PD-L1 and PD-L2 expression. Cell Rep. 2017;19:1189–1201. doi:10.1016/j.celrep.2017.04.031.
- Moon JW, Kong SK, Kim BS, Kim HJ, Lim H, Noh K, Kim Y, Choi JW, Lee JH, Kim YS. IFNgamma induces PD-L1 overexpression by JAK2/STAT1/IRF-1 signaling in EBV-positive gastric carcinoma. Sci Rep. 2017;7:17810. doi:10.1038/s41598-017-18132-0.
- Tretiakova M, Fulton R, Kocherginsky M, Long T, Ussakli C, Antic T, Gown A. Concordance study of PD-L1 expression in primary and metastatic bladder carcinomas: comparison of four commonly used antibodies and RNA expression. Mod Pathol. 2018;31:623–632. doi:10.1038/modpathol.2017.188.
- Pantel K, Alix-Panabieres C. Liquid biopsy: potential and challenges. Mol Oncol. 2016;10:371–373. doi:10.1016/j.molonc.2016.01.009.
- Pantel K, Speicher MR. The biology of circulating tumor cells. Oncogene. 2016;35:1216–1224. doi:10.1038/onc.2015.192.
- Rink M, Chun FK, Dahlem R, Soave A, Minner S, Hansen J, Stoupiec M, Coith C, Kluth LA, Ahyai SA, et al. Prognostic role and HER2 expression of circulating tumor cells in peripheral blood of patients prior to radical cystectomy: a prospective study. Eur Urol. 2012;61:810–817. doi:10.1016/j.eururo.2012.01.017.
- Soave A, Riethdorf S, Dahlem R, von Amsberg G, Minner S, Weisbach L, Engel O, Fisch M, Pantel K, Rink M. A nonrandomized, prospective, clinical study on the impact of circulating tumor cells on outcomes of urothelial carcinoma of the bladder patients treated with radical cystectomy with or without adjuvant chemotherapy. Int J Cancer. 2017;140:381–389. doi:10.1002/ijc.30445.
- Okegawa T, Itaya N, Hara H, Tambo M, Nutahara K. Epidermal growth factor receptor status in circulating tumor cells as a predictive biomarker of sensitivity in castration-resistant prostate cancer patients treated with docetaxel chemotherapy. Int J Mol Sci. 2016:17. doi:10.3390/ijms17122008.
- Thiery JP. Epithelial-mesenchymal transitions in tumour progression. Nat Rev Cancer. 2002;2:442–454. doi:10.1038/nrc822.
- Thiery JP, Acloque H, Huang RY, Nieto MA. Epithelial-mesenchymal transitions in development and disease. Cell. 2009;139:871–890. doi:10.1016/j.cell.2009.11.007.
- Alix-Panabieres C, Pantel K. Circulating tumor cells: liquid biopsy of cancer. Clin Chem. 2013;59:110–118. doi:10.1373/clinchem.2012.194258.
- Mak MP, Tong P, Diao L, Cardnell RJ, Gibbons DL, William WN, Skoulidis F, Parra ER, Rodriguez-Canales J, Wistuba II, et al. Pan-cancer EMT signature identifies global molecular alterations and immune target enrichment following epithelial-to-mesenchymal transition. Clin Cancer Res. 2016;22:609–620. doi:10.1158/1078-0432.CCR-15-0876.
- Boorjian SA, Sheinin Y, Crispen PL, Farmer SA, Lohse CM, Kuntz SM, Leibovich BC, Kwon ED, Frank I. T-cell coregulatory molecule expression in urothelial cell carcinoma: clinicopathologic correlations and association with survival. Clin Cancer Res. 2008;14:4800–4808. doi:10.1158/1078-0432.CCR-08-0731.
- Nakanishi J, Wada Y, Matsumoto K, Azuma M, Kikuchi K, Ueda S. Overexpression of B7-H1 (PD-L1) significantly associates with tumor grade and postoperative prognosis in human urothelial cancers. Cancer Immunol Immunother. 2007;56:1173–1182. doi:10.1007/s00262-006-0266-z.
- Brock G, Castellanos-Rizaldos E, Hu L, Coticchia C, Skog J. Liquid biopsy for cancer screening, patient stratification and monitoring. Transl Cancer Res. 2015;4:280–290.
- Li CW, Lim SO, Xia W, Lee HH, Chan LC, Kuo CW, Khoo KH, Chang SS, Cha JH, Kim T, et al. Glycosylation and stabilization of programmed death ligand-1 suppresses T-cell activity. Nat Commun. 2016;7:12632. doi:10.1038/ncomms12632.
- Mahoney KM, Sun H, Liao X, Hua P, Callea M, Greenfield EA, Hodi FS, Sharpe AH, Signoretti S, Rodig SJ, et al. PD-L1 antibodies to its cytoplasmic domain most clearly delineate cell membranes in immunohistochemical staining of tumor cells. Cancer Immunol Res. 2015;3:1308–1315. doi:10.1158/2326-6066.CIR-15-0116.
- Warrick JI, Walter V, Yamashita H, Chung E, Shuman L, Amponsa VO, Zheng Z, Chan W, Whitcomb TL, Yue F, et al. FOXA1, GATA3 and PPAR cooperate to drive luminal subtype in bladder cancer: a molecular analysis of established human cell lines. Sci Rep. 2016;6:38531. doi:10.1038/srep38531.
- Tan TZ, Miow QH, Miki Y, Noda T, Mori S, Huang RY, Thiery JP. Epithelial-mesenchymal transition spectrum quantification and its efficacy in deciphering survival and drug responses of cancer patients. EMBO Mol Med. 2014;6:1279–1293. doi:10.15252/emmm.201404208.
- Platt FM, Hurst CD, Taylor CF, Gregory WM, Harnden P, Knowles MA. Spectrum of phosphatidylinositol 3-kinase pathway gene alterations in bladder cancer. Clin Cancer Res. 2009;15:6008–6017. doi:10.1158/1078-0432.CCR-09-0898.
- Miller MC, Doyle GV, Terstappen LW. Significance of circulating tumor cells detected by the cellsearch system in patients with metastatic breast colorectal and prostate cancer. J Oncol. 2010;2010:617421. doi:10.1155/2010/617421.
- Gazzaniga P, de Berardinis E, Raimondi C, Gradilone A, Busetto GM, De Falco E, Nicolazzo C, Giovannone R, Gentile V, Cortesi E, et al. Circulating tumor cells detection has independent prognostic impact in high-risk non-muscle invasive bladder cancer. Int J Cancer. 2014;135:1978–1982. doi:10.1002/ijc.28830.
- Abrahamsson J, Aaltonen K, Engilbertsson H, Liedberg F, Patschan O, Ryden L, Sjodahl G, Gudjonsson S. Circulating tumor cells in patients with advanced urothelial carcinoma of the bladder: association with tumor stage, lymph node metastases, FDG-PET findings, and survival. Urol Oncol. 2017;35:606 e609–606 e616. doi:10.1016/j.urolonc.2017.05.021.
- Gallagher DJ, Milowsky MI, Ishill N, Trout A, Boyle MG, Riches J, Fleisher M, Bajorin DF. Detection of circulating tumor cells in patients with urothelial cancer. Ann Oncol. 2009;20:305–308. doi:10.1093/annonc/mdn627.
- Flaig TW, Wilson S, van Bokhoven A, Varella-Garcia M, Wolfe P, Maroni P, Genova EE, Morales D, Lucia MS. Detection of circulating tumor cells in metastatic and clinically localized urothelial carcinoma. Urology. 2011;78:863–867. doi:10.1016/j.urology.2011.05.045.
- Okegawa T, Hayashi K, Hara H, Nutahara K, Higashihara E. Immunomagnetic quantification of circulating tumor cells in patients with urothelial cancer. Int J Urol. 2010;17:254–258. doi:10.1111/j.1442-2042.2010.02454.x.
- Naoe M, Ogawa Y, Morita J, Omori K, Takeshita K, Shichijyo T, Okumura T, Igarashi A, Yanaihara A, Iwamoto S, et al. Detection of circulating urothelial cancer cells in the blood using the cellsearch system. Cancer. 2007;109:1439–1445. doi:10.1002/cncr.22543.
- Riethdorf S, Soave A, Rink M. The current status and clinical value of circulating tumor cells and circulating cell-free tumor DNA in bladder cancer. Transl Androl Urol. 2017;6:1090–1110. doi:10.21037/tau.2017.09.16.
- Alix-Panabieres C, Pantel K. Challenges in circulating tumour cell research. Nat Rev Cancer. 2014;14:623–631. doi:10.1038/nrc3820.
- Jolly MK, Tripathi SC, Jia D, Mooney SM, Celiktas M, Hanash SM, Mani SA, Pienta KJ, Ben-Jacob E, Levine H. Stability of the hybrid epithelial/mesenchymal phenotype. Oncotarget. 2016;7:27067–27084. doi:10.18632/oncotarget.8166.
- Lindsay CR, Faugeroux V, Michiels S, Pailler E, Facchinetti F, Ou D, Bluthgen MV, Pannet C, Ngo-Camus M, Bescher G, et al. A prospective examination of circulating tumor cell profiles in non-small-cell lung cancer molecular subgroups. Ann Oncol. 2017;28:1523–1531. doi:10.1093/annonc/mdx156.
- Lindsay CR, Le Moulec S, Billiot F, Loriot Y, Ngo-Camus M, Vielh P, Fizazi K, Massard C, Farace F. Vimentin and Ki67 expression in circulating tumour cells derived from castrate-resistant prostate cancer. BMC Cancer. 2016;16:168. doi:10.1186/s12885-016-2192-6.
- Raimondi C, Carpino G, Nicolazzo C, Gradilone A, Gianni W, Gelibter A, Gaudio E, Cortesi E, Gazzaniga P. PD-L1 and epithelial-mesenchymal transition in circulating tumor cells from non-small cell lung cancer patients: A molecular shield to evade immune system? Oncoimmunology. 2017;6:e1315488. doi:10.1080/2162402X.2017.1315488.
- Hodgson A, Liu SK, Vesprini D, Xu B, Downes MR. Basal-subtype bladder tumours show a ‘hot’ immunophenotype. Histopathology. 2018;73:748–757. doi:10.1111/his.13696.
- Robertson AG, Kim J, Al-Ahmadie H, Bellmunt J, Guo G, Cherniack AD, Hinoue T, Laird PW, Hoadley KA, Akbani R, et al. Comprehensive molecular characterization of muscle-invasive bladder cancer. Cell. 2018;174:1033. doi:10.1016/j.cell.2018.07.036.
- Anantharaman A, Friedlander T, Lu D, Krupa R, Premasekharan G, Hough J, Edwards M, Paz R, Lindquist K, Graf R, et al. Programmed death-ligand 1 (PD-L1) characterization of circulating tumor cells (CTCs) in muscle invasive and metastatic bladder cancer patients. BMC Cancer. 2016;16:744. doi:10.1186/s12885-016-2758-3.
- Mazel M, Jacot W, Pantel K, Bartkowiak K, Topart D, Cayrefourcq L, Rossille D, Maudelonde T, Fest T, Alix-Panabieres C. Frequent expression of PD-L1 on circulating breast cancer cells. Mol Oncol. 2015;9:1773–1782. doi:10.1016/j.molonc.2015.05.009.
- Nicolazzo C, Raimondi C, Mancini M, Caponnetto S, Gradilone A, Gandini O, Mastromartino M, Del Bene G, Prete A, Longo F, et al. Monitoring PD-L1 positive circulating tumor cells in non-small cell lung cancer patients treated with the PD-1 inhibitor Nivolumab. Sci Rep. 2016;6:31726. doi:10.1038/srep31726.
- Janning M, Kobus F, Babayan A, Wikman H, Velthaus JL, Bergmann S, Schatz S, Falk M, Berger LA, Bottcher LM, et al. Determination of PD-L1 expression in circulating tumor cells of NSCLC patients and correlation with response to PD-1/PD-L1 inhibitors. Cancers (Basel). 2019;11:835. doi:10.3390/cancers11060835.
- Mohme M, Riethdorf S, Pantel K. Circulating and disseminated tumour cells - mechanisms of immune surveillance and escape. Nat Rev Clin Oncol. 2017;14:155–167. doi:10.1038/nrclinonc.2016.144.
- Werner S, Frey S, Riethdorf S, Schulze C, Alawi M, Kling L, Vafaizadeh V, Sauter G, Terracciano L, Schumacher U, et al. Dual roles of the transcription factor grainyhead-like 2 (GRHL2) in breast cancer. J Biol Chem. 2013;288:22993–23008. doi:10.1074/jbc.M113.456293.
- Assmann V, Marshall JF, Fieber C, Hofmann M, Hart IR. The human hyaluronan receptor RHAMM is expressed as an intracellular protein in breast cancer cells. J Cell Sci. 1998;111:1685–1694.