
ABSTRACT
Patients with locally advanced and metastatic urothelial carcinoma have a low survival rate (median 15.7 months, 13.1–17.8), with only a 23% response rate to monotherapy treatment with anti-PDL1 checkpoint immunotherapy. To identify new therapeutic targets, we profiled the immune regulatory signatures during murine cancer development using the BBN carcinogen and identified an increase in the expression of the T cell inhibitory protein B7-H4 (VTCN1, B7S1, B7X). B7-H4 expression temporally correlated with decreased lymphocyte infiltration. While the increase in B7-H4 expression within the bladder by CD11b+ monocytes is shared with human cancers, B7-H4 expression has not been previously identified in other murine cancer models. Higher expression of B7-H4 was associated with worse survival in muscle-invasive bladder cancer in humans, and increased B7-H4 expression was identified in luminal and luminal-papillary subtypes of bladder cancer. Evaluation of B7-H4 by single-cell RNA-Seq and immune mass cytometry of human bladder tumors found that B7-H4 is expressed in both the epithelium of urothelial carcinoma and CD68+ macrophages within the tumor. To investigate the function of B7-H4, treatment of human monocyte and T cell co-cultures with a B7-H4 blocking antibody resulted in enhanced IFN-γ secretion by CD4+ and CD8+ T cells. Additionally, anti-B7-H4 antibody treatment of BBN-carcinogen bladder cancers resulted in decreased tumor size, increased CD8+ T cell infiltration within the bladder, and a complimentary decrease in tumor-infiltrating T regulatory cells (Tregs). Furthermore, treatment with a combination of anti-PD-1 and anti-B7-H4 antibodies resulted in a significant reduction in tumor stage, a reduction in tumor size, and an increased level of tumor necrosis. These findings suggest that antibodies targeting B7-H4 may be a viable strategy for bladder cancers unresponsive to PD-1 checkpoint inhibitors.
Introduction
Genetic alterations result in the expression of neoantigens that may be recognized by cells of the innate and adaptive immune system, which in turn generate the anti-tumor immune response.Citation1 However, many tumors are able to evade this response by upregulating checkpoint inhibitors that suppress immune activation, as well as tumor-infiltrating immune cells that increase the expression of regulatory proteins. Therefore, the anti-tumor immune response is dynamic and evasion of the immune system by the tumor is a hallmark of cancer. While CTLA-4 and PD-L1 are the most well-described checkpoint proteins, B7-H4 (B7S1, B7x, VTCN1), a B7-family member expressed on antigen-presenting cells and/or tumors, can inhibit T cell-mediated inflammatory responses.Citation2 B7-H4 has been primarily investigated as an inhibitor of autoimmune disease with agonistic application of the B7-H4-immunoglobulin fusion protein (B7-H4Ig) [as reviewed inCitation2]. Data show that B7-H4 functionally decreases inflammatory CD4+ T cells directly and indirectly via B7-H4-induced increases in both the number and function of regulatory CD4+ T cells (Tregs).Citation3-Citation5
B7-H4 expression in renal cell carcinoma,Citation6-Citation8 melanoma,Citation9 breast,Citation10 lung,Citation11,Citation12 gastric,Citation13 colorectal,Citation14 pancreatic,Citation15 prostate,Citation16 endometrial,Citation17 and ovarianCitation18-Citation20 cancer is associated with increased tumor size, cancer stage, metastasis, progression, poor disease prognosis, decreased survival, and/or decreased infiltration of T cells. Targeted genetic deletion of B7-H4 (Vtcn1) in an orthotopic model of liver cancer is associated with increased CD8+ T cell tumor infiltration with decreased markers of exhaustion.Citation21 Therefore, inhibition of B7-H4 may be an alternative strategy to reinvigorate tumor-specific T cell responses. Yet, the therapeutic application of B7-H4 blocking antibodies has not been demonstrated in murine models due to a lack of B7-H4 expression within tumor cell line mouse models.
Urothelial carcinoma is the fifth most common cancer in the US, and has the second-worst survival for patients with metastasis at only 5% within 5 years.Citation22 While systemic chemotherapy was the standard of care for treatment of patients with metastatic urothelial carcinoma with a median survival of 13.1 months (range 11.7 to 15.1), in 2016 antibodies targeting immune checkpoint blockade (ICB), specifically PD-1 and PD-L1 were approved by the FDA.Citation23 However, only 3-21% of patients with metastatic urothelial carcinoma that is refractory to chemotherapy will respond to ICB.Citation24 While the factors that determine clinical response are not completely known, features such as immune cell infiltration and high total mutation burden have been associated with an increased response.Citation25 Not all studies have demonstrated that PD-L1 expression is associated with improved survival following anti-PD-1 therapy, suggesting that multiple aspects of the regulation of immune responses remain unclear.Citation26 Thus, most patients with metastatic urothelial cancer are unresponsive to ICB, and these patients may benefit from additional therapies that target distinct and non-overlapping immune regulatory pathways.
Materials and methods
Tumor preparation for single-cell RNA-seq
Tumor samples were obtained prospectively after IRB approval at Northwestern (STU00088853). Tumor specimen was minced and enzymatically dissociated DMEM supplemented with Liberase TM (0.0625 mg/ml) and DNase I (Sigma, D5025, 0.2 mg/mL) for 30 min. Every 10-min specimen was gently pipetted and enzyme mix was exchanged for freshly made enzyme mix. After dissociation tissue was spun down at 1300 RPM for 7 min and filtered to through a 100 um filter to yield a single-cell suspension. Cells were spun down, resuspended in PBS supplemented with 0.5% BSA and 2 mmol/L EDTA and stained with PI (BD) and Calcein Violet (Invitrogen). Viable cells were sorted using BD FACS Aria Fusion instrument. Sorted cells were washed and resuspended in PBS containing 0.04% BSA. Cells were counted on Countess II automated cell counter (Thermo Fisher) 12,000 cells were loaded per lane onto a 10X Chromium microfluidic chip. Single-cell capture, barcoding, and library preparation were performed using the 10X Chromium version 2 chemistry according to the manufacturer’s protocol (#CG00052). cDNA and libraries were checked for quality on Agilent 4200 Tapestation and quantified by KAPA qPCR before sequencing on a single lane of a HiSeq4000 (Illumina) to an average depth of 50,000 reads per cell.
Single-cell data processing
The Cell Ranger pipeline (v1.2, 10X Genomics) was used to convert Illumina base call files to FASTQ files, align FASTQs to the GRCH38 reference (v3.0.0, 10X Genomics) for human samples to produce a digital gene-cell counts matrix. The resultant gene-cell matrix was filtered to remove cells with fewer than 500 transcripts and genes with fewer than two counts in two cells. The gene-cell matrices were then normalized such that the number of unique molecular identifiers (UMI) in each cell is equal to the median UMI count across the data set and log transformed. Expression at 1,000 highly variable genes in each data set, selected as the genes with the highest dispersion, was used to reduce the dimensionality of the data sets to three dimensions using Uniform Manifold Approximation and Projection (UMAP) and cells were clustered using Leiden-based clustering in the UMAP space. Genes of interest were plotted in UMAP space using adjusted values based on Markov Affinity-based Graph Imputation (MAGIC) of the raw gene-cell counts matrix.
Multiplexed imaging by IMC
Formalin-fixed paraffin-embedded human Ta NMIBC tissues were cut into 5-μm sections and mounted on slides. Slides were incubated for 15 min at 55°C in a dry oven, deparaffinized in fresh histoclear, and rehydrated through a series of graded alcohols. Antigen retrieval was performed in a decloaking chamber (BioSB TintoRetriever) for 15 min at 95°C in Citrate Buffer. After blocking in buffer containing 3% BSA, slides were incubated overnight at 4°C with a cocktail of metal-conjugated IMC-validated primary antibodies. The following day, slides were washed twice in Dulbecco’s Phosphate-Buffered Saline and counterstained with iridium intercalator (0.25 μmol/L) for 5 min at room temperature, to visualize the DNA. After a final wash in ddH20, the slides were air-dried for 20 min. The slides were then loaded on the Fluidigm Hyperion imaging mass cytometer. Regions of interest were selected using the acquisition software and ablated by the Hyperion. The resulting images were exported as 16-bit .tiff files using the Fluidigm MCDViewer software and analyzed using the open-source Histocat++ toolbox.
Mice and tumor staging
Mice were cared for in a fashion supervised by the ACUC at Northwestern University and all research was approved in an animal research protocol. Male C57BL/6 mice at least 6 weeks old received N-butyl-N-(4-hydroxybutyl)-nitrosamine (BBN) at a dose of 0.05% in drinking water ad libitum. After 20 weeks of exposure, mice were randomized to therapy which included treatment with IgG (200 μg/kg, BioXcell), anti-PD1 (200 μg/kg, BioXcell), and/or anti-B7-H4 (200 μg/mouse, from Amplimmune). Mice were injected with four weekly doses. At the end of treatment, animals were euthanized by CO2 with secondary cervical dislocation. Bladders were removed and divided in the sagittal plane, and either fixed in 10% formalin or snap-frozen in liquid nitrogen. Pathology was staged using human AJCC staging of the degree of bladder wall invasion.
Tumor morphometry
All paraffin-embedded surgical specimens were sent to the pathology core for hematoxylin and eosin (HE) staining. To quantify the amount of tumor in each bladder specimen, the HE stained slides were scanned at low magnification and digitized using the TissueFAXS system (TissueGnostics, Los Angeles, CA, USA). The acquired images were analyzed using HistoQuest cell analysis software (TissueGnostics).
First, the borders of the specimen were identified. This was done by using the automated region of interest (ROI) function on HistoQuest. Next, the lumen (if visible) and any non-urinary bladder components (i.e. prostate, uterus, ureter) that were included on the auto-ROI function were manually excluded. The total area of the specimen was calculated by taking the area identified by the auto-ROI function and subtracting the area of the lumen and any non-bladder component. Once the total specimen area was quantified, the tumor burden was manually quantified using the HistoQuest software. In each slide, the individual areas of the tumor were encircled (representative example shown in Supplemental Figure 4). Each area of tumor was then denoted to be either necrotic or non-necrotic tumor. Total tumor burden (including necrotic tumor) and total necrotic tumor burden were recorded for each slide. Percentage tumor burden was calculated by dividing the total tumor burden of a specimen by the total area of the specimen.
RNA extraction, library creation, and RNA-seq
Mouse tumors were ground using liquid nitrogen and a mortar and pestle, and then RNA was extracted using Trizol Reagent (Thermo Fisher Scientific) following manufacturer’s instructions. RNA quality and concentration were assessed by NanoDrop and then Qubit Fluorometric Quantitation (Thermo Fisher Scientific). Library preparation and RNAseq were performed at the NuSeq core facility (Northwestern University) using an Illumina HiSeq 2000.
Immunohistochemistry
Bladders were fixed in 10% formalin and embedded in paraffin. Four micron thick sections were used for IHC staining for CD8 (1:1000, #MA5-13263, Invitrogen) and Foxp3 (1:400, #12653, Cell Signaling). IHC was performed using a Dako Autostainer Plus instrument (Dako, CO, USA), and anti-rabbit Dako EnVision+System-HRP (Dako). For each tumor, the HRP positive cells were counted per low-power (10X objective) field. Each tumor was evaluated with at least six fields in two separate sections.
Human CD14+ monocyte plus T cell co-cultures
PMBCs from healthy donors (n = 5) (LifeSource; Evanston, IL) were collected and CD14+ monocytes were purified via AutoMacs Magnetic Bead cell separation technology. The CD14-fractions were collected, and CD4+ and CD8+ T cells purified via AutoMacs Magnetic Bead cell separation technology. The autologous CD4+ and CD8 + T cells were cryopreserved for use in the monocyte/T cell co-cultures. The CD14+ monocytes were cultured in the presence of medium alone, recombinant human IL-6, recombinant human IL-10, or recombinant human IL-6 plus recombinant human IL-10 (20 ng/ml) at 5 × 10⁶ cells/well in 6-well plates at a final volume of 2 ml in cRPMI w/10% FCS for 3 days. On day 3 of culture, the non-adherent cells were removed, and the adherent monocytes collected following incubation in presence of 1 ml of 1xDPBS containing 2 mM EDTA, and incubate the plates at 37°C for 15 min. The cryopreserved CD4+ and CD8+ T cells were thawed, washed, and stained with CFSE. For the macrophage/T cell co-cultures, the cells were cultured in flat-bottomed 96-well plates. The wells were coated with anti-CD3 (0.5 µg/ml; 100 µl/well; coating wells for 2 h at 37°C; wells washed 3x with 1x DPBS), and the appropriate amount of Control Ab or anti-B7-H4 was added. For the assessment of T cells proliferation, the T cells were collected, washed in PBS, stained with LIVE/DEAD® Fixable Aqua Dead Cell Stain (Life Technologies; Grand Island, NY), blocked with anti-CD16/32 (ThermoFisher Scientific; San Jose, CA), and then stained with the indicated antibodies – anti-CD4 (clone OKT4) or anti-CD8 (clone 3B5). Results are expressed as the mean percentage of proliferated CD4+ and CD8+ T cells. For cytokine analysis replicate wells were harvested on day +3 of co-culture and cytokine secretion determined via multiplex Luminex LiquiChip (Millipore).
Mouse lymph node cultures
Lymph nodes were collected from naïve SJL/J mice, and cells made into a single-cell suspensions. CFSE-labeled total lymph node cells (5x10⁵ cells/well) were cultured in the presence of anti-CD3 (1 µg/ml), plus Control Ig, hB7-H4Ig, anti-B7-H4, or hB7-H4Ig plus anti-B7-H4 (5 µg/ml). The cells were cultured for 5 days. For the assessment of T cells proliferation, the T cells were collected, washed in PBS, stained with LIVE/DEAD® Fixable Aqua Dead Cell Stain (Life Technologies; Grand Island, NY), blocked with anti-CD16/32 (ThermoFisher Scientific; San Jose, CA), and then stained with the indicated antibodies – anti-CD4 (clone RM4-5). Replicate wells were pulsed with 1µCi of tritiated thymidine at 24 h, and the cultures were harvested on day +5.
PLP139-151/CFA Induced EAE and DTH. 6–7 week-old female SJL/J mice were immunized s.c. with 100 μl of an emulsion containing 200 μg of M. tuberculosis H37Ra (BD Biosciences; San Jose, CA) and 50 µg of PLP139–151 distributed over three sites on the flank. Mice were treated with Control Ig, hB7-H4Ig, and anti-B7-H4 beginning at the time of priming. Mice were treated with 100 µg per dose of injections 3x per week for 2 weeks via i.p. injection. Individual animals were observed at the indicated time points and clinical scores assessed in a blinded fashion on a 0–5 scale: 0, no abnormality; 1, limp tail; 2, limp tail and hind limb weakness; 3, hind limb paralysis; 4, hind limb paralysis and forelimb weakness; and 5, moribund. The data are reported as the mean daily clinical score. On day +9 post priming, mice were assayed for delayed-type hypersensitivity (DTH). Mice were anaesthetized by inhalation of isoflurane and the thickness of both ears was measured using a dial thickness gauge. 10 µg of PLP139-151 (negative control) and OVA protein in 10 µl of PBS was injected into the left and right ear, respectively. The increase in ear thickness was determined after 24 h.
Flow cytometry
For cell, analysis spleens were dissociated into a single-cell suspensions and RBCs lysed. For the bladder leukocytes, Single-cell suspensions were prepared by mincing the bladder tissue in 2 ml of Accutase (MilliPore) plus 1 mg/ml collagenase, and the samples were incubated at 37°C for 30 min. Following the enzyme digestion, the bladder samples were disrupted with a 100 µm cell strainer, the cell strainer washed 2x with 10 ml of HBSS+ 5% FCS, and the cells pelleted. The cells were washed in PBS, stained with LIVE/DEAD® Fixable Aqua Dead Cell Stain (Life Technologies; Grand Island, NY), blocked with anti-CD16/32 (ThermoFisher Scientific), and then stained with the indicated antibodies. 106 viable cells were analyzed per individual sample using a BD LSRFortessa (BD Bioscience), and the data analyzed using FloJo Version 9.5.2 software (Tree Star, Inc.; Ashland, OR).
Bioinformatics
To compare expression across early time points of BBN exposure, the CPM values for the replicates were calculated with EdgeR and then averaged together at each time point. They were then log2 transformed and mean centered. A heatmap was produced with the R package Pheatmap.
Clinical, mRNA seq, and mutation data from The Cancer Genome Atlas (TCGA) bladder urothelial carcinoma dataset was downloaded from the Broad Institute Genome Data Analysis Center (GDAC) using TCGA data version 2016_01_28 (http://gdac.broadinstitute.org).Citation27,Citation28 Analysis was performed with R v3.5.1 utilizing Bioconductor v3.9. RNA-seq mRNA expression levels are presented as RNA-seq by expectation-maximization (RSEM) values, and z-score >2 was used to define overexpression.Citation29 Overall survival outcomes were calculated using the log-rank test and R packages survival v2.43–3 and survminer v0.4.3. Pan-cancer expression profile of B7-H4 (VTCN1) was extracted from the Broad GDAC Firehose v1.1.38 (http://firebrowse.org/). Spearman correlations between B7-H4, PD-1, PD-L1, and CTLA-4 expression and mutation, neoantigen, and APOBEC enrichment was performed using ggplot2 v3.1.0. Molecular subtypes (luminal, luminal-papillary, luminal-infiltrated, basal-squamous, and neuronal) were assigned as previously described.Citation30 Comparison of expression between subtypes was performed using Kruskal–Wallis ANOVA. Immune signatures were calculated as previously described.Citation31-Citation33 Hierarchical clustering of immune signatures in among molecular subtypes was performed with multiClust v1.4.0 and gplots v3.0.1.Citation34 Correlation heatmap of immune signatures and B7-H4 expression was created using ggplot2 v3.1.0.
For murine tumors, following quality control and adapter trimming, reads were mapped to mm10 genome using STAR,Citation35 and then counted using HTSeq.Citation36 Gene counts were converted to CPM and further analyzed in R using the Bioconductor packages limma and edgeR. Limma was used to generate MDS plots and call differentially expressed (DE) genes. Top DE genes were visualized by Volcano plots, and used for Pathway Analysis that was conducted using the Bioconductor packages TopGO and ReactomePA.Citation37 The most significant pathways (reactomeDB terms) enriched in DE genes were shown by horizontal barplots, where color intensity tracked with p-values (computed by Fisher Exact test).
Statistical Analysis Comparisons of the percentage of animals showing clinical disease were analyzed by Χ2 using Fisher’s exact probability, and two-way ANOVA with a Bonferroni posttest was used to determine statistical differences.
Results
B7-H4 expression increases during bladder cancer development and is associated with worse survival in human bladder cancer
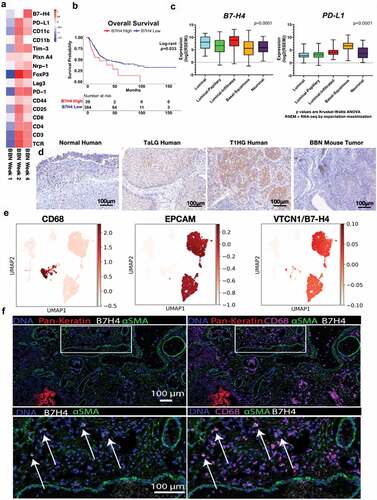
To investigate immune regulators of bladder cancer initiation and progression, we used the carcinogen-induced male C57BL/6 mouse model of bladder cancer derived from timed exposure to N-butyl-N-(4-hydroxybutyl)-nitrosamine (BBN). Our laboratory has previously validated the genomic features of this model in which tumors develop from superficial cancer and progress to muscle-invasive bladder cancer (MIBC) between three and 5 months after initial exposure.Citation38 Evaluation of the mutation signature most closely aligns with those caused by smoking, justifying the clinical relevance of BBN to human bladder cancer, in which over 60% of cancers are attributed to smoking-related carcinogens.Citation39 The BBN model offers a distinct advantage that immune effector and regulatory processes can be assessed both in the bladder and peripheral immune organs from the point of tumor initiation until the development of tumors. Therefore, C57BL/6 (B6) mice were provided BBN and gene expression profiling was performed early (1, 2, and 4 weeks) after exposure to the carcinogen. We identified an early expression profile of immune response-related genes that increased over time following BBN exposure (). This included transcripts for CD8, CD4, and pathways associated with the regulation of inflammation. For example, markers of T cell exhaustion (PD-1, LAG-3, and Tim-3) and regulation (Foxp3 and Nrp-1) increased by 2 weeks, and B7-H4, a protein expressed by APCs that is known to inhibit T cell function via both direct and indirect mechanisms,Citation5,Citation40 was significantly increased by 4 weeks and corresponded to a decrease in CD8 and CD4 transcripts present within the bladder (). To determine if B7-H4 may play a role in human bladder cancer, we evaluated the expression of B7-H4 in the cancer genome atlas for MIBC. Patients with high expression of B7-H4 had significantly worse overall survival compared to those with lower expression (21.85 vs 34.03 months, p = .03) (). Unlike other immune checkpoints (such as PD-1, PD-L1, and CTLA-4), expression of B7-H4 does not appear to correlate with neoantigens, total mutation burden, APOBEC mutations, or gene signatures (Supplemental ). We also found significant B7-H4 enrichment in the bladder tumor subtypes that had relatively low expression of PD-1, PD-L1, and CTLA-4 including luminal, luminal papillary and luminal-infiltrated tumors using the 2017 TCGA molecular subtyping classification (). While the response to anti-PD-1 therapy is correlated with the expression of PD-L1, identification of a treatment that functions independent of PD-1/PD-L1 could lead to improved overall outcomes for patients. Thus, we were interested in the localization of B7-H4 expression in bladder cancers, including localization in the tumor and tumor microenvironment. Using immunohistochemistry, we found expression of B7-H4 localized to immune cells present within healthy human bladder, with increased expression of B7-H4 in higher grade urothelial tumors as compared to low-grade urothelial tumors (, left and middle panels). While most mouse tumor in vivo models do not contain B7-H4 expressing cells, our data show that B7-H4 is expressed in the BBN mouse model, and B7-H4 expression co-localized with CD11b+ myeloid cells (, right; Supplemental Figure 2). This suggests that the expression of B7-H4 was likely localized to the myeloid lineage cells only, and B7-H4 is not expressed by the tumor cells in the BBN mouse model. These data are consistent with human tumors in which B7-H4 was not expressed in basal tumors. To confirm the localization of B7-H4 in human tumors, we performed single-cell RNA-Seq of a stage Ta high-grade bladder tumor (). VTCN1 (B7H4) mRNA was detected on both urothelial cells (EPCAM+) and myeloid cells (CD68+) by scRNA sequencing. While VTCN1 was expressed ubiquitously throughout the urothelial clusters at the mRNA transcript level, B7-H4 protein was not detected on these cells. In contrast, analysis of myeloid cells showed scattered VTCN1 expression across the myeloid cluster, and was not restricted to any one particular subcluster. To further confirm the cellular localization of B7-H4, we performed imaging mass cytometry, that demonstrated localization of B7-H4 to a subset of CD68+ myeloid cells ().
Figure 1. B7-H4 is expressed by bladder cancer and myeloid cells in human and murine bladder cancer. (a) Heat map of mRNAs of immune regulatory genes at 1, 2 and 4 weeks of BBN exposure. (b) Overall survival of the muscle invasive bladder cancers (MIBC) from the TCGA identifying worse survival for patients with high levels of VTCN1 (B7-H4). (c) Muscle invasive bladder cancers (MIBC, Stage II or greater) can be grouped by intrinsic tumor subtype. We performed subtype analysis of MIBCs from the TCGA and grouped them by subptype. In contrast to tumor subtype (like basal tumors) that express high levels of other immune regulatory proteins, like PD-L1, B7-H4 is more highly expressed in luminal and luminal-infiltrated tumors, (d) Immunohistochemistry of B7-H4 in normal human bladder, low grade noninvasive (stage TaLG), and invasive (Stage T1HG) demonstrating expression on tumor and infiltrating leuckocytes and in BBN mouse bladder tumor demonstrating expression only on infiltrating leukocytes (20X magnification). These localizations in human bladder cancer were confirmed by single-cell RNA-seq of a low-grade Ta tumor (e) showing high expression in luminal cells (EPCAM+) and scattered expression in myeloid cells (CD68+). Imaging mass cytometry applied to FFPE NMIBC section showing expression of B7H4 (white), smooth muscle actin (green) and pan-keratin (red). B7H4 was localized to the tumor stromal region (pan-keratin negative) (left). Same image as in (left) with the addition of CD68 (magenta) showing colocalization of B7H4 with a subset of CD68+ myeloid cells (right). Enlarged image of the indicated region in (left) with box. Enlarged image of indicated region from the right
Temporal expression of PD-L1 and B7-H4 and their respective ligands in BBN-induced bladder cancer
Mice given BBN develop carcinoma in situ (CIS) by 2–3 months, invasive tumors by 3 months, with progression to bulky tumors by 4 months.Citation41 We validated the RNA expression data presented in by determining how the number of CD4+ T cells, CD8+ T cells, and monocytes/macrophages changed over time during BBN-induced bladder cancer development. To do so, bladders were collected at 0.5, 1, 2, 4, and 5 months after the initiation of BBN (). The results show a biphasic pattern with regard to the number of CD4+ T cells, CD8+ T cells, and monocytes present within the bladder during BBN exposure (). Similar to our RNA-Seq results, we identified a peak in the numbers of pro-inflammatory T cells (CD4+ and CD8+ T cells) at 1 month, but there is a decline in cell numbers by 2- and 3-months concomitant with the development of carcinoma. During BBN exposure, the gradual increase in CD4+ and CD8+ T cells was associated with increased expression of the exhaustion marker, such as PD-1 (). The numbers of CD4+ T cells expressing the neuropilin-1/semaphorin3a (Nrp-1/Sema3a; B7-H4 receptor)Citation40 was increased at 1 and 5 months (), while B7-H4 receptor-positive CD8+ T cells increased at 0.5 and 1 months (). Monocytes (CD11b+/Ly6 C+/Ly6 G−) increased sharply at 1 month and subsequently decreased concordant with the decrease in T cell numbers. The infiltrating monocytes expressed PD-L1 at 1 month with a second wave of increased expression at 5 months (). There was a small peak of B7-H4+ monocytes at 1 month, followed by a decline, and a second peak concordant with tumor development and immune cell infiltration of bladder tumors at 5 months (). Additionally, the bi-phasic pattern of PD-L1 and B7-H4 expression correlated with both the numbers of CD4+ Treg () and effector CD4+ T and CD8+ T cells (), as well as the expression of the respective ligands, i.e., PD-1 and B7-H4 receptor. It should be noted that we did not identify the expression of B7-H4 on nonimmune (CD45-) cells in the BBN-induced bladder cancer model (Supplemental Figure 2). These findings confirm B7-H4 expression by bladder-infiltrating monocytes concordant with CD4+ and CD8+ T cells suggestive of induction of an anti-inflammatory regulatory mechanism by monocyte-T cell interaction within the bladder. Based on these results, we investigated the blockade of B7-H4 as a potential therapy to increase T cell responses by inhibition of B7-H4-mediated T cell regulation.
Figure 2. Bi-phasic pattern of immune bladder immune infiltration during BBN-induced cancer. Male C57BL/6 mice (n = 10 mice per group for each time point) were supplied either sterile water or sterile water containing 0.05% BBN ad libitum. On the indicated time points, 10 representative naïve control and BBN treated mice were taken for analysis. The bladders were harvested and two random bladders within each treatment group were pooled to generate a total of five analytical samples for flow cytometric analysis. The cells samples were gated as follows; for T cells (singlets, cells, live/CD45hi, CD3+/CD4+ or CD3+/CD8+ into flow plots for specified T cells markers), and for monocytes (singlets, cells, live/CD45hi, CD11b+, Ly6 C+/Ly6 G− into flow plots for specified monocyte markers). The data are presented as the mean number of each specified cell population per sample ± S.E.M. Two-way ANOVA with a Bonferroni posttest was used to determine statistical differences between naïve control and BBN-treated mice. Asterisks indicate a statistically significant difference in the number of cells present within the bladder of mice receiving BBN as compared to Control naïve mice analyzed at each time point – *p < .05, **p < .01, ***p < .001, ****p < .0001, respectively
Anti-B7-H4 blocks the immunoregulatory function of B7-H4Ig and increases both mouse and human CD4+ and CD8+ T cell function
To functionally demonstrate that anti-B7-H4 can inhibit the regulatory function of B7-H4, we tested the ability of anti-B7-H4 to block the immunoregulatory function of human B7-H4Ig (hB7-H4Ig). SJL/J lymph node cells (5x10⁵ cells/well) were labeled with CFSE, and stimulated with anti-CD3 (1 μg/ml) plus control Ig, hB7-H4Ig, and/or anti-B7-H4 (10 μg/ml) (). While anti-B7-H4 alone did not alter the extent of CD4+ T cell proliferation, the addition of anti-B7-H4 inhibited hB7-H4Ig-induced suppression of CD4+ T cell proliferation. As a secondary confirmation of the CFSE findings, replicate wells were pulsed with 3H-TdR on Day 1 and cultures harvested on Day 3. The level of 3H-TdR incorporation (counts per minute, CPM) confirmed that anti-B7-H4 blocked the inhibitory function of human B7-H4Ig (). As a further confirmation of the ability of anti-B7-H4 to block hB7-H4Ig function, SJL/J mice were primed with PLP139-151/CFA, and treated 3 times per week for 2 weeks beginning at the time of priming (Day 0) with control Ig, hB7-H4Ig, or anti-B7-H4 as indicated. Mice were observed for paralytic disease symptoms, as we previously reported,Citation5 hB7-H4Ig treatment significantly decreased disease severity (). While anti-B7-H4 treatment alone did not modulate the level of disease severity, treatment with anti-B7-H4 blocked the hB7-H4Ig-induced decrease in disease severity (). In addition, anti-B7-H4 blocked the hB7-H4Ig-induced decrease in in vivo CD4+ T cell function as measured by delayed-type hypersensitivity (DTH) responses to ear challenge with PLP139-151. Taken together, these findings demonstrate that anti-B7-H4 blocks hB7-H4Ig-induced regulatory function on mouse T cell responses both in vitro and in vivo.
Figure 3. Anti-B7-H4 blocks the immunosuppressive function of B7-H4Ig. Total LN cells were collected from naïve SJL/J mice, and cells were labeled with CFSE. CFSE-labeled lymph node cells (5x10⁵ cells/well) were cultured in the presence of anti-CD3 (1 µg/ml), plus Control Ig, hB7-H4Ig, anti-B7-H4, or hB7-H4Ig plus anti-B7-H4 (5 µg/ml). Replicate wells were pulsed with 1μCi of tritiated thymidine (3H-TdR) at 24 h, and the cultures were harvested on day +5. For the assessment of T cells proliferation, the percentage of live CD4 + T cells that diluted CFSE were gated. The level of cellular proliferation is also presented on each flow histogram as determined by 3H-TdR incorporation (∆ CPM = CPM with anti-CD3 – CPM with PBS) (a). SJL/J mice (n = 10/group) were primed with PLP139-151/CFA and treated with species and isotype-matched Control Ig, hB7-H4Ig, anti-B7-H4, or hB7-H4Ig plus anti-B7-H4 (100 μg/dose; 3x/wk; 2wks), and mice were followed for disease severity. The data are presented as the mean clinical score ± S.E.M. (b). On day +9 of the disease course the PLP139-151 in vivo DTH responses were assessed. The data are presented as the mean ear swelling ± S.E.M. for both control antigen challenge (OVA323-339) and specific antigen challenge (PLP139-151) (c). One representative experiment of three is presented. Two-way ANOVA with a Bonferroni posttest was used to determine statistical differences between the indicated treatment groups. Asterisks (***) indicates a statistically significant decrease in the PLP139-151-induced clinical EAE or DTH response in mice B7-H4Ig treated mice in comparison to mice treated with Control Ig, p < .001, respectively
To determine if anti-B7-H4 could block B7-H4-induced regulation of human T cells, CD14+ monocytes from healthy donors were cultured for 3 days with IL-10, IL-6, and IL-10 plus IL-6 (10 ng/ml). On day 3 of culture, adherent cells were collected and analyzed by flow cytometry for the expression of B7-H4, CD80, CD86, PD-L1, and PD-L2. Combined treatment of monocytes with IL-10 and IL-6 induced maximal B7-H4 expression (). Therefore, we cultured monocytes with IL-10 and IL-6 for 3 days prior to co-culture with CD4 + T cell or CD8 + T cells in the presence of anti-CD3, control, or anti-B7-H4 antibody. While the addition of anti-B7-H4 did not significantly enhance proliferation of CD4+ () or CD8+ T cells (), anti-B7-H4 induced a significant increase in the production of IFN-γ by both CD4+ and CD8+ T cells (). Thus, anti-B7-H4 blockade increased the function of both human CD4+ and CD8+ T cells stimulated with B7-H4 expressing monocytes.
Figure 4. Anti-B7-H4 treatment increase IFN-γ secretion by T cell cultured in the presence of B7-H4+ monocytes. CD14+ monocytes were sort purified from healthy donor PBMCs (n = 5) and cells were cultured in the presence of medium alone, IL-10, IL-6, or IL-10 plus IL-6 (10 ng/ml) for 3 days. The percent of resultant monocytes expressing B7-H4, CD80, CD86, PD-L1, and PD-L2 was assessed (a). Sort purified autologous CFSE-labeled CD4+ T cells (b, c) and CD8+ T cells (d, e) were co-cultured with IL-10 plus IL-6 conditioned monocytes and anti-CD3 for 3 days, and the level of proliferation was assessed via flow cytometry (b, d) and the level of secreted IFN-γ measured (c, e). Proliferation data is presented as the mean percent divided cells and concentration of IFN-γ (pg/ml) present with the culture ± S.E.M. Two-way ANOVA with a Bonferroni posttest was used to determine statistical differences between naïve control Ab and anti-B7-H4 treated cultures. Asterisks (**) indicates a statistically significant difference as compared to the control Ab treated cultures, p < .01, respectively
Anti-B7-H4 treatment increases CD8+ T cell infiltration into the bladder during BBN-induced bladder cancer and IFN-γ production by splenic CD8+ T cells
After confirmation of the functional activity of our B7-H4 antibody, we investigated if anti-B7-H4 could modulate tumor development in the BBN bladder cancer model. Mice were given BBN for 4 months followed by normal drinking water during treatment with a species and isotype-matched control antibody, anti-PD-1, or anti-B7-H4 once weekly for four total treatments (). Treatment with the anti-B7-H4 antibody led to a decrease in the number of advanced tumors (50% stage 3 or greater compared to 70% in controls), and a significant increase in the number of CD8+ bladder-infiltrating T cells (). In contrast, anti-B7-H4 treatment decreased the number of Foxp3+ Tregs (), indicating that anti-B7-H4 treatment shifted the CD8+ T cell to Treg ratio in favor of an anti-tumor response (Supplemental Figure 3). While treatment of mice with anti-PD-1 or anti-B7-H4 did not alter the number of total splenic CD45hi cells, CD4+ T cells, or CD8+ T cells present within the spleen (), both anti-PD-1 and anti-B7-H4 treatments significantly increased the number of CD8+/IFN-γ+ cells present within the spleen compared to control Ab-treated mice (). Total splenocytes from the treatment groups were activated ex vivo in the presence of anti-CD3 for 3 days to assess levels of cytokine secretion. Splenocytes from anti-B7-H4-treated mice secreted significantly higher levels of IFN-γ in response to anti-CD3 stimulation, as compared to T cells from control Ab or anti-PD-1 treated mice (). We also evaluated the gene expression profile of anti-B7-H4 treated mice, and found reestablishment of normal gene expression associated with urothelium differentiation. These changes included increased expression of bladder muscle/detrusor-related pathway transcripts, the urothelial differentiation transcript (uroplakin 3b), and decreased the expression of cell-cycle progression, mitosis, and cell-cycle checkpoint transcripts (Supplemental Figure 5). Most prominently, the response to B7-H4 was associated with decreased expression of the oncogenes Hoxb9, H19, and Egln3. The data also show metabolic changes suggestive of increased aerobic pathway usage, including the expression of Car2 (carbonic anhydrase), adh1 (alcohol dehydrogenase), and Pck1. These findings indicate that anti-B7-H4 treatment of BBN mice induced an increase in CD8+ T cell infiltration into the bladder and increased the level of IFN-γ secreted per splenic CD8+ T cell, while decreasing the number of Tregs present within the bladder.
Figure 5. Anti-B7-H4 treatment increases CD8+ T cell function. (a) Treatment schema of mice for comparison of anti-tumor response of IgG, anti-PD1 and anti-B7-H4 antibodies. (b) Representative immunohistochemistry sections of BBN tumors for anti-CD8 (top) and anti-Foxp3 (bottom) staining. All images are at low-power (100X). Quantification of the average number of CD8+(c) and Foxp3+ (d) immune cells per low-power field. The number (e) and percentage (f) of singlet/live/CD45hi cell that were CD4+/IFN-γ+, CD8+/IFN-γ+, or CD4+/CD25+/Foxp3+ present within the spleens was assessed by flow cytometry. The data are presented as the mean cell number or percentage of cells ± S.E.M. Total splenocytes were cultured in the presence of anti-CD3 (1 μg/ml) for 3 days and the level of secreted cytokine assessed. The data are presented as the mean pg/ml of secreted cytokine (g). Two-way ANOVA with a Bonferroni posttest was used to determine statistical differences between the indicated treatment groups. Asterisks (*, **, ****) indicates a statistically significant difference as compared to the control Ab-treated mice, p < .05, 0.01, 0.001, respectively. (h) BBN mice treated with anti-PD-1 and anti-B7-H4 had lower rates of T2 or higher (detrusor muscle invasion and greater) cancer compared to anti-PD1 or anti-B7-H4 alone. (i) Tumor area/bladder section (expressed a percentage of bladder section) was compared from mice with different treatments (j) Tumor necrosis (expressed as a percentage of necrosis/tumor area) was also compared between treatment types. (k) Mechanistic cartoon of proposed function B7-H4 and blockade of B7-H4 by antibody in bladder cancer
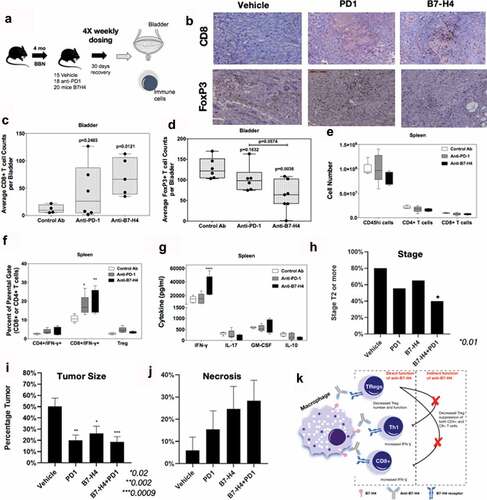
Lastly, we showed that anti-B7-H4 therapy synergized with anti-PD-1 therapy, which is the current standard of care for metastatic and chemotherapy-resistant bladder cancer. The co-treatment of mice with anti-B7-H4 and anti-PD-1 resulted in a significant reduction in advanced stage tumors (80% in vehicle-treated mice vs. 60% in anti-B7-H4 treated mice; and 40% in combination treated mice () (p = .017), decreased tumor area (51% tumor in vehicle vs. 19%, p < .009), and a trend toward increased tumor necrosis (6% in vehicle vs. 28%, p < .07) (). This suggests that the targeting of two different regulatory pathways may produce a great patient response to ICB therapy.
Discussion
Bladder cancer, similar to other solid tumors attributed to carcinogen exposure including lung cancer and melanoma, is associated with a high total mutation burden at approximately seven mutations/MB.Citation42 Systemic immunotherapy has changed the survival of patients with bladder cancer for those unresponsive to cisplatin (CIS) chemotherapy, or unable to received chemotherapy with a median progression-free survival of 10.3 months (95% confidence interval [CI], 8.0 to 11.8) compared with 7.4 months (95% CI, 6.1 to 8.3) in those treated with chemotherapy (hazard ratio for death, 0.73; 95% CI, 0.59 to 0.91; P = .002).Citation24 Recent application of anti-PD-1 and anti-PD-L1 therapy in the neoadjuvant setting has shown promising results with decreased pathologic stage and potentially improved recurrence-free survival.Citation43 Yet, less than 20% of patients treated with checkpoint immunotherapy have a clinical response and even in those with MIBC, choosing the right systemic therapy prior to cystectomy remains critical for limiting toxicity prior to surgery. Until the early reports of Phase III trials of Atezolizumab and Pembrolizumab in the first-line metastatic setting, the value to PD-L1 testing was unclear. Yet, inferior reports of response to PD-L1 low or non-expressing tumors in May of 2018 resulted in label changes for both Atezolizumab and Pembrolizumab confirming the critical association of PD-L1 immunohistochemical marker activity with the response to each therapy. Thus, patients that are PD-L1 “negative” have a low likelihood of response and are unlikely to benefit from systemic therapy targeting PD-1/PD-L1.Citation44 Due to the limitations of the current landscape of PD-1/PD-L1 therapy for bladder cancer patients, investigation of other immune checkpoints is a necessity for those unlikely to respond to PD-1/PD-L1. In our evaluation of MIBC, we found that B7-H4 is expressed in higher levels in luminal and luminal papillary tumors. This distinction separates B7-H4 from CTLA-4 and PD-L1 which are expressed at higher levels in basal-type cancers. While tumor subtyping has been performed in a small series of patients treated with anti-PD-1/PD-L1, luminal and luminal papillary tumors are the poorest responders (unpublished data andCitation23,Citation45)
To identify potential immune regulatory mechanisms involved in the immune-editing of bladder cancer, we profiled the immune landscape of the mouse BBN bladder cancer model from 2 to 20 weeks post-initiation of C57BL/6 mice receiving BBN containing water. Our group has previously validated the genomic alterations that develop in this model.Citation38 To our knowledge, we are the first to describe the immune activation that is bi-modal after BBN treatment. The present data show that there is an acute inflammatory phase that starts within 2 weeks, but then decreases between four and 12 weeks. While we observed invasion of the bladder by lymphocytes between two and 4 weeks after BBN exposure, expression of regulatory monocyte and T cell populations potentially decrease the effector CD4+ and CD8+ T cells present within the bladder until the tumor develops at 3 months. With the development of CIS and invasive bladder cancer, the number of tumors infiltrating lymphocytes increases, but these cells express markers of exhaustion (PD-L1) indicating that these cells are likely not effective in controlling tumor cell growth. Upregulation of B7-H4 expression was observed in monocytes in the BBN-treated mice, preceding both the decrease in CD8+ T cells and an increase in Tregs. This led to further functional studies of B7-H4 in the BBN bladder cancer model.
Across the various types of solid human tumors, the expression of B7-H4 is associated with worse patient survival.Citation18-Citation20 High expression of B7-H4 has been described in ovarian, endometrial, gastric, renal cell, melanoma, breast, lung, colorectal, pancreatic, and prostate cancer. Mechanistic investigation of B7-H4 in liver cancer identified that targeting B7-H4 genetically resulted in increased proliferation of CD8+ T cells with decreased levels of exhaustion transcription factors.Citation21 In the current study, we confirmed that anti-B7-H4 treatment increased CD8+ T cell activation as a mechanism of immune activation. Additionally, we found lower numbers of Foxp3+ Tregs present within the bladders of mice receiving anti-B7-H4 treatment, thereby indicating that a regulatory phenotype of the TILs had shifted toward an anti-tumor phenotype.
In addition to effects on Tregs, receptor ligation by the immune modulatory molecules, such as B7-H4, have been suggested to directly alter the phenotype of CD4+ T cells.Citation46,Citation47 Co-culture of CD4+ T cells with IL-10/TGF-β treated macrophages expressing B7-H4 decreased CD4+ T cell proliferation and increased the number of Foxp3+ CD4+ T cells.Citation48 Published data show that hB7-H4Ig binds to CD4+ T cells in an activation-dependent manner, indicating that B7-H4 may function as a co-inhibitory (negative co-stimulatory) molecule for CD4+ T cells.Citation5,Citation46,Citation49 The present data show that B7-H4 also directly interacts with a functional B7-H4 receptor on CD8 + T cells, as the addition of anti-B7-H4 to monocyte/CD8+ T cell co-cultures induced a significant increase in the level of secreted IFN-γ (). This is supported by our previous findings showing that hB7-H4Ig can down-regulate IL-17 and IFN-γ production of mouse T cells in the absence of Tregs.Citation5 Further, our in vivo data show that treatment of C57BL/6 mice with BBN-induced bladder cancer significantly increased the number of CD8+ T cells and a significantly decreased the number of Tregs present within the bladder (). This finding correlated with an increase in the percentage of IFN-γ+/CD8+ T cells present within the spleen and a significant decrease in tumor stage as compare to control Ab-treated mice. The only other investigation of immunotherapy in the BBN model reported that the ratio of CD8+ T cell to Treg cells was associated with response to anti-PD-1 antibody treatment.Citation50 While the present data show the functionality of anti-B7-H4 treatment in the presence of monocyte expressed B7-H4, B7-H4 expression by tumor cells is also a putative mechanism by which these cells evade anti-tumor immune responses. In the majority of breast and ovarian cancers, B7-H4 mRNA is expressed at approximately two-fold or greater than the level expressed within normal tissue,Citation51 and B7-H4 protein is present in half of early-stage and two-thirds of late-stage ovarian tumors.Citation52 Additionally, tumor tissues from breast, uterus, ovary, colon, and pancreas showed a statistically significant increase in the percentage of cells expressing B7-H4.Citation53 In the 4T1 metastatic breast cancer model, the transfer of tumor cells into B7-H4−/- versus wildtype mice resulted in fewer lung nodules, enhanced survival, and decreased tumor infiltration of immunosuppressive cells.Citation54 Based on these findings, expression of B7-H4 within the tumor microenvironment, either by the tumor cells and/or by infiltrating monocytes, is hypothesized to promote immune evasion. In support of this hypothesis, published data show that stimulation of the B7-H4 receptor complex via hB7-H4Ig treatment in the PLP139-151/CFA model of relapsing-remitting EAE increased the number and function of Tregs.Citation5
Our investigation identified B7-H4 as a negative regulator of T cell activity in the bladder during cancer development. The present data show that the treatment of C57BL/6 male mice receiving BBN containing water with anti-B7-H4 increases the number of CD8+ T cells and decreases the number of Tregs present within the bladder (). The anti-B7-H4 treatment-induced skewing of the CD8+ T cell to Treg ratio within the bladder correlated with a decrease in the bladder cancer stage score. Additionally, co-treatment of mice with both anti-B7-H4 and anti-PD-1 further decreased bladder cancer stage score, and such combination therapy may be considered a target for future therapeutic trials in patients with bladder cancer.
Disclosure of potential conflicts of interest
No potential conflicts of interest were disclosed.
Supplemental Material
Download ()Supplementary material
Supplemental data for this article can be accessed on the publisher’s website.
Additional information
Funding
References
- Chen DS, Mellman I. Oncology meets immunology: the cancer-immunity cycle. Immunity. 2013;39(1):1–13. doi:10.1016/j.immuni.2013.07.012.
- Podojil JR, Miller SD. Potential targeting of B7-H4 for the treatment of cancer. Immunol Rev. 2017;276(1):40–51. doi:10.1111/imr.2017.276.issue-1.
- Zang X, Loke P, Kim J, Murphy K, Waitz R, Allison JP. B7x: a widely expressed B7 family member that inhibits T cell activation. Proc Natl Acad Sci U S A. 2003;100(18):10388–10392. doi:10.1073/pnas.1434299100.
- Ichikawa M. Role of B7-H1 and B7-H4 molecules in down-regulating effector phase of T-cell immunity: novel cancer escaping mechanisms. Front Biosci. 2005;10(1–3):2856–2860. doi:10.2741/1742.
- Podojil JR, Liu LN, Marshall SA, Chiang M-Y, Goings GE, Chen L, Langermann S, Miller SD. B7-H4Ig inhibits mouse and human T-cell function and treats EAE via IL-10/Treg-dependent mechanisms. J Autoimmun. 2013;44:71–81. doi:10.1016/j.jaut.2013.04.001.
- Xu Y, Zhu S, Song M, Liu W, Liu C, Li Y, WANG M. B7-H4 expression and its role in interleukin-2/interferon treatment of clear cell renal cell carcinoma. Oncol Lett. 2014;7(5):1474–1478. doi:10.3892/ol.2014.1961.
- Krambeck AE, Thompson RH, Dong H, Lohse CM, Park ES, Kuntz SM, Leibovich BC, Blute ML, Cheville JC, Kwon ED, et al. B7-H4 expression in renal cell carcinoma and tumor vasculature: associations with cancer progression and survival. Proc Natl Acad Sci U S A. 2006;103(27):10391–10396. doi:10.1073/pnas.0600937103.
- Zhang L, Wu H, Lu D, Li G, Sun C, Song H, Li J, Zhai T, Huang L, Hou C, et al. The costimulatory molecule B7-H4 promote tumor progression and cell proliferation through translocating into nucleus. Oncogene. 2013;32(46):5347–5358. doi:10.1038/onc.2012.600.
- Quandt D, Fiedler E, Boettcher D, Marsch W, Seliger B. B7-h4 expression in human melanoma: its association with patients’ survival and antitumor immune response. Clin Cancer Res. 2011;17(10):3100–3111. doi:10.1158/1078-0432.CCR-10-2268.
- Mugler KC, Singh M, Tringler B, Torkko KC, Liu W, Papkoff J, Shroyer KR. B7-h4 expression in a range of breast pathology: correlation with tumor T-cell infiltration. Appl Immunohistochem Mol Morphol. 2007;15(4):363–370.
- Li Z-Y, Mou Y-G, Zhang X-H, Chen Y, Guo J-G, Yang S, Yang Q-Y, Chen Z-P. Clinical significance of B7-H4 expression in matched non-small cell lung cancer brain metastases and primary tumors. Onco Targets Ther. 2013;6:869–875. doi:10.2147/OTT.
- Sun Y, Wang Y, Zhao J, Gu M, Giscombe R, Lefvert AK, Wang X. B7-H3 and B7-H4 expression in non-small-cell lung cancer. Lung Cancer. 2006;53(2):143–151. doi:10.1016/j.lungcan.2006.05.012.
- Arigami T, Uenosono Y, Ishigami S, Hagihara T, Haraguchi N, Natsugoe S. Clinical significance of the B7-H4 coregulatory molecule as a novel prognostic marker in gastric cancer. World J Surg. 2011;35(9):2051–2057. doi:10.1007/s00268-011-1186-4.
- Zhao L-W, Li C, Zhang R-L, Xue H-G, Zhang F-X, Zhang F, Gai X-D. B7-H1 and B7-H4 expression in colorectal carcinoma: correlation with tumor FOXP3+ regulatory T-cell infiltration. Acta Histochem. 2014;116(7):1163–1168. doi:10.1016/j.acthis.2014.06.003.
- Chen Y, Zhao H, Zhu D, zhi Q, He S, Kuang Y, Li D, Zhang Z, Song S, Zhang L, et al. The coexpression and clinical significance of costimulatory molecules B7-H1, B7-H3, and B7-H4 in human pancreatic cancer. Onco Targets Ther. 2014;7:1465–1472. doi:10.2147/OTT.
- Zang X, Thompson RH, Al-Ahmadie HA, Serio AM, Reuter VE, Eastham JA, Scardino PT, Sharma P, Allison JP. B7-H3 and B7x are highly expressed in human prostate cancer and associated with disease spread and poor outcome. Proc Natl Acad Sci U S A. 2007;104(49):19458–19463. doi:10.1073/pnas.0709802104.
- Cheung SS, Ou D, Metzger DL, Meloche M, Ao Z, Ng SS, Owen D, Warnock GL. B7-H4 expression in normal and diseased human islet β cells. Pancreas. 2014;43(1):128–134. doi:10.1097/MPA.0b013e31829695d2.
- Tringler B, Liu W, Corral L, Torkko KC, Enomoto T, Davidson S, Lucia MS, Heinz DE, Papkoff J, Shroyer KR, et al. B7-H4 overexpression in ovarian tumors. Gynecol Oncol. 2006;100(1):44–52. doi:10.1016/j.ygyno.2005.08.060.
- Zhang -L-L, Shao S-L, Wu Y. Expressions of osteopontin and B7-H4 in epithelial ovarian neoplasm and their significance. Chin J Cancer. 2010;29(1):24–28. doi:10.5732/cjc.009.10158.
- Kryczek I, Wei S, Zhu G, Myers L, Mottram P, Cheng P, Chen L, Coukos G, Zou W. Relationship between B7-H4, regulatory T cells, and patient outcome in human ovarian carcinoma. Cancer Res. 2007;67(18):8900–8905. doi:10.1158/0008-5472.CAN-07-1866.
- Li J, Lee Y, Li Y, Jiang Y, Lu H, Zang W, Zhao X, Liu L, Chen Y, Tan H, et al. Co-inhibitory molecule B7 superfamily member 1 expressed by tumor-infiltrating myeloid cells induces dysfunction of anti-tumor CD8+ T cells. Immunity. 2018;48(4):773–86 e5. doi:10.1016/j.immuni.2018.03.018.
- Zhang Y, Zhu C, Curado MP, Zheng T, Boyle P. Changing patterns of bladder cancer in the USA: evidence of heterogeneous disease. BJU Int. 2012;109(1):52–56. doi:10.1111/bju.2012.109.issue-1.
- Rosenberg JE, Hoffman-Censits J, Powles T, van der Heijden MS, Balar AV, Necchi A, Dawson N, O’Donnell PH, Balmanoukian A, Loriot Y, et al. Atezolizumab in patients with locally advanced and metastatic urothelial carcinoma who have progressed following treatment with platinum-based chemotherapy: a single-arm, multicentre, phase 2 trial. Lancet (London, England). 2016;387(10031):1909–1920. doi:10.1016/S0140-6736(16)00561-4.
- Bellmunt J, de Wit R, Vaughn DJ, Fradet Y, Lee J-L, Fong L, Vogelzang NJ, Climent MA, Petrylak DP, Choueiri TK, et al. Pembrolizumab as second-line therapy for advanced urothelial carcinoma. N Engl J Med. 2017;376(11):1015–1026. doi:10.1056/NEJMoa1613683.
- Cristescu R, Mogg R, Ayers M, Albright A, Murphy E, Yearley J, Sher X, Liu XQ, Lu H, Nebozhyn M, et al. Pan-tumor genomic biomarkers for PD-1 checkpoint blockade-based immunotherapy. Science (New York, NY. 2018;362(6411):eaar3593. doi:10.1126/science.aar3593.
- Fares CM, Van Allen EM, Drake CG, Allison JP, Hu-Lieskovan S. Mechanisms of resistance to immune checkpoint blockade: why does checkpoint inhibitor immunotherapy not work for all Patients? Am Soc Clin Oncol Educ Book Am Soc Clin Oncol. 2019;39(39):147–164. doi:10.1200/EDBK_240837.
- Marx V. Drilling into big cancer-genome data. Nat Methods. 2013;10(4):293–297. doi:10.1038/nmeth.2410.
- Center BITGDA. Analysis overview for bladder urothelial carcinoma (primary solid tumor cohort) - 28. Broad Institute of MIT and Harvard; 2016. doi:10.7908/C19G5M58.
- Li B, Dewey CN. RSEM: accurate transcript quantification from RNA-Seq data with or without a reference genome. BMC Bioinformatics. 2011;12(1):323. doi:10.1186/1471-2105-12-323.
- Robertson AG, Kim J, Al-Ahmadie H, Bellmunt J, Guo G, Cherniack AD, Hinoue T, Laird PW, Hoadley KA, Akbani R, et al. Comprehensive molecular characterization of muscle-invasive bladder cancer. Cell. 2018;174(4):1033. doi:10.1016/j.cell.2018.07.036.
- Bindea G, Mlecnik B, Tosolini M, Kirilovsky A, Waldner M, Obenauf AC, Angell H, Fredriksen T, Lafontaine L, Berger A, et al. Spatiotemporal dynamics of intratumoral immune cells reveal the immune landscape in human cancer. Immunity. 2013;39(4):782–795. doi:10.1016/j.immuni.2013.10.003.
- Faruki H, Mayhew GM, Serody JS, Hayes DN, Perou CM, Lai-Goldman M. Lung adenocarcinoma and squamous cell carcinoma gene expression subtypes demonstrate significant differences in tumor immune landscape. J Thorac Oncol. 2017;12(6):943–953. doi:10.1016/j.jtho.2017.03.010.
- Glaser AP, Fantini D, Wang Y, Yu Y, Rimar KJ, Podojil JR, Miller SD, Meeks JJ. APOBEC-mediated mutagenesis in urothelial carcinoma is associated with improved survival, mutations in DNA damage response genes, and immune response. Oncotarget. 2018;9(4):4537–4548. doi:10.18632/oncotarget.v9i4.
- Lawlor N, Fabbri A, Guan P, George J, Karuturi RK. multiClust: an R-package for identifying biologically relevant clusters in cancer transcriptome profiles. Cancer Inform. 2016;15:103–114. doi:10.4137/CIN.S38000.
- Dobin A, Davis CA, Schlesinger F, Drenkow J, Zaleski C, Jha S, Batut P, Chaisson M, Gingeras TR. STAR: ultrafast universal RNA-seq aligner. Bioinformatics. 2013;29(1):15–21. doi:10.1093/bioinformatics/bts635.
- Anders S, Pyl PT, Huber W. HTSeq–a Python framework to work with high-throughput sequencing data. Bioinformatics. 2015;31(2):166–169. doi:10.1093/bioinformatics/btu638.
- Yu G, He Q-Y. ReactomePA: an R/Bioconductor package for reactome pathway analysis and visualization. Mol Biosyst. 2016;12(2):477–479. doi:10.1039/C5MB00663E.
- Fantini D, Glaser AP, Rimar KJ, Wang Y, Schipma M, Varghese N, Rademaker A, Behdad A, Yellapa A, Yu Y, et al. A Carcinogen-induced mouse model recapitulates the molecular alterations of human muscle invasive bladder cancer. Oncogene. 2018;37(14):1911–1925. doi:10.1038/s41388-017-0099-6.
- Fantini D, Seiler R, Meeks JJ. Molecular footprints of muscle-invasive bladder cancer in smoking and nonsmoking patients. Urol Oncol. 2018;37(11):818–825.
- Podojil JR, Chiang M-Y, Ifergan I, Copeland R, Liu LN, Maloveste S, Langermann S, Liebenson D, Balabanov R, Chi H, et al. B7-H4 modulates regulatory CD4 + T cell induction and function via ligation of a semaphorin 3a/plexin A4/neuropilin-1 complex. J Immunol. 2018;201(3):897–907. doi:10.4049/jimmunol.1700811.
- Shin K, Lim A, Odegaard JI, Honeycutt JD, Kawano S, Hsieh MH, Beachy PA. Cellular origin of bladder neoplasia and tissue dynamics of its progression to invasive carcinoma. Nat Cell Biol. 2014;16(5):469–478. doi:10.1038/ncb2956.
- Chalmers ZR, Connelly CF, Fabrizio D, Gay L, Ali SM, Ennis R, Schrock A, Campbell B, Shlien A, Chmielecki J, et al. Analysis of 100,000 human cancer genomes reveals the landscape of tumor mutational burden. Genome Med. 2017;9(1):34. doi:10.1186/s13073-017-0424-2.
- Necchi A, Anichini A, Raggi D, Briganti A, Massa S, Luciano R, Colecchia M, Giannatempo P, Mortarini R, Bianchi M, et al. Pembrolizumab as neoadjuvant therapy before radical cystectomy in patients with muscle-invasive urothelial bladder carcinoma (PURE-01): an open-label, single-arm, phase II study. J Clin Oncol. 2018;JCO1801148.
- Grande E, Galsky M, Arranz Arija JA, De Santis M, Davis ID, De Giorgi UFF, Mencinger M, Kikuchi E, Garcia Del Muro X, Gumus M, et al. LBA14_PRIMvigor130: efficacy and safety from a phase III study of atezolizumab (atezo) as monotherapy or combined with platinum-based chemotherapy (PBC) vs placebo + PBC in previously untreated locally advanced or metastatic urothelial carcinoma (mUC). Annals of Oncology. 2019;30(Supplement_5):v888–v889. doi:10.1093/annonc/mdz394.047.
- Kim J, Kwiatkowski D, McConkey DJ, Meeks JJ, Freeman SS, Bellmunt J, et al. The cancer genome atlas expression subtypes stratify response to checkpoint inhibition in advanced urothelial cancer and identify a subset of patients with high survival probability. Eur Urol. 2019;75(6):961–964. doi:10.1016/j.eururo.2019.02.017.
- Sica GL, Choi I-H, Zhu G, Tamada K, Wang S-D, Tamura H, Chapoval AI, Flies DB, Bajorath J, Chen L, et al. B7-H4, a molecule of the B7 family, negatively regulates T cell immunity. Immunity. 2003;18(6):849–861. doi:10.1016/S1074-7613(03)00152-3.
- Choi I-H, Zhu G, Sica GL, Strome SE, Cheville JC, Lau JS, Zhu Y, Flies DB, Tamada K, Chen L, et al. Genomic organization and expression analysis of B7-H4, an immune inhibitory molecule of the B7 family. J Immunol. 2003;171(9):4650–4654. doi:10.4049/jimmunol.171.9.4650.
- Cao Q, Wang Y, Zheng D, Sun Y, Wang Y, Lee VW, Zheng G, Tan TK, Ince J, Alexander SI, et al. IL-10/TGF-β–modified macrophages induce regulatory T cells and protect against adriamycin nephrosis. J Am Soc Nephrol. 2010;21(6):933–942. doi:10.1681/ASN.2009060592.
- Wei J, Loke P, Zang X, Allison JP. Tissue-specific expression of B7x protects from CD4 T cell-mediated autoimmunity. J Exp Med. 2011;208(8):1683–1694. doi:10.1084/jem.20100639.
- Saito R, Smith CC, Utsumi T, Bixby LM, Kardos J, Wobker SE, Stewart KG, Chai S, Manocha U, Byrd KM, et al. Molecular subtype-specific immunocompetent models of high-grade urothelial carcinoma reveal differential neoantigen expression and response to immunotherapy. Cancer Res. 2018;78(14):3954–3968. doi:10.1158/0008-5472.Can-18-0173.
- Salceda S, Tang T, Kmet M, Munteanu A, Ghosh M, Macina R, Liu W, Pilkington G, Papkoff J. The immunomodulatory protein B7-H4 is overexpressed in breast and ovarian cancers and promotes epithelial cell transformation. Exp Cell Res. 2005;306(1):128–141. doi:10.1016/j.yexcr.2005.01.018.
- Simon I, Katsaros D, Rigault de la Longrais I, Massobrio M, Scorilas A, Kim NW, Sarno MJ, Wolfert RL, Diamandis EP. B7-H4 is over-expressed in early-stage ovarian cancer and is independent of CA125 expression. Gynecol Oncol. 2007;106(2):334–341. doi:10.1016/j.ygyno.2007.03.035.
- Qian Y, Shen L, Cheng L, Wu Z, Yao H. B7-H4 expression in various tumors determined using a novel developed monoclonal antibody. Clin Exp Med. 2011;11(3):163–170. doi:10.1007/s10238-010-0125-2.
- Abadi YM, Jeon H, Ohaegbulam KC, Scandiuzzi L, Ghosh K, Hofmeyer KA, Lee JS, Ray A, Gravekamp C, Zang X, et al. Host b7x promotes pulmonary metastasis of breast cancer. J Immunol. 2013;190(7):3806–3814. doi:10.4049/jimmunol.1202439.