
ABSTRACT
A missense mutation in RHOA encoding p.Gly17 Val has been reported to occur frequently in angioimmunoblastic T-cell lymphoma (AITL). Here, we describe a murine model which expresses the human RHOA mutant gene product in a T-cell specific manner and develops AITL-like symptoms. Most transgenic mice feature with latency one or two enlarged lymph nodes characterized by aberrant lymph node architecture, extensive lymphocytic infiltration, extrafollicular meshwork of follicular dendritic cells (FDC) and arborized endothelial venules. Importantly, we provide evidence for expansion of PD-1+ follicular helper T (Tfh) cells which are the neoplastic cells of AITL. In addition, we saw proliferation of B-cells leading to hypergammaglobulinemia and the presence of dominant T cell clonal populations. Transplantation of lymph node cells to immunocompromised mice partly recreated lymphadenopathy after a long latency and with low penetrance suggesting that cells have undergone partial transformation to a premalignant state. Transcriptomic profiling revealed that the gene expression pattern within affected lymph nodes of the mice closely resembles that of AITL patients with the identical RHOA p.Gly17 Val mutation. The murine model should, therefore, be useful in dissecting pathogenesis of AITL at the molecular level particularly for the cases with the RHOA p.Gly17Val mutation.
Introduction
AITL is a rare and distinct subtype of peripheral T-cell lymphoma (PTCL) mostly affecting elderly people in their 6th and 7th decades.Citation1,Citation2 AITL is marked by a high rate of lymphadenopathy, hepatosplenomegaly, and bone marrow involvement; hypergammaglobulinemia, hemolytic anemia, and skin rash are also observed although less frequently.Citation1-Citation3 The 5-year overall survival is only 33%, indicative of the aggressive nature of AITL and lack of effective therapy.Citation3 Histopathological features of affected lymph nodes include effacement of follicular architecture, proliferation of endothelial venules and expansive network of FDC although different stages and subtypes show considerable variations.Citation2,Citation4 Our understanding of AITL was dramatically boosted with the identification of follicular helper T (Tfh) cells as the cells of origin.Citation5,Citation6 Tfh cell markers including BCL6, CD10, CXCR5, ICOS, and PD-1 expressed in neoplastic cells have subsequently enabled a more definitive diagnosis of AITL.Citation1,Citation7 Activation of CXCL13-expressing cells also partly explains B-cell abnormalities seen in AITL such as dysregulated B-cell growth and hypergammaglobulinemia.Citation6,Citation8,Citation9
Yet another major leap was made with the advent of massively parallel sequencing. Recurrent somatic mutations which potentially represent the so-called driver mutations have been reported for various tumors including T-cell lymphomas. Most remarkable for AITL was the isolation of p.Gly17Val mutation in RHOA.Citation10-Citation12 RHOA encodes a highly conserved small GTPase belonging to the RAS superfamily and regulates diverse cellular processes including cell survival, cell cycle progression, and cytoskeleton regulation. The mutation, although also found at low frequencies in other T-cell lymphomas, is seen in over 60% of patient samples indicating that RHOA p.Gly17Val is the most specific recurrent ‘driver’ mutation for AITL described to date.Citation10-Citation12 Mechanistically, the mutation, which occurs in the GTP binding domain, leads to inhibition of GTP binding and sequestration of the partner guanine exchange factor. This loss-of-function mutation generates a dominant negative version abrogating wild type RHOA activity thereby potentially compromising the inhibitory signal of RHOA on cell proliferation.Citation10-Citation12
Although some of the analyses carried out in vitro have provided data consistent with the proposed effects of RHOA p.Gly17Val, an animal model carrying this mutation showing AITL-like phenotypes would not only represent strong evidence for its oncogenic role but also provide a new opportunity for dissection of molecular pathogenesis and a new tool for the development of therapeutic strategies. Two recent studies reported murine model systems expressing RHOA p.Gly17Val in a CD4 + T-cell-specific manner.Citation13,Citation14 Upon combining with homozygous null mutation in Tet2 gene, AITL-like phenotypes were attained. Here, we describe a novel mouse model for AITL expressing human RHOA with p.Gly17Val mutation under the control of murine Lck distal promoter which in the absence of further genetic manipulations develops multiple AITL-like phenotypic traits.
Materials and methods
Generation of transgenic mouse
The plan for this study was approved by the Institutional Animal Care and Use Committee (IACUC) of Ewha Womans University. The murine Lck distal promoter region from −3037 to +41 was PCR-amplified from pw120 plasmid.Citation15,Citation16 This was ligated to a DNA fragment containing RHOA p.Gly17Val coding sequence with HA epitope at the N-terminus.Citation12 Further details of cloning procedures are available upon request. Pronuclear injection was performed on FVB/NJ mice eggs, and a transgenic line was established based on genotyping results. The oligonucleotide primers used for confirmation of transgenic line and genotyping were 5ʹ-CTCCCTCAGTATGAGTAGAAGC-3ʹ, 5ʹ-CCGTCGTAGTCACCACCTG-3ʹ, and 5ʹ-GCACATACACCTCTGGGAAC-3ʹ.
Isolation of lymphocytes, RNA preparation, and RT-PCR
Lymphocytes were isolated from thymus and lymph nodes. After staining with antibodies for CD4 (clone GK1.5, Cat. 552051, BD Biosciences, San Jose, CA, USA) and CD8 (clone 53–6.7, Cat. 553031, BD Biosciences), cells were sorted using BD FACSAria. RNA was extracted using Trizol reagent, and cDNA was synthesized using GoScript Reverse Transcriptase PCR (Promega, Madison, WI, USA). The oligonucleotide primers used to detect transgene expression were 5ʹ-CATACGACGTCCCAGACTACGCT-3ʹ and 5ʹ-GCACATACACCTCTGGGAAC-3ʹ. For quantitative real-time RT-PCR, SYBR select master mix (Cat. 4472908, Applied Biosystems, Foster City, CA, USA) was used in combination with CFX96 Touch Real-Time PCR Detection System (BioRad, Hercules, CA, USA). The oligonucleotide primers used are listed in Supplementary material, Figure S8.
Immunoblotting
CD4+ lymphocytes were isolated using CD4 + T Cell Isolation Kit (Miltenyi Biotec, Bergisch, Germany). Whole lymph nodes and CD4+ lymphocytes were lysed in RIPA buffer (50 mM Tris HCl pH 8.0, 150 mM NaCl, 2 mM EDTA, 1% Nonidet P-40, 0.5% sodium deoxycholate, 0.1% SDS, 10 mM NaF) containing protease inhibitors (Sigma-Aldrich, St. Louis, MO, USA). Anti-RHOA antibody (Cat. 2117, Cell Signaling Technology, Beverly, MA, USA) and anti-Tubulin antibody (Cat. SAB3501072, Sigma-Aldrich) were used to detect proteins which were visualized using enhanced chemiluminescence detection kit (Amersham-Pharmacia Biotech, Piscataway, NJ, USA).
Histology
Lymph nodes were fixed in 10% neutral buffered formalin and embedded in paraffin. Sections were typically four μm thick and stained with hematoxylin and eosin (H&E). For immunohistochemistry, sections were boiled in citrate-based solution to retrieve antigens and subsequently quenched in 3% hydrogen peroxide. Antibodies used included anti-CD21 (Cat. ab75985, Abcam, Cambridge, MA, USA), MECA79 (Cat. 53-6036-80, eBioscience, San Diego, CA, USA), anti-PD-1 (Cat. AF1021, R&D systems, Minneapolis, MN, USA), anti-CD3 (Cat. ab5690, Abcam), anti-PAX5 (Cat. sc-1974, Santa Cruz Biotechnology, Dallas, TX, USA), anti-CD4 (Cat. 14–0042, eBioscience), anti-CD8 (Cat. 14–0081, eBioscience), anti-CD138 (Cat. AF3190, R&D Systems) and anti-HA (Cat. 3724, Cell Signaling Technology). Horseradish peroxidase-coupled secondary antibodies (Vector Laboratories, Burlingame, CA, USA) were used in combination with DAB for visualization. For immunofluorescence staining, sections were stained with Alexa Fluor 488 conjugated anti-GL7 (Cat. 144611, BioLegend, San Diego, CA, USA) and anti-CD4 (Cat. 14–0042, eBioscience). Secondary antibody for anti-CD4 was goat anti-Rat IgG (H + L) Alexa Fluor 594 (Cat. A11007, Invitrogen, Carlsbad, CA, USA).
Flow cytometry
For flow cytometric analyses of B cell populations, single cells were first prepared from lymph nodes by grinding with sieve. After staining with fluorescein isothiocyanate-labeled antibodies for CD19 (clone 1D3, Cat. 557398, BD Biosciences), cells were counted with BD LSRFortessa (BD Biosciences) and analyzed using BD FACSDiva software (BD Biosciences) and FlowJo software (FlowJo, Ashland, OR, USA). For flow cytometric analyses of Tfh cells, lymphocytes were stained with antibodies to CD4 (clone GK1.5, Cat. 552051, BD Biosciences), B220 (clone RA3-6B2, Cat. 562290, BD Biosciences), CD11b (clone M1/70, Cat. 563015, BD Biosciences), PD-1 (clone J43, Cat. 562584, BD Biosciences), CXCR5 (clone 2G8, Cat. 560615, BD Biosciences) and counted with BD LSRFortessa Cytometry (BD Biosciences).
ELISA
Mouse blood was collected by cardiac puncture, and the serum was obtained after centrifugation. IgG levels were measured with ELISA kit (Cat. ab151276, Abcam) following the manufacturer’s protocol.
Examination of clonality of T cells and B cells
T-cell receptor (TCR) β-chain diversity was examined by nested 5ʹ RACE PCR. Total RNA was isolated from lymph nodes of 20-month-old mice using Trizol reagent. RNA was processed for reverse-transcription using GeneRacer kit (Invitrogen) according to the manufacturer’s protocol. TCR β-chain was amplified by GeneRacer 5ʹ oligonucleotide primer (5ʹ-CGACTGGAGCACGAGGACACTGA-3ʹ) and an oligonucleotide primer (5ʹ-GTGGAGCTGAGCTGGTGGGTGAATGG-3ʹ) from the constant region of β-chain. Second amplification was performed with GeneRacer 5ʹ nested oligonucleotide primer (5ʹ-GGACACTGACATGGACTGAAGGAGTA-3ʹ) and a fluorescent nested oligonucleotide primer (5ʹ- CTTCCCTGACCACGTGGAGCTGAGC-3ʹ) also from the constant region of β-chain. Final PCR products were analyzed by capillary electrophoresis using ABI PRISM 3730XL DNA analyzer and Gene Scan Version 1.2 software (Applied Biosystems, Foster City, CA). Clonality of B cells was examined following a protocol based on a previous publication with minor modifications.Citation17 Briefly, IgM heavy chain transcripts were reverse-transcribed and amplified via two rounds of PCR with three oligonucleotide primers. In the first round, J588-F (5ʹ-AAGGCCACACTGACTGTAGAC-3ʹ) and IgM.3ʹ-R (5ʹ- CTGGATCCGGCACATG CAGATCTC-3ʹ) were used, and in the second round J588-F and the fluorescent nested primer JH2-R (5ʹ-GACTGTGAGAGTGGTGCCTTG-3ʹ) were used. The PCR products were examined as above.
Cell transplantation
We injected 5 × 10⁵ or 2 × 10⁶ cells prepared either from affected lymph nodes or spleens of RHOA p.Gly17Val mice to NSG mice (NOD.Cg-PrkdcscidIl2rgtm1Wjl/SzJ; The Jackson Laboratory, Bar Harbor, ME, USA) via tail vein. Mice were sacrificed in 6 months, and lymph nodes were examined by immunohistochemistry and H&E staining.
Transcriptome analysis
Total RNA was extracted from mouse tissues, and mRNA libraries were prepared using the TruSeq Stranded mRNA Preparation kit (Illumina, San Diego, CA, USA) according to the manufacturer’s instructions. RNA sequencing (RNA-Seq) was performed with Illumina HiSeq2500 sequencing platform for 101-mer paired-end reads. Fastx_toolkit was used for trimming adapter sequences and discarding low quality reads. The reads were mapped against the mouse reference genome (mm10) using STAR alignment program (version 2.5.3a).Citation18 RSEM (version 1.2.12) was used to quantify the transcriptome abundance.Citation19 Differentially expressed genes (DEGs) were identified using DESeq2 with the P-value <0.05 threshold.Citation20 Gene set analyses of DEGs for pathways and gene ontology (GO) terms were performed using WebGestalt, and Gene Set Enrichment Analysis (GSEA) was used to test for the enrichment of Tfh gene signature.Citation21,Citation22 We also called variants from RNA-seq data following the GATK best practices workflow for RNAseq (GATK v4.1.4.1).Citation23 Specifically, the read group information was added to STAR alignment output, followed by marking duplicates and sorting. Next, SplitNCigarReads was used to clip out overhang regions due to intron alignment. After recalibration, SNPs and INDELs were called with the HaplotypeCaller. Lastly, resulting mutations were annotated with annovar (2018Apr16 version). The RNAseq data have been deposited in the Gene Express Omnibus (GEO) database [GEO: GSE115510].
Clustering and correlation analyses
Transcriptome profiling data for lymphoma patients including AITL, PTCL-NOS (peripheral T-cell lymphoma, not otherwise specified), and DLBCL (diffuse large B-cell lymphoma) were collected from the GEO database. RNA-Seq data of 9 AITL patients were downloaded from SRP029591 which also provided the status of RHOA p.Gly17Val mutation.Citation12 Microarray data of additional 18 AITL patients whose RHOA mutation status is also known were downloaded from GSE51521. In addition, microarray data were downloaded from four different cohorts (GSE6338, GSE11318, GSE34143, and GSE36172) which constituted a collection of 6 AITL, 68 PTCL-NOS, and 203 DLBCL patients plus 12 reactive lymph nodes and 20 normal T cell samples.Citation24-Citation27 Sequencing data were processed with the same pipeline for our mouse transcriptome data except using the human reference genome (hg19), and Affymetrix microarray data were analyzed using RMA normalization. Subsequently, we performed the between-study normalization to remove batch effect using ComBat algorithm in the Bioconductor sva package.Citation28 To compare gene expression between human and mouse data sets, mouse genes were converted to human orthologues according to the MGI Vertebrate Homology database.Citation29
Results
Generation of RHOA p.Gly17Val transgenic mouse model
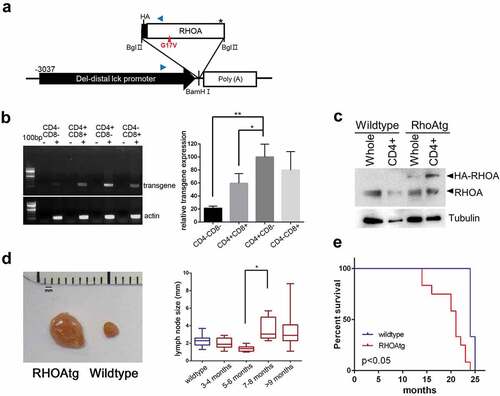
In order to generate a murine model that expresses human RHOA p.Gly17Val in a T-cell specific manner, we chose the distal promoter of mouse lymphocyte-specific protein-tyrosine kinase (lck) gene.Citation15,Citation16 The span of the genomic region we chose (−3037 to +41) encompasses the essential elements for proper expression of transgene during T-cell development.Citation16 We used this promoter to express HA epitope-tagged RHOA p.Gly17Val ()) which has been previously characterized for its dominant negative activity to the wild type version.Citation12 The murine lck distal promoter is active primarily in mature thymocytes and peripheral T-cells and has successfully been used to express ectopic oncogenes for induction of T-cell lymphoma.Citation15,Citation30 Transgenic mice expressed RHOA p.Gly17Val most highly in CD4+CD8−, but expression was also seen in CD4−CD8+ and CD4+CD8+ as well as at very low levels in CD4−CD8− cells indicating that they are expressed more strongly as T-cell matures particularly into CD4+ cells ()). Immunoblotting indicates that transgenic protein is expressed highly in CD4+ subset of the lymph node cells and at least as abundantly as the wild type RHOA ()). Virtually all of the transgenic mice developed one or two enlarged lymph nodes after 7–8 month time point. Using lymphadenopathy as the major and most highly penetrant symptom, a latency of 6 to 7 months appears to be typical prior to overt initiation of the pathogenesis ()). We also noted modest but statistically significant splenomegaly in transgenic mice examined by the 12-month point (supplementary material, Figure S1). Consistent with the long latency, most transgenic mice survived over 15 months, but the average life span was significantly shorter than that of wild type mice from the litter mate groups ().
Figure 1. RHOA p.Gly17Val transgenic mice develop asymmetric lymphadenopathy. (a) A schematic diagram of transgene expression vector. Blue arrowheads indicate oligonucleotide primers for genotyping. (b) RT-PCR analysis shows that the transgene is most highly expressed in CD4+CD8− population. The graph on the right side shows results from three independent real-time RT-PCR analyses as means ± S.D. (*) and (**) represent P-values < 0.05 and <0.01, respectively. (c) Immunoblotting for RHOA protein. Note HA-tagged RHOA is seen only in the transgenic mice. Tubulin was used as loading control. (d) Asymmetric lymphadenopathy is seen in virtually all transgenic mice after a prolonged latency. A lymph node from 20-month-old mouse is seen next to a lymph node from an age-matched littermate wild type control mouse. Lymph node sizes of transgenic mice grouped into indicated age brackets. Note the significant increase in the 7–8 month group. (*) represents P-value < 0.05 from t-test. (e) Life span is significantly shortened in RHOA p.Gly17Val transgenic mice. P-value < 0.05 from log-rank test.
Histopathological and immunological examination of the murine model
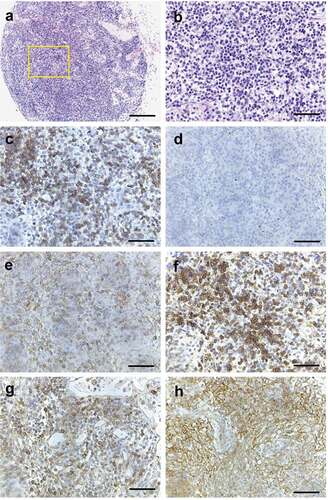
We next carried out histological analyses of the enlarged lymph nodes. In contrast to wild type lymph nodes, where primary lymphoid follicles were observed in the cortex (), lymph nodes of RHOA p.Gly17Val transgenic mice were characterized by mixed cortical and paracortical hyperplasia with increased secondary lymphoid follicles undergoing germinal center reaction and extensive plasma cell infiltration in the expanded medulla (). Occasionally, infiltrating polymorphonuclear leukocytes and scattered immunoblasts were also observed (). Lymphoid follicles were populated by B cells as shown by PAX5 immunostaining ()), and paracortical areas were populated by CD3+, CD4 + T cells, sometimes in nodular aggregates (, also see ). Cancer cells of AITL are believed to be of Tfh origin. Tfh cells are PD-1+ and normally present in follicles and function in regulating B cell development.Citation5-Citation7 Indeed, we found a limited number of PD-1+ cells within the follicles of wild type lymph node (supplementary material, Figure S2, Figure S3). In contrast, large numbers of PD-1 and CD4 double-positive cells were observed in interfollicular area as well as within the follicles (marked by dendritic CD21+ cells in ) throughout the structurally disorganized lymph nodes in transgenic mice (; supplementary material, Figure S3 and S4). Of note, CD21+ cells with dendritic pattern were occasionally observed in extra-germinal center area accompanied by infiltration of PD-1+ cells (; also see supplementary material, Figure S2). Another major feature of AITL is the proliferation of high endothelial venules (HEV) in the affected lymph nodesCitation2,Citation4 which was readily seen via staining with MECA-79 antibody in the transgenic mice (; supplementary material, Figure S2). Lymphocytic infiltration, plasma cell infiltration, and PD-1+ cell expansion were also seen in spleen (supplementary material, Figure S1), but extranodal organs including lung, liver, pancreas, kidney had no notable lymphocytic infiltration (supplementary material, Figure S5). Of note, up to 20% of the transgenic mice showed skin rashes by the 12-month point. The location or extent of the skin rashes was not correlated with the location or the number of affected lymph nodes. On close examination, the rashes appeared to involve erosion, dermal thickening, and chronic inflammation with ulceration. Microscopic examination revealed fibroblast proliferation and epidermis hyperplasia as well as infiltration of lymphocytes and neutrophils (supplementary material, Figure S5). These are features consistent with autoimmune reaction (see Discussion).
Figure 2. Histopathology of enlarged RHOA p.Gly17Val transgenic lymph nodes. (a, b) A lymph node from wild type mouse shows lymphoid aggregates in the cortex without germinal centers. The boxed region in A is shown in an enlarged form in B. (c, d). A lymph node from mutant mouse shows mixed cortical and paracortical hyperplasia with lymphoid follicles with germinal centers (GC). The boxed region in C is shown in an enlarged form in D. (e) The medullary area of lymph node is infiltrated by numerous plasma cells with readily recognizable morphology (see the higher magnification inset; also see supplementary material, Figure S2). (f, g) Occasionally, neutrophil infiltration (F and inset) and immunoblasts (G and arrow) are noted. (h-l) Immunoarchitecture of lymph node is shown by PAX5 (h), CD3 (i, j) and CD4 (k, l) staining. The boxed regions in I and K are shown in enlarged forms in J and L, respectively. (m–r) Sections from transgenic lymph nodes were also stained for PD-1 (m, n, q) and CD21 (o, p, r). The boxed regions in M and O are shown in enlarged forms in N and P, respectively. The region with asterisks in M and O are shown in enlarged forms in Q and R, respectively. Germinal center (arrow) is highlighted by nodular aggregates of CD21+ cells with dendritic pattern (o, p). PD-1+ cells are frequently observed in interfollicular area as well as within germinal center (m, n, q). Of note, CD21+ cells are also observed in extra-germinal center area (asterisks; O, R), where PD-1+ cells are also present (asterisks; M, Q). (s, t) Sections from transgenic lymph nodes are stained with MECA79 antibody specific for HEV. The boxed region in S is shown in enlarged forms in T. Scale bars represent: 10 μm for G; 50 μm B, E, F, J, L, Q, R, and T; 100 μm for D, H, N, and P.; 200 μm for A, M, O, and S; 500 μm for C, I and K.
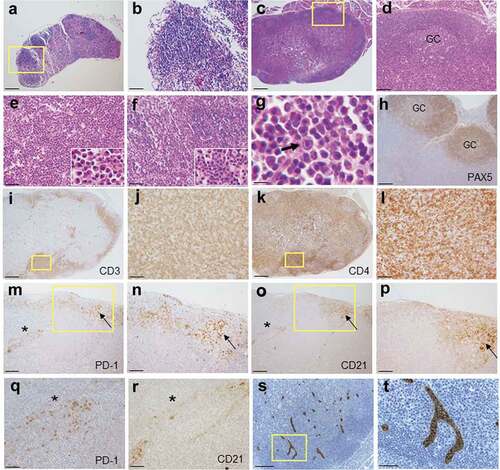
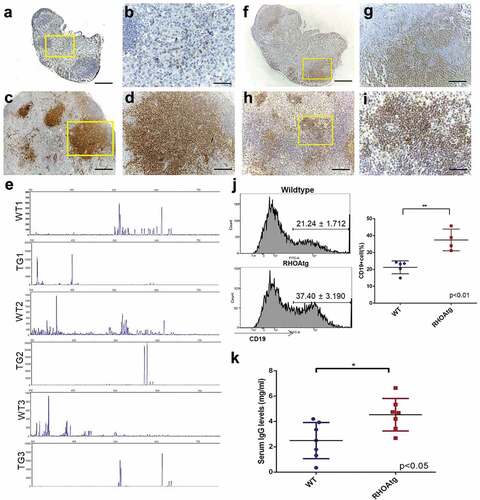
Figure 4. T-cell clonality and B-cell expansion in RHOA p.Gly17Val mice. (a-d) Sections from wild type (a, b) and transgenic (c, d) lymph nodes are stained with anti-CD3 antibody. The boxed regions in A and C are shown in enlarged forms in B and D, respectively. Note the scattered T-cells seen outside follicles in the wild type lymph node and the large clusters of T-cell colonies in the enlarged transgenic lymph node. (e) Lymph nodes from 3 litter mate pairs of wild type (WT) and transgenic (TG) mice were used for examination of TCR β chain diversity. 5ʹRACE PCR amplification of rearranged TCR β chain was carried out with oligonucleotide primers corresponding to the constant region. Products ranging from approximately 350 to750 bps in length were expected. Gene Scan results are consistent with oligo-clonality for affected transgenic lymph nodes. Wild type (f, g) and enlarged transgenic (h, i) lymph nodes were stained with anti-PAX5 antibody. The boxed regions in F and H are shown in enlarged forms in G and I respectively. Note the restricted localization of B-cells within the follicle in the wild type lymph node and scattered B cell clusters throughout the affected lymph node of the transgenic mouse. (j) Proportions of B cell are higher in the enlarged transgenic lymph nodes. Histograms from flow cytometric analyses using anti-CD19 are shown. The graph on the right side shows results from independent mouse samples. (**) represents P-value < 0.01 from t-test. (k) Results from ELISA show approximately two-fold increase in the serum IgG level in transgenic mice. (*) represents P-value < 0.05 from t-test. Scale bars represent: 50 μm for B, D, G, and I; 200 μm for A, C, F, and H.
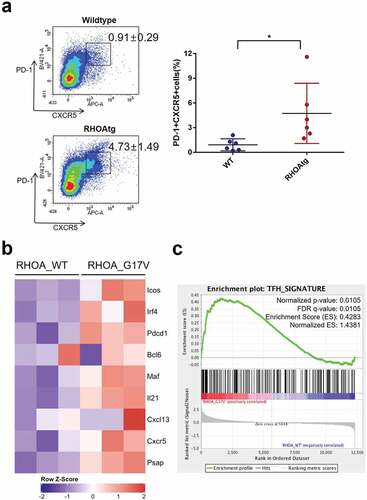
In order to confirm proliferation of Tfh cells, we examined constitution of CD4+ cells by flow cytometry. The proportion of Tfh cells, i.e., PD-1+ CXCR5+ cells among CD4+ B220- CD11b- cells were significantly increased in transgenic mice compared to that in wild type mice (). Consistently, gene expression profiling by RNAseq indicated increased expression of multiple markers of Tfh cells including Icos, PD-1, and Bcl6 ()). Also, gene set enrichment analysis showed a clear enrichment of Tfh signature among CD4+ cells isolated from lymph nodes of RHOA p.Gly17Val transgenic mice ()). Of note, there was no mutation in Tet2 or Tet3 genes among CD4+ cells from either mutant or wild type lymph nodes although we found a novel polymorphic sequence (Tet3:NM_183138:exon11:c.C4521 G:p.D1507E; Tet3:NM_001347313:exon12:c.C4926 G:p.D1642E) for the latter gene. Apparently, C57BL/6 strain has C while FVB/NJ strain used for transgenic mouse generation and NOD SCID mice originating from BALB/c strain have G at this position.
Figure 3. Increase in the number of Tfh cells in the enlarged transgenic lymph nodes. (a) The proportions of Tfh cells among helper T-cells were determined using the lymph nodes from wild type and transgenic mice. CD4+ B220- CD11b-cells were analyzed for the expression of PD-1 and CXCR5 following the protocol described in Baumjohann and Ansel, Nat. Protoc., doi.org/10.1038/protex.2013.060. Note the significant increase in PD-1+ CXCR5+ Tfh cells in the affected transgenic lymph nodes. Graph on the right side summarizes results from multiple samples (n = 6). (*) represents P-value <0.05 from t-test. (b) Heatmap representation of Tfh-associated markers in CD4 + T cells from WT and RHOA p.Gly17Val transgenic mice. (c) Gene set enrichment analysis indicates enrichment of Tfh signature.
Several studies have reported mono- or oligo-clonality of T-cells within affected lymph nodes of AITL patients.Citation1,Citation4,Citation8,Citation31 Consistently, staining for CD3 in the affected lymph nodes typically revealed the presence of nodular aggregates of T-cells suggestive of clonal expansion while in wild type lymph nodes only scattered T cells were seen in the medullary region (). We examined the composition of T-cells by amplifying TCR β chain using 5ʹRACE technique in combination with a pair of nested oligonucleotide primers. GeneScan analysis indicated that a highly diverse T-cell population is present in the wild type lymph nodes consistent with the typical gene rearrangement. In contrast, a far more limited repertoire of TCR was observed in affected transgenic lymph nodes consistent with oligo-clonality of T-cells ()). Infiltration of B-cells in the lymph nodes and hypergammaglobulinemia has also been frequently reported in AITL.Citation1,Citation3,Citation9 In addition to the secondary lymphoid follicles, we noted the presence of PAX5+ cells throughout the affected lymph nodes often in clusters outside the cortex where B cells are typically seen in wild type lymph nodes (–i)). In fact, there were significantly increased proportions of B-cells in affected lymph nodes ()) and levels of serum IgG in transgenic mice ()). Clonal expansion of B-cells in AITL patients has also been reported.Citation32,Citation33 We thus examined the composition of B-cells by amplifying the variable region of IgM heavy chain gene by two rounds of PCR. GeneScan analysis indicated that a highly diverse B-cell population is present in the wild type lymph nodes. In contrast, a more limited repertoire of IgM heavy chains marked by the presence of over-represented clones was seen in the affected transgenic lymph nodes consistent with clonal expansion of B-cells (supplementary material, Figure S6).
Allogenic transplantation of lymph node and spleen cells
In order to examine the transformation status of Tfh cells in the transgenic mice, we transplanted lymph node and spleen cells from RHOA p.Gly17Val mice into six NSG mice. Specifically, two mice were transplanted with 5 × 10⁵ lymph node cells, another two with 2 × 10⁶ lymph node cells, and the other two with 5 × 10⁵ spleen cells. The recipient mice stayed healthy with no external symptoms for 6 months at which point they were sacrificed. One of the two mice with 5 × 10⁵ lymph node cells transplanted showed a single enlarged lymph node. H&E staining showed clear lymphocytic infiltration (). Most were positive for CD3 ()) while PAX5 + B-cells were absent ()). Importantly, a large proportion was positive for CD4 ()), and HA and PD-1 positive cells were readily seen consistent with the presence of RHOA p.Gly17Val+ Tfh cells (). Furthermore, the lymphocytic infiltration was accompanied by the presence of CD21+ follicular dendritic cells ()). The data are consistent with that RHOA p.Gly17Val+ Tfh cells have transplantable phenotype albeit weakly so (see Discussion). We examined exonic sequences of Tet2 with genomic DNA extracted from the affected lymph node and found no mutation (supplementary material, Figure S7). Given that most mutations found in TET2 gene among AITL patients are found within the protein-coding sequence, this result strongly suggests that it is RHOA p.Gly17Val mutation alone and not a subsequent Tet2 mutation that enabled transplantation of Tfh cells albeit to a limited extent.
Figure 5. Histopathology of NSG mouse lymph node transplanted with enlarged lymph node cells from RHOA p.Gly17Val mouse. (a, b) H&E staining of single enlarged lymph node from transplanted NSG mouse. Note lymphocytic infiltration. (c) CD3 staining shows presence of T cells. (d) PAX5 + B cells are missing. (e) CD4+ cells are found. (f) HA staining shows presence of transgenic cells. PD-1 staining (g) and CD21 staining (h) are consistent with partial replication of original transgenic phenotype. Scale bars represent: 200 μm for A; 50 μm for the rest.
Transcriptomic analyses of the murine model
To obtain molecular characteristics of enlarged lymph nodes in RHOA mutant mice, we performed transcriptome sequencing for nine lymph nodes, including four affected samples (enlarged lymph nodes from RHOA p.Gly17Val transgenic mice), three control samples (lymph nodes from wild type littermates) and two seemingly normal (i.e., not enlarged) lymph nodes from transgenic mice. Our computational pipeline of STAR-RSEM-DESeq2 identified 701 DEGs (373 down-regulated genes and 328 up-regulated genes; supplementary material, File S1) in 4 affected samples compared to 3 control samples. The RNAseq results were confirmed by RT-PCR using four genes from each of the up- and down-regulated gene sets (supplementary material, Figure S8). Hierarchical clustering of nine lymph nodes using these 701 DEGs showed distinct grouping of control and affected samples in which 2 seemingly normal lymph nodes from RHOA p.Gly17Val transgenic mice were grouped together with the control samples ()). Altered pathways were determined by gene set analysis for 701 DEGs using Webgestalt web application for KEGG pathways and gene ontology (GO) terms. The most significant KEGG pathways were related to ‘protein processing in ER’ (FDR = 1.04e-11), ‘T cell receptor signaling pathway’ (FDR = 2.79e-05) and ‘TNF signaling pathway’ (FDR = 4.28e-05) ()). GO enrichment analysis was carried out for up- and down-regulated genes separately ()). Biological processes for 373 down-regulated genes were associated with ‘immune system process’ (FDR = 0) and ‘T cell activation’ (FDR = 8.31e-11). In contrast, 328 up-regulated genes were enriched in biological processes associated with ‘response to endoplasmic ER’ (FDR = 2.79e-10) and ‘cell adhesion’ (FDR = 6.63e-06). Overall, up-regulated genes were significantly enriched in protein processing and down-regulated genes were significantly enriched in immune system and T cell receptor signaling pathways. Again examination of the RNA sequences revealed that no mutation took place in Tet2 or Tet3 other than the C > G polymorphism in Tet3.
Figure 6. Expression correlation analyses of RHOA p.Gly17Val transgenic mice. (a) Heatmap view of RNA-seq data for mouse tissues using differentially expressed genes (DEGs) comparing four affected transgenic samples (i.e., enlarged lymph nodes), two unaffected transgenic samples and three control samples (from litter mates). (b, c) Gene set analysis by WebGestalt for statistical enrichment of 701 DEGs in KEGG pathways and Gene Ontology (GO) biological processes. Red vertical lines represent the FDR threshold of 0.05. (d) Distribution of pairwise correlation coefficients of 4 RHOA p.Gly17Val transgenic mice with 33 AITL patient tumors, 68 PTCL-NOS patient tumors, 203 DLBCL patient tumors, 12 reactive lymph nodes (RLN), and 20 normal T cell samples. Note the highest correlation between RHOA transgenic mice and AITL patients. The P-values for AITL vs PTCL-NOS, AITL vs DLBCL, AITL vs RLN and AITL vs Normal comparisons were = 1.47e-12, < 2.2e-16, < 2.2e-16 and < 2.2e-16, respectively, according to the Wilcoxon rank sum test. (e) Distribution of pairwise correlation coefficients of RHOA p.Gly17Val transgenic mice with 14 and 13 AITL patients with and without RHOA p.Gly17Val mutation, respectively. Note the higher correlation with patients with the mutation (P-value of 2.97e-3).
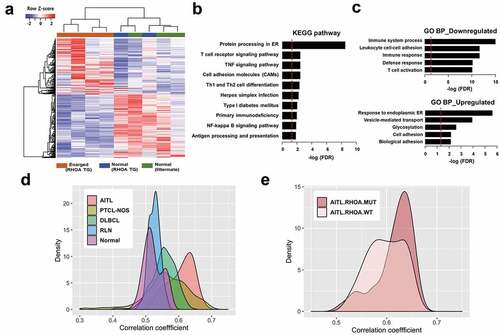
We next sought to use gene expression pattern to identify the type of human lymphoma which our murine model most closely simulates. Given that human data are from gross profiling using biopsy samples, we reasoned that data from similar gross profiling of lymph nodes would be appropriate for comparison. Public expression data for three types of lymphoma, AITL, PTCL-NOS, and DLBCL as well as for reactive lymph nodes and normal T cells were obtained, and gene expression profiles were compared using 571 genes that were successfully converted from the 701 mouse DEGs to human orthologues (see Materials and Methods). Specifically, we computed the Pearson correlation coefficients between all possible pairs of transgenic mice and human samples. Then, we compared the distribution curves of correlation coefficients for all five human sample types which were clearly separated (P-value < 0.0001) and showed the highest correlation with AITL patients ()). The low correlation between our murine model and reactive lymph nodes indicates that the phenotypes we see in the affected lymph nodes are not routine inflammatory responses. We proceeded to compare distribution curves for two groups, with and without RHOA p.Gly17Val mutation, which showed that the murine gene expression is more closely correlated with AITL cases with mutations than those without ()). The separation of distributions was weaker than that among the three different types of lymphoma but was still statistically significant with P-value of 2.97e-3. Collectively, the transcriptomic data indicate that our mouse model simulates AITL more closely than other types of lymphoma and in particular best matches AITL caused by RHOA p.Gly17Val mutation.
Discussion
The phenotypes seen in lymph nodes of AITL originate not just from proliferation of tumor cells but in large part from interactions among diverse cell types found in lymphoid organs and in circulation. This leads to unique histopathological features including proliferation of HEV and meshwork of FDC as well as massive infiltration of lymphocytes and hypergammaglobulinemia. That Tfh cells constitute a minor population of the tumor mass has put certain restrictions in dissecting pathogenesis at the molecular level. At the same time, understanding cellular interactions within the microenvironment of the lymphoid organs became an important issue for AITL. Clearly, an animal model with causally linked genetic lesion and faithful phenocopying of the clinical cases is of value as it would provide an in vivo test bed for molecular dissection and therapeutic attempts.
Our murine model is based on a defined single driver mutation RHOA p.Gly17Val found in a significant proportion of AITL patients. Gross phenotypic outcomes including considerable latency, asymmetric lymph node enlargement, and shortened life span are closely correlated with those seen in AITL patients. Many of the histopathological features of the RHOA p.Gly17Val mutant mice also simulate those observed in typical human AITL. Specifically, the murine model exhibits multiple features important for the pathogenesis of AITL including increase in Tfh cells, hypergammaglobulinemia with germinal center reaction and plasmacytosis, infiltration of mixed inflammatory cells (i.e., PMN), proliferation of HEV and extension of FDC meshwork. We also find skin lesions involving immune reactions in a minor population of the mice suggesting possibly an autoimmune reaction as seen in AITL patients, but further comparative work is necessary to conclude the simulation of clinical conditions.
Recently, two other studies reported murine models that express RHOA p.Gly17Val in CD4+ cells. Cortes and coworkers showed that the conditional expression of the transgene drives proliferation of Tfh cells and that transplantation of the cells also carrying Tet2 null mutation into isogenic recipients induced AITL-like lymphoma.Citation13 Likewise, Ng and coworkers showed that RHOA p.Gly17Val mutation in CD4+ cells led to Tfh cell expansion and autoimmunity and upon further Tet2 loss also to AITL-like lymphoma.Citation14 Importantly, in both studies, no lymphadenopathy or lymphomagenesis-like phenotype was observed upon expression of RHOA p.Gly17Val alone, i.e., in the absence of Tet2 loss. This is in clear contrast to our murine model.
Interestingly, aside from lymphadenopathy and other AITL-like phenotype, lymph node cells from our model could partly recreate AITL-like phenotypes including expansion of Tfh cells and FDC upon transplantation to immunocompromised mice. Given that transplantation was marked by low penetrance and long latency and failed to generate apparent ill health, it would seem as though Tfh cells in our model have not reached full-blown transformation status and are perhaps in preneoplastic state that can simulate early stages or slow progression of AITL development. The difference from other studies may stem from the choice of promoter which could affect the level of RHOA p.Gly17Val protein. At least Ng and coworkers describe the transgene expression level in detail. In their murine model, the transgene RNA level is about 60% of the wild type RHOA mRNA, and the combined protein expression level is comparable to that in wild type.Citation14 In our case, the mutant protein is at least as highly expressed as the wild type protein in the CD4+ cells. This seems to imply that the absolute and relative expression levels of the mutant protein are likely higher in our case.
A recent study using microdissected PD-1+ cells demonstrated that TET2 mutations among AITL patients were far more frequent than previously estimated.Citation34 Furthermore, TET2 mutations were also found among B cells in more than 50% of the examined AITL cases. Of note, these B cells with TET2 mutations were often polyclonal and proposed to be possibly linked to B cell phenotypes in AITL including the B cell lymphoma eventually seen in a minority of AITL patients.Citation34,Citation35 Taken together with results from transplantation experiment, it appears that although RHOA p.Gly17Val mutation can function as the major etiological factor for classical AITL phenotypes, mutations in other genes such as TET2 and DNMT3A are likely required to set the stage for full blown pathogenesis among AITL patients. Consistently, we found no Tet2 mutation in transplanted cells which showed limited penetrance and limited effect on the recipient mouse.
We carried out transcriptomic analyses to examine the correlation with human AITL particularly in the cases with RHOA p.Gly17Val mutation. We were interested in seeing if the overall gene expression pattern encompassing both the cells directly responsible for the phenotype and the heterogeneous cells indirectly responding to progression of the disease simulates AITL closely. Apparently, the gene expression profile of the transgenic lymph node simulates that of AITL more closely than those of other lymphoma types or of reactive lymph nodes. Furthermore, the degree of similarity was significantly higher for lymph nodes from AITL patients with RHOA p.Gly17Val mutation. This, in turn, suggests a potential utility of this model in dissecting the distinct molecular pathogenesis of RHOA p.Gly17Val-driven AITL and in refining future therapeutics development which is currently focused on epigenetic modifiers including hypomethylating agents.
Disclosure of Potential Conflicts of Interest
The authors declare that they have no conflicts of interest.
Supplemental Material
Download ()Acknowledgments
We thank T Nakayama and H Hosokawa of Chiba University for providing pw120 plasmids. This work was supported by the National Research Foundation of Korea (NRF-2015K1A4A3047851) funded by the Ministry of Science and ICT, Republic of Korea and by the Technology Innovation Program (10050154) of the Ministry of Trade, Industry and Energy, Republic of Korea.
Supplementary material
Supplemental data for this article can be accessed on the publisher’s website.
Additional information
Funding
References
- de Leval L, Gisselbrecht C, Gaulard P. Advances in the understanding and management of angioimmunoblastic T-cell lymphoma. Br J Haematol. 2010;148(5):673–12. doi:10.1111/bjh.2010.148.issue-5.
- Lunning MA, Vose JM. Angioimmunoblastic T-cell lymphoma: the many-faced lymphoma. Blood. 2017;129(9):1095–1102. doi:10.1182/blood-2016-09-692541.
- Federico M, Rudiger T, Bellei M, Nathwani BN, Luminari S, Coiffier B, Harris NL, Jaffe ES, Pileri SA, Savage KJ, et al. Clinicopathologic characteristics of angioimmunoblastic T-cell lymphoma: analysis of the international peripheral T-cell lymphoma project. J clin oncol. 2013;31(2):240–246. doi:10.1200/JCO.2011.37.3647.
- Attygalle AD, Chuang -S-S, Diss TC, Du M-Q, Isaacson PG, Dogan A. Distinguishing angioimmunoblastic T-cell lymphoma from peripheral T-cell lymphoma, unspecified, using morphology, immunophenotype and molecular genetics. Histopathology. 2007;50(4):498–508. doi:10.1111/his.2007.50.issue-4.
- de Leval L, Rickman DS, Thielen C, Reynies AD, Huang Y-L, Delsol G, Lamant L, Leroy K, Brière J, Molina T, et al. The gene expression profile of nodal peripheral T-cell lymphoma demonstrates a molecular link between angioimmunoblastic T-cell lymphoma (AITL) and follicular helper T (TFH) cells. Blood. 2007;109(11):4952–4963. doi:10.1182/blood-2006-10-055145.
- Grogg KL, Attygalle AD, Macon WR, Remstein ED, Kurtin PJ, Dogan A. Angioimmunoblastic T-cell lymphoma: a neoplasm of germinal-center T-helper cells? Blood. 2005;106(4):1501–1502. doi:10.1182/blood-2005-03-1083.
- Vinuesa CG, Linterman MA, Yu D, MacLennan ICM. Follicular Helper T Cells. Annu Rev Immunol. 2016;34(1):335–368. doi:10.1146/annurev-immunol-041015-055605.
- Attygalle A, Al-Jehani R, Diss TC, Munson P, Liu H, Du M-Q, Isaacson PG, Dogan A. Neoplastic T cells in angioimmunoblastic T-cell lymphoma express CD10. Blood. 2002;99(2):627–633. doi:10.1182/blood.V99.2.627.
- Ree HJ, Kadin ME, Kikuchi M, Ko YH, Go JH, Suzumiya J, Kim DS. Angioimmunoblastic lymphoma (AILD-type T-cell lymphoma) with hyperplastic germinal centers. Am J Surg Pathol. 1998;22(6):643–655. doi:10.1097/00000478-199806000-00001.
- Palomero T, Couronné L, Khiabanian H, Kim M-Y, Ambesi-Impiombato A, Perez-Garcia A, Carpenter Z, Abate F, Allegretta M, Haydu JE, et al. Recurrent mutations in epigenetic regulators, RHOA and FYN kinase in peripheral T cell lymphomas. Nat Genet. 2014;46(2):166–170. doi:10.1038/ng.2873.
- Sakata-Yanagimoto M, Enami T, Yoshida K, Shiraishi Y, Ishii R, Miyake Y, Muto H, Tsuyama N, Sato-Otsubo A, Okuno Y, et al. Somatic RHOA mutation in angioimmunoblastic T cell lymphoma. Nat Genet. 2014;46(2):171–175. doi:10.1038/ng.2872.
- Yoo HY, Sung MK, Lee SH, Kim S, Lee H, Park S, Kim SC, Lee B, Rho K, Lee J-E, et al. A recurrent inactivating mutation in RHOA GTPase in angioimmunoblastic T cell lymphoma. Nat Genet. 2014;46(4):371–375. doi:10.1038/ng.2916.
- Cortes JR, Ambesi-Impiombato A, Couronné L, Quinn SA, Kim CS, da Silva Almeida AC, West Z, Belver L, Martin MS, Scourzic L, et al. RHOA G17V Induces T Follicular Helper Cell Specification and Promotes Lymphomagenesis. Cancer Cell. 2018;33(2):259–273 e7. doi:10.1016/j.ccell.2018.01.001.
- Ng SY, Brown L, Stevenson K, deSouza T, Aster JC, Louissaint A, Weinstock DM. RhoA G17V is sufficient to induce autoimmunity and promotes T cell lymphomagenesis in mice. Blood. 2018;132(9):935–947. doi:10.1182/blood-2017-11-818617.
- Wildin RS, Garvin AM, Pawar S, Lewis DB, Abraham KM, Forbush KA, Ziegler SF, Allen JM, Perlmutter RM. Developmental regulation of lck gene expression in T lymphocytes. J Exp Med. 1991;173(2):383–393. doi:10.1084/jem.173.2.383.
- Wildin RS, Wang HU, Forbush KA, Perlmutter RM. Functional dissection of the murine lck distal promoter. J Immunol. 1995;155(3):1286–1295.
- Delassus S, Gey A, Darche S, Cumano A, Roth C, Kourilsky P. PCR-based analysis of the murine immunoglobulin heavy-chain repertoire. J Immunol Methods. 1995;184(2):219–229. doi:10.1016/0022-1759(95)00091-N.
- Dobin A, Davis CA, Schlesinger F, Drenkow J, Zaleski C, Jha S, Batut P, Chaisson M, Gingeras TR. STAR: ultrafast universal RNA-seq aligner. Bioinformatics. 2013;29(1):15–21. doi:10.1093/bioinformatics/bts635.
- Li B, Dewey CN. RSEM: accurate transcript quantification from RNA-Seq data with or without a reference genome. BMC Bioinformatics. 2011;12(1):323. doi:10.1186/1471-2105-12-323.
- Love MI, Huber W, Anders S. Moderated estimation of fold change and dispersion for RNA-seq data with DESeq2. Genome Biol. 2014;15(12):550. doi:10.1186/s13059-014-0550-8.
- Subramanian A, Tamayo P, Mootha VK, Mukherjee S, Ebert BL, Gillette MA, Paulovich A, Pomeroy SL, Golub TR, Lander ES, et al. Gene set enrichment analysis: a knowledge-based approach for interpreting genome-wide expression profiles. Proc Natl Acad Sci U S A. 2005;102(43):15545–15550. doi:10.1073/pnas.0506580102.
- Wang J, Vasaikar S, Shi Z, Greer M, Zhang B. WebGestalt 2017: a more comprehensive, powerful, flexible and interactive gene set enrichment analysis toolkit. Nucleic Acids Res. 2017;45(W1):W130–W137. doi:10.1093/nar/gkx356.
- McKenna A, Hanna M, Banks E, Sivachenko A, Cibulskis K, Kernytsky A, Garimella K, Altshuler D, Gabriel S, Daly M, et al. The Genome Analysis Toolkit: a MapReduce framework for analyzing next-generation DNA sequencing data. Genome Res. 2010;20(9):1297–1303. doi:10.1101/gr.107524.110.
- Lenz G, Wright GW, Emre NCT, Kohlhammer H, Dave SS, Davis RE, Carty S, Lam LT, Shaffer AL, Xiao W, et al. Molecular subtypes of diffuse large B-cell lymphoma arise by distinct genetic pathways. Proc Natl Acad Sci U S A. 2008;105(36):13520–13525. doi:10.1073/pnas.0804295105.
- Piccaluga PP, Agostinelli C, Califano A, Rossi M, Basso K, Zupo S, Went P, Klein U, Zinzani PL, Baccarani M, et al. Gene expression analysis of peripheral T cell lymphoma, unspecified, reveals distinct profiles and new potential therapeutic targets. J Clin Invest. 2007;117(3):823–834. doi:10.1172/JCI26833.
- Ha SY, Sung J, Ju H, Karube K, Kim SJ, Kim WS, Seto M, Ko Y-H. Epstein-Barr virus-positive nodal peripheral T cell lymphomas: clinicopathologic and gene expression profiling study. Pathol Res Pract. 2013;209(7):448–454. doi:10.1016/j.prp.2013.04.013.
- Martin-Sanchez E, Rodriguez-Pinilla SM, Sanchez-Beato M, Lombardia L, Dominguez-Gonzalez B, Romero D, Odqvist L, Garcia-Sanz P, Wozniak MB, Kurz G, et al. Simultaneous inhibition of pan-phosphatidylinositol-3-kinases and MEK as a potential therapeutic strategy in peripheral T-cell lymphomas. Haematologica. 2013;98(1):57–64. doi:10.3324/haematol.2012.068510.
- Johnson WE, Li C, Rabinovic A. Adjusting batch effects in microarray expression data using empirical Bayes methods. Biostatistics. 2007;8(1):118–127. doi:10.1093/biostatistics/kxj037.
- Blake JA, Eppig JT, Kadin JA, Richardson JE, Smith CL, Bult CJ. Mouse Genome Database (MGD)-2017: community knowledge resource for the laboratory mouse. Nucleic Acids Res. 2017;45(D1):D723–D729. doi:10.1093/nar/gkw1040.
- Ohsugi T, Kumasaka T, Okada S, Urano T. The Tax protein of HTLV-1 promotes oncogenesis in not only immature T cells but also mature T cells. Nat Med. 2007;13(5):527–528. doi:10.1038/nm0507-527.
- Tan BT, Warnke RA, Arber DA. The frequency of B- and T-cell gene rearrangements and epstein-barr virus in T-cell lymphomas: a comparison between angioimmunoblastic T-cell lymphoma and peripheral T-cell lymphoma, unspecified with and without associated B-cell proliferations. J Mol Diagn. 2006 quiz 527;8(4):466–475. doi:10.2353/jmoldx.2006.060016.
- Feller AC, Griesser H, Schilling CV, Wacker HH, Dallenbach F, Bartels H, Kuse R, Mak TW, Lennert K. Clonal gene rearrangement patterns correlate with immunophenotype and clinical parameters in patients with angioimmunoblastic lymphadenopathy. Am J Pathol. 1988;133:549–556.
- Smith JL, Hodges E, Quin CT, McCarthy KP, Wright DH. Frequent T and B cell oligoclones in histologically and immunophenotypically characterized angioimmunoblastic lymphadenopathy. Am J Pathol. 2000;156(2):661–669. doi:10.1016/S0002-9440(10)64770-0.
- Schwartz FH, Cai Q, Fellmann E, Hartmann S, Mäyränpää MI, Karjalainen-Lindsberg M-L, Sundström C, Scholtysik R, Hansmann M-L, Küppers R, et al. TET2 mutations in B cells of patients affected by angioimmunoblastic T-cell lymphoma. J Pathol. 2017;242(2):129–133. doi:10.1002/path.2017.242.issue-2.
- Lemonnier F, Mak TW. Angioimmunoblastic T-cell lymphoma: more than a disease of T follicular helper cells. J Pathol. 2017;242(4):387–390. doi:10.1002/path.2017.242.issue-4.