
ABSTRACT
Tumor hypoxia-induced downregulation of DNA repair pathways and enhanced replication stress are potential sources of genomic instability. A plethora of genetic changes such as point mutations, large deletions and duplications, microsatellite and chromosomal instability have been discovered in cells under hypoxic stress. However, the influence of hypoxia on the mutational burden of the genome is not fully understood. Here, we attempted to elucidate the DNA damage response and repair patterns under different types of hypoxic stress. In addition, we examined the pattern of mutations exclusively induced under chronic and intermittent hypoxic conditions in two breast cancer cell lines using exome sequencing. Our data indicated that hypoxic stress resulted in transcriptional downregulation of DNA repair genes which can impact the DNA repair induced during anoxic as well as reoxygenated conditions. In addition, our findings demonstrate that hypoxic conditions increased the mutational burden, characterized by an increase in frameshift insertions and deletions. The somatic mutations were random and non-recurring, as huge variations within the technical duplicates were recognized. Hypoxia also resulted in an increase in the formation of potential neoantigens in both cell lines. More importantly, these data indicate that hypoxic stress mitigates DNA damage repair pathways and causes an increase in the mutational burden of tumor cells, thereby interfering with hypoxic cancer cell immunogenicity.
KEYWORDS:
Introduction
Immune checkpoint blockade (ICB) has a significant impact on the way cancer is being treated, yet, only a fraction of patients benefits from this treatment. The efficacy of the ICB depends on several factors that influence the tumor microenvironment. Tumor mutational burden and neoantigen status have been recognized as prognostic indicators for durable ICB response.1 An important factor that contributes to ICB resistance is the hypoxic tumor microenvironment which contributes to tumor development by driving heterogeneity,Citation2 stemness, invasiveness, and metastases.Citation3 Hypoxic stress also leads to the escape of tumor cells from immune surveillance by the acquisition of phenotypic diversity, regulating the cytotoxic activity of T-cells and promoting immune tolerance through myeloid-derived suppressor cells.Citation3 Most solid tumors experience variation in the oxygen flux with regions that are well oxygenated, poorly oxygenated and anoxic regions characterized by necrosis.Citation4 Chronic hypoxia is noticed during the initial phases of tumor development and is caused by the limitation in the oxygen diffusion. However, as the tumor grows, perturbations in microvessel development and flux can lead to cycling or intermittent hypoxia.Citation5 Both these hypoxic mechanisms play a distinct role in tumor development including angiogenesis, stemness, and metastases.Citation6
The DNA damage response (DDR) plays an important role in maintaining genome integrity by transmitting precise genetic information to the daughter cells.Citation7 Hypoxia remains a threat to genome integrity and has been shown to down-regulate DNA damage response and repair mechanisms.Citation7 Base excision repair, mismatch repair, DNA double-strand break repair pathways (Non-Homologous End joining and Homologous Recombination) have been shown to be downregulated at both transcriptional and translational levels by hypoxia.Citation8 In addition, severe hypoxia can lead to replication stress and can impact the efficient replication of the genome.Citation9 Longer periods of severe hypoxia lead to stalled replication forks which can then lead to over-replication of DNA.Citation9 In addition, reoxygenation during intermittent hypoxic conditions can lead to increased Reactive Oxygen Species (ROS) and ATP deprivation and can induce reprogramming in the DNA repair gene expression.Citation10 Further, increase in ROS is directly associated with increased DNA damages.Citation11 Faulty DNA repair mechanisms and/or inactivation of DNA repair pathways can have important consequences on the genome stability of the cell. Classical examples of tumors with defective DNA repair pathways such as mismatch repair defects in colorectal cancer and BRCA1 deficiency have demonstrated increased tumor mutational burden (TMB) in human tumors.Citation12,Citation13
Several studies have shown some specific mutations arising under hypoxic conditions by combining the assessment of DNA repair capacity and mutational analysis using reporter assays.Citation14 However, our knowledge about the type of somatic mutations across the genome and tumor mutational burden evoked by the hypoxic stress remains fragmented. Classification of somatic variants that arise exclusively under hypoxic conditions has implications in understanding the genetic heterogeneity of tumors, mutational burden, and neoantigen profile of hypoxic tumors and ICB response. Here, we aimed to understand the influence of two most common forms of hypoxia (chronic and intermittent) on the DNA damage response and subsequent tumor mutational burden analysis using breast cancer cells. Toward this, we performed DNA damage repair analysis, gene expression changes in all the DNA repair pathways through microarray and exome sequencing to identify the somatic mutations arising from hypoxic stress. Further, we attempted to predict the neoantigens arising exclusively due to hypoxia. Our data suggest that hypoxia-induced genetic heterogeneity through random and non-recurrent somatic mutations may have implications in tumor immunogenicity and immune evasion strategies adapted by cancer cells.
Materials and methods
Cell lines, maintenance, and hypoxic conditions
Breast cancer cell lines MCF-7 (NCI-DTP Cat# MCF7, RRID:CVCL_0031) cells were maintained in RPMI-1640 supplemented with 10% FBS, 1% Sodium pyruvate, 1% Pen-Strep. MDA-MB-231 (NCI-DTP Cat# MDA-MB-231, RRID:CVCL_0062) cells were cultured and maintained in DMEM supplemented with 10% FBS, 1% Sodium pyruvate, 1% Pen-Strep in a humidified 5% CO2 incubator (ESCO Cell Culture incubator, USA). For all hypoxic exposure, cells were maintained under 1% oxygen using Whitley H35 Hypoxystation (Don Whitley Scientific Limited). For chronic hypoxia, the cells were maintained under hypoxia for 9 continuous days and for intermittent hypoxia, the cells were cyclically maintained in 1% oxygen for 24 h followed by maintenance in 21% oxygen for 24 h. After the fifth cycle of hypoxia, cells were collected for all experiments.
Alkaline Comet Assay
The alkaline comet assay was performed following the protocol of Olive and Banath.Citation15 The hypoxic cells were reoxygenated for different time points before proceeding for the comet assay. Briefly, after trypsinization, approximately 5000 cells per slide was considered for preparing the second agarose layer. After preparation of sandwich agarose layers, the slides were immersed overnight in lysis buffer followed by alkaline unwinding (30 min) and electrophoresis at 0.65 V/cm for 35 min. The slides were visualized and imaged at 20X on a confocal microscope. The comet images were analyzed for the presence of comets using an open-source software – OpenCometCitation16 tool on ImageJ software (NIH, USA). Hydrogen peroxide treated cells (200 µM for 30 min) were used as positive control.
Immunoblotting
Cell lysates were prepared by using standard ice-cold RIPA lysis buffer containing 1X protease inhibitor cocktail (Sigma, USA). The protein content in the lysates was quantified using Pierce BCA protein estimation kit (ThermoFisher, USA) and 12–20 μg of proteins were separated on 8 – 12% SDS-polyacrylamide gels and electroblotted on to a Nitrocellulose membrane (Amersham, GE Healthcare Lifesciences, USA). Membranes were stained with Ponceau to analyze the efficiency of transfer. Blocking was performed with 5% Bovine Serum Albumin (Sigma, USA) in PBS (pH 7.4) containing 0.1% (v/v) Tween-20. We probed with the membrane with appropriate primary antibody (Rabbit HIF-1α antibody #14179, Cell Signaling Technologies/Rabbit RPA32/RPA2, #2208, Cell Signaling Technologies/Rabbit Anti-Histone H2AX antibody, #168-10574, RayBiotech, Mouse Anti-phospho-Histone H2A.X (Ser139), #05-636, Millipore, Mouse β-Actin, #sc-47778, SantaCruz Biotechnology) followed by secondary antibody conjugated with HRP. Membranes were developed using chemiluminescence detection kit (SuperSignal West Pico PLUS Chemi-luminiscence Substrate, Pierce, ThermoFisher Scientific, USA) and the signals were captured using iBright CL 1000 (Invitrogen, ThermoFisher Scientific, USA) documentation system.
Immunofluorescence
Following the hypoxia treatment, the cells were reoxygenated and trypsinized to proceed for immunofluorescence studies. Hydrogen peroxide treated cells (200µM for 30 min) was used as positive control and were collected along with other treatment groups. Briefly, the cells were collected and washed with PBS and fixed for 30 min (4% paraformaldehyde in PBS). Eventually, the cells were permeabilized (100 mM Tris, 50 mM EDTA, 0.5% Triton X-100) for 30 min and blocked (3% Bovine Serum Albumin in PBS) for 1 h. Between each of these steps, cells were washed with washing solution (5% Fetal Bovine Serum in PBS) and stained overnight with 1:1000 dilution of Mouse anti-phospho H2AX antibody MAb (#05-636, EMD Millipore Corp, Merck, USA) and Rabbit anti-53BP1 antibody pAb (#4937, Cell Signaling, USA). Secondary staining was performed using Alexa fluor 488 conjugated goat anti-mouse antibody (# A11001, Invitrogen, ThermoFisher Scientific, USA) and Alexa fluor 568 conjugated goat anti-rabbit antibody (# A11004, Invitrogen, ThermoFisher Scientific, USA) for 1 h. Cells were stained with DAPI (# D1306, Life Technologies, ThermoFisher Scientific, USA) and mounted on a slide with ProLong Gold Antifade reagent (# P10144, Invitrogen, ThermoFisher Scientific, USA). The slides were visualized on a confocal microscope (Zeiss LSM 800 with Airyscan, Germany) and the foci were analyzed using plan apochromat 63X objective with oil immersion.
Exome Sequencing
Genomic DNA extraction was performed using QiaAmp DNA Mini Kit (Qiagen, Germany). Exome library was prepared from 100 ng of genomic DNA using Ion AmpliSeq™ Exome RDY kit (ThermoFisher Scientific, USA) with exome enrichment in 12 primer pools. This kit approximately covers >97% of the exonic regions with 293903 total amplicons. The amplicons for each sample were pooled and subjected to partial restriction digestion. Sample barcoding was performed using Ion Express Barcode Adapter 1–16 kit. After ligating the adapters, the libraries were purified using CleanPCR (Clean NA, GC Biotech, The Netherlands). Each library was then quantified using Ion Library TaqMan Quantitation Kit (#4468802, ThermoFisher Scientific, USA). Emulsion PCR was performed using automation (Ion Chef System, Life Technologies, Thermo Fisher Scientific, USA) by utilizing Ion 540 Chef Reagents Kit and Ion 540 Control Ion Sphere Particles. Two samples per chip was loaded in equimolar concentrations (100 picomolar) and was sequenced on Ion S5 XL sequencer (Thermo Fisher Scientific, USA).
Bioinformatic analysis of WES data
The raw data was aligned with the hg38 version of the genome using Ion Torrent Suite software and the bam files were processed as follows. Pileup of normoxia-hypoxia pairs of samples was obtained by samtools mpileup and followed by Varscan2 somatic variant and indel calling,Citation17 where normoxia sample was considered as a reference/control sample, while Intermittent or Chronic hypoxia as a case sample. Varscan2 called variants only in the regions where coverage was above 10 reads. Only High confidence (hc) as marked by Varscan2 in its default settings was taken in subsequent analysis. Obtained vcf files were subsequently processed to filter out variants with strand bias. Ratio of variant supporting reads coming from different strands had to be within 0.5–2 range, all remaining variants were filtered out. Next, the maf object was created by vcf2maf tool. Variants from the vcf files were in the process annotated by Variant Effect Predictor (VEP).Citation18 MAF objects were created separately for MCF7_Chronic, MCF7_Intermittent, MDA_MB_231_Chronic, and MDA_MB_231_Intermittent groups. MAF objects were subsequently analyzed by maftools.Citation19 The neoantigen profile from the exome data was analyzed using NeoPredPipe.Citation20 NeoPredPipe adapts the guidelines set in the NetMHC-4.0 wherein peptides with a netMHCpan percentile rank ≤0.5 were considered as strong binders and peptides with a netMHCpan percentile rank ≤2 were considered as weak binders.Citation21
Whole transcript expression analysis by microarray
Cells were lysed in easy-BLUE reagent and RNA extraction was performed according to manufacturer’s protocol (easy-BLUE total RNA Extraction Kit, Intron Biotechnologies). The quality of the RNA was analyzed by gel electrophoresis and was quantified by Nanodrop as well as Qubit (Qubit® RNA HS Assay Kit, Invitrogen, ThermoFisher, USA). For the transcriptome profiling, 100 ng of RNA was processed using GeneChip™ WT PLUS Reagent Kit (Affymetrix, Applied Biosystems, USA). The biotinylated DNA was then hybridized on the Human Clariom™ D Arrays (Affymetrix, Applied Biosystems, USA). The array typically includes 6.7 million probes to identify genes (coding and multiple complexes) and non-coding regions (small RNA, precursor microRNA, ribosomal RNA, and tRNA). After washing and staining the arrays (GeneChip Fluidics Station 450, Affymetrix, ThermoFisher, USA), they were scanned on GeneChip™ Scanner 3000 7G (Affymetrix, ThermoFisher, USA). The CEL files were processed on Transcriptome Analysis Console (TAC, Applied Biosystem) to compare the fold change in gene expression between hypoxic versus the normoxic samples. We used the default setting for calculating the relative gene expression levels of each transcript, with the EBAYES (Empirical Bayes Statistics for Differential Expression) ANOVA method for statistical testing. With the filtering criteria (fold change of ≤−2 and ≥2 and p-value of <0.05), the volcano plots were graphed. Considering only the probes for coding and multiple complex genes (genes containing coding and non-coding loci), the genes (upregulated and down-regulated as separate) were analyzed for the pathways using Gene Set Enrichment Analysis (Hallmark gene set and KEGG gene set in Mutational Signature Database). Further, considering a stringent parameter of p < .01, the heat maps were generated on Heatmapper.Citation22 Hierarchical clustering was done using complete linkage with Euclidean distance. Only the multiple complex and the coding loci were considered for further analysis.
RNA isolation, cDNA synthesis, and quantitative Polymerase Chain Reaction (qPCR)
One microgram of RNA was used for cDNA synthesis using High Capacity cDNA Reverse Transcription Kit (Applied Biosystems, ThermoFisher). The qPCR for the selected genes was performed using the SYBR Green PCR Master Mix Kit (Applied Biosystems, ThermoFisher). The list of primers for all the genes studied is supplied in the supplementary information (Supplementary Table 15).
Statistical analysis
For all the statistical analysis related to comet and immunofluorescence analysis, one-way analysis of variance with Bonferroni’s post hoc test, was performed on GraphPad Prism, version 5.0 (GraphPad Software, San Diego, CA). A p-value of <0.05 was considered statistically significant. All the results were represented as mean ± SEM (standard error of mean) for three independent experiments.
Results
Tumor hypoxia and reoxygenation increases the DNA damage susceptibility and activates DNA damage response in breast cancer cells
To determine whether hypoxic culture conditions favor the production of new antigens, we first investigated the induction or accumulation of DNA breaks in two breast cancer cell lines proficient for DNA damage response and DNA repair, the lines MCF7 and MDA-MB-231. We measured the extent of gross DNA damage in chronic and intermittently exposed hypoxic cells by performing alkaline comet assay. As previously reported, hypoxia alone would not cause any measurable amount of DNA damage.Citation23 Hence, we reoxygenated both the chronic and intermittent hypoxic cells for up to 4 h and the olive tail moment was measured. In MCF-7 cells, 2-h post reoxygenation, the intermittent hypoxic cells start to accumulate DNA damage (). Also, we observed a significant increase in DNA damage post the reoxygenation of both chronic and intermittent hypoxic MDA-MB-231 cells ().
Figure 1. Chronic and intermittent hypoxia decreases the DNA damage repair capability in breast cancer cells. The extent of gross DNA damage is represented as Olive tail moment (OTM) for MCF-7 (a) and MDA-MB-231 (b) as measured by comet assay. DNA double-strand breaks were assessed by the formation of γ-H2AX/53BP-1 co-localized foci. The percentage of cells having at least one co-localized foci is plotted (c and d). The results are represented as mean ± SEM from three independent experiments. The significance is represented as P < .05 (indicated by *) for the treatment groups in comparison with the normoxia. Hydrogen peroxide treated cells (200 µM for 30 min) were used as positive control. H2AX, HIF1-α, RPA, and β-actin were analyzed through immunoblotting and the fold change is represented as values (e). Fold change in gene expression of phosphorylated H2AX was calculated by normalizing to the total H2AX and HIF1-A and RPA fold change values were calculated by normalizing to β-actin
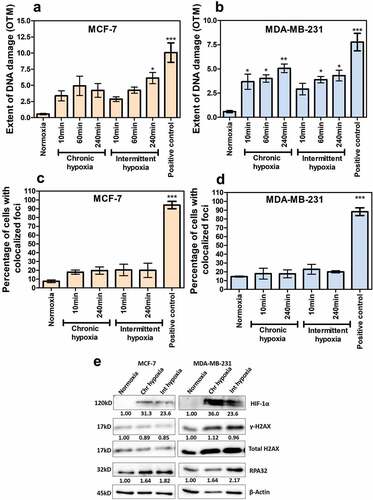
In order to further validate these data, we next evaluated the phosphorylation of histone H2A variant H2AX (γ-H2AX) at Ser139 along with the co-localization of 53BP1 which has been widely used as a sensitive marker for DNA damage especially double-stranded breaks (DSBs), as well as the expression of RPA32- a single-strand DNA binding protein used as a marker for replication stress through immunofluorescence (Supplementary figures 1 and 2). We screened at least 50 cells for at least one co-localizing foci in all the groups. The number of γ-H2AX foci alone was higher than the 53BP1 foci, irrespective of the time-points analyzed or the hypoxia treatment groups. Although we noticed an increasing trend of foci formation in chronic and intermittent hypoxia groups in comparison to normoxia, the increase was statistically insignificant ( and ). Even after reoxygenation, there was no measurable increase in the foci.
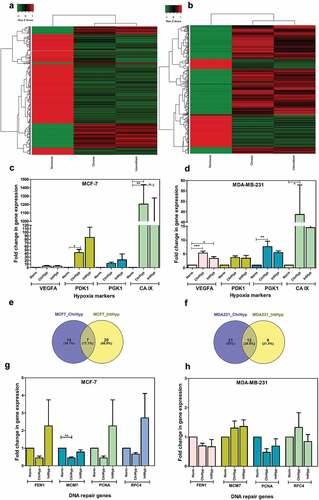
Figure 2. Chronic and intermittent hypoxia-induced gene expression profiles in breast cancer cell lines. The heat maps represent the common genes in chronic and intermittent hypoxia with significant changes in expression (p < .01) for both the cell lines (a and b) with complete linkage and hierarchical clustering. Hypoxia-induced fold change in gene expression for HIF-1A downstream genes was assessed by quantitative PCR from three independent experiments (c and d). The Venn diagrams (e and f) represent the number of DNA repair gene expression that are unique to chronic and intermittent hypoxia as per the GSEA hallmark dataset Hypoxia-induced fold change in gene expression for DNA repair genes as measured by real-time quantitative PCR from three independent experiments for MCF-7 (g) and MDA-MB-231 (h). The significance is represented as P < .05 for the treatment groups in comparison with the normoxia (indicated by *)
In order to check the presence of replication stress and DNA damage in chronic and intermittent hypoxic cells in the absence of reoxygenation, we evaluated the phosphorylation of H2AX and RPA32 through immunoblotting. There was no significant increase in γ-H2AX in MCF-7 as well as MDA-MB-231. Both cell lines demonstrated an increase in RPA32 (ssDNA binding protein marker for replication stress) in chronic and intermittent hypoxia samples (). Together, these results confirmed that chronic and intermittent hypoxia increase replication stress in breast tumor cells.
Chronic and intermittent hypoxia downregulate DNA replication and repair pathways
We next examined the transcriptome profile of cells under hypoxia by microarray. Fold change of ≤–2 and ≥2 with p-value of <0.05 was considered and volcano plots were generated (Supplementary Figure 3). Further, considering a stringent parameter of p < .01 and only the probes for coding and multiple complex genes (protein complex), the heat maps were generated ( and ). Hierarchical clustering analysis separated the samples based on hypoxic status.
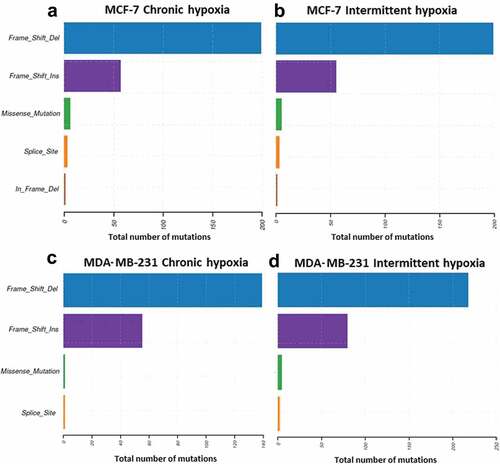
Figure 3. Exome data analysis indicated an increase in frameshift deletions and insertions in both MCF-7 (a and b) and MDA-MB-231 cells (c and d) under chronic and intermittent hypoxic conditions. The data represent the total number of mutations identified from three independent experiments
Both cell lines demonstrated genes related to hypoxia as the most significantly expressed pathways. Furthermore, we analyzed the expression of these genes specific to hypoxic exposure for validating our experimental hypoxic condition by analyzing the hypoxia hallmark gene set in Gene Set Enrichment Analysis database. In MCF-7, we noticed that 48/200 and 66/200 genes were differentially expressed under chronic and intermittent hypoxic conditions, respectively (Supplementary Tables 1 and 2). Similarly, in MDA-MB-231 cells, we noticed that 48/200 and 69/200 genes were differentially expressed under chronic and intermittent hypoxic conditions, respectively (Supplementary table 3 and 4). We also validated the microarray gene expression data for a selected panel of hypoxia genes (VEGFA, PDK1, PGK1, CA-IX) by quantitative real-time PCR ( and ). Hypoxia led to an increase in two folds or higher for VEGFA, three folds higher for PDK1, greater than five folds increase in PGK1 and significantly higher folds of expression for CA-IX.
Table 1. The DNA repair pathways downregulated under chronic and intermittent hypoxia. This table represents the list of DNA repair pathways from the KEGG dataset – C2 that are downregulated in chronic and intermittent hypoxic conditions in both the cell lines
More importantly, we analyzed the expression of genes related to DNA damage response and repair from the hallmark DNA repair gene set (Supplementary table 5, 6, 7 and 8). Importantly, we noticed that the gene expression pattern differed remarkably between chronic and intermittent hypoxia for both the cell lines. As per the hallmark DNA repair gene set, we saw a total of 41 genes in MCF-7 and 42 genes in MDA-MB-231 affected by hypoxic exposure with fold change of ≤-2 or ≥2 ( and ). We found 7 and 12 genes common between chronic and intermittent groups in MCF-7 and MDA-MB-231. We analyzed the expression pattern of genes specific to DNA replication and DNA repair pathways by separating the upregulated and down-regulated genes using KEGG (Supplementary table 9, 10 and 11) and observed that most of the DNA replication and repair pathways were downregulated (). Furthermore, and as expected, reoxygenation-induced upregulation of Reactive Oxygen Species (ROS) pathway was observed only in intermittent hypoxic samples of both cell lines (Supplementary table 12 and 13).
Finally, we performed quantitative PCR analysis of a set of DNA repair genes (FEN1, MCM7, PCNA, RFC4) retrieved as downregulated through microarray analysis. Such an approach failed to fully recapitulate the previously observed variations. However, even if the observed differences are not statistically significant, chronic hypoxia affects at least FEN1 and PCNA expression in both cell lines. ( and ). Collectively, chronic and intermittent hypoxia leads to the upregulation of ROS, induction of replication stress and downregulation of DNA repair, thus contributing to genomic instability.
Hypoxia leads to an increase in somatic insertions and deletions in a random manner
Since the preceding observations suggest that hypoxic condition alter DNA-repair pathways, we evaluated the “competence” of DNA repair mechanisms in hypoxic conditions, by whole exome sequencing (WES) to map the mutational landscape in hypoxic MCF-7 and MDA-MB-231 cells. Exome sequencing analysis identified an average of 91 and 79 somatic mutations in chronic and intermittent hypoxic MCF-7 cells. Similarly, in MDA-MB-231 cells 61 and 85 protein damaging somatic variants were detected following chronic and intermittent hypoxia (Supplementary figure 5). It was also interesting to note that the culture under hypoxic conditions, regardless of the cell line used or the experimental setting, was associated with a significant increase in nucleotide insertions/small deletions (). The mutational events were random and were of non-recurrent type as evidenced by large variation between the difference in variant number and variant types in triplicate samples (Supplementary figure 5). Together, these data indicate that hypoxia increases the mutational load of tumor cells by inducing frameshift deletion and insertion.
Of the total variants identified, the number of non-synonymous mutations was less than 10% in both chronic and intermittent hypoxia treated samples across both cell lines. As the number of nonsynonymous mutations were low, it was difficult to identify the mutational signature for our data set. Oncogenic pathway analysis revealed that Ras-RTK was majorly affected in MDA-MB-231 while Hippo-signaling pathway was affected in MCF-7. As the DNA repair variants were associated with increased tumor mutational burden, we analyzed the mutations in DNA repair genes. Of the 47 mutated genes recognized for DNA damage and repair, PRDKC (DNA-dependent protein kinase) and FANCM (Fanconi Anemia Complementation Group M) were the commonly affected gene in both chronic and intermittent hypoxia (supplementary table 14).
Chronic and intermittent hypoxia increase the number of potential neoantigens
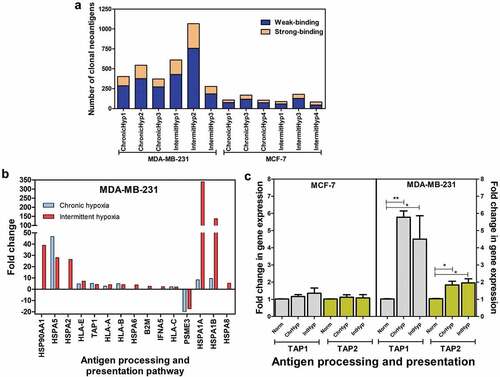
Since our data point out an alteration of DNA repair and an increase of somatic mutations in hypoxic breast carcinoma cells, we finally investigated whether hypoxic conditions lead to the generation of neoantigens. Neo-antigen predictions were performed using the exome sequence data using NeoPredPipe. We observed a global increase in the number of neoantigen in both hypoxic MCF-7 and MDA-MB-231 cells (), regardless of the binding. The number of neoantigen generated from the frameshift mutations was higher in MDA-MB-231 in comparison to MCF-7, irrespectively of the hypoxic exposure. Further, the number of weakly binding neoantigens were much higher in comparison to strong-binding across chronic and intermittent hypoxic conditions in both cell types (). Among the total neoantigens (includes weak- and strong-binding), all of them were of the clonal type. Furthermore, our microarray analysis demonstrated the upregulation of antigen processing and presentation pathway, in MDA-MB-231 cells with respect to chronic and intermittent hypoxia (). Validation through quantitative PCR also showed an increase in expression of TAP1 and TAP2 genes in MDA-MB-231 cells ().
Figure 4. Effect of hypoxia on potential neoantigen expression. (a): Increased clonal neoantigen load due to insertion-deletion mutations in the breast cancer cell lines under hypoxic conditions. (b): Microarray analysis indicated that chronic and intermittent hypoxia led to the upregulation of antigen processing and presentation pathway in MDA-MB-231 cells. (c): Chronic and intermittent hypoxia-induced fold change in gene expression for TAP1 and TAP2 as measured by quantitative PCR from three independent experiments. The significance is represented as P < .05 for the treatment groups in comparison with the normoxia (indicated by *)
Discussion
Genomic instability is considered as a hallmark of cancer – enabling and driving force of tumorigenesis. The hypoxic downregulation of DNA repair pathways along with increased susceptibility to DNA damage during re-oxygenation and replication stress leads to increased genetic instability in tumor cells. Our hypothesis was that hypoxia directly contributes to an increase in the tumor mutational burden which can impact the immunogenicity of the tumor. In this regard, we considered two cell lines with different cell type (epithelial and mesenchymal) and rate of growth (MCF-7 has slow growth rate and MDA-MB-231 has faster growth rate), varying degree of aggressiveness (MCF-7 – ER, PR and HER2 positive and MDA-MB-231 triple negative) and analyzed the effect of chronic and intermittent hypoxic conditions. As the genetic alterations that confer selective advantage for the growth of tumors happen over a period, we analyzed all the parameters after nine consecutive treatment days.
Our studies were in line with the findings from other reportCitation23 that hypoxia alone is not sufficient to induce DNA double-strand breaks. However, we noticed the upregulation of ROS pathway specifically in intermittent hypoxic cells in both cell lines. Earlier studies have demonstrated that the hypoxia and reoxygenation after hypoxic stress is one of the key factors for replication stress in tumor cells.Citation24,Citation25 Further, the increase in RPA32 was higher in intermittent cells in both cell types, indicating the presence of higher replication stress. Increase in RPA32 levels can be attributed to the increase in ROS levels. Replication stress is characterized by the presence of stalled forks with long stretches of ssDNA.Citation9 Replication Protein A is one of the initial responders to replication stress and binds to ssDNA for stabilization. Despite the replication stress, some cells can bypass genetic lesions and continue replicating by repriming the lesion. Cells that proliferate even in low oxygen levels, with compromised DNA repair mechanisms acquire increased genetic instability.Citation14 Together, reoxygenation induced DNA damage, hypoxic replication stress, increase in ROS levels, and downregulation of DNA repair pathways contribute to the genomic instability in breast cancer cells.
Accumulating evidence indicates that genomic instability correlates with immunogenicity and mutational load is a predictor of response to immunotherapy.Citation26 Tumors with mutations in DNA repair genes or inactivated DNA repair pathways have demonstrated high mutational burden. We therefore analyzed the somatic mutations accumulated in the common cancer-related genes and DNA repair genes that are exclusively arising from hypoxic treatment. From our findings, we have seen that hypoxia induces unique mutations and can be a cause of divergence within the hypoxic regions against the non-hypoxic zones. The non-synonymous mutations were rather low to comprise a meaningful mutational signature. However, a recent study suggested that large number of mutations were identified in patients with hypoxic tumors with higher incidence in deletions, duplications, and single nucleotide changes.Citation27 The authors also identified mutational signatures from single base substitutions and frameshift mutations correlating with defective DNA repair (homologous recombination and mismatch repair), suggestive of hypoxic contribution to such genotypes.Citation27 An increase in insertions and deletions was observed in comparison to single nucleotide variations. Rospo and coworkers demonstrated that the incidence of insertions and deletions was much more prevalent in colorectal cancers having DNA repair defects like polymerase E mutations and high microsatellite instability.Citation28 Turajlic and coworkers demonstrated that insertions and deletions can produce neoantigens that have higher immunostimulatory effect in comparison to SNPs.Citation29 Rospo and colleagues also demonstrated that DNA repair defects give rise to neoantigen profile that are dynamic and evolving with time.Citation28 Paradoxically, genetic instability in tumors can pose as an obstacle for a successful ICB.Citation30,Citation31 Recent studies have also demonstrated that tumors with chromosomal instability suppress antigen-presenting mechanisms leading to immune evasion.Citation28 Further, the expression of clonal neoantigens rather than just high tumor mutational burden results in a durable response to immunotherapy.Citation32
Cancer cells undergo selective pressure in the presence of stromal cells (vascular endothelial cells, pericytes, adipocytes, fibroblasts), immune cells, hypoxia, and a cocktail of pro-tumorigenic factorsCitation33 which lead to tumor heterogeneity and subclonal evolution. On the other hand, cancer cell lines undergo very little or no selective pressure in the 2D environment.Citation28 Cell lines demonstrate high degree of clonality with respect to the variants maintaining high similarity of allele frequency when subcultured over a period of time.Citation28 From our study using the two-dimensional cell culture model, we found that the neoantigen was of mostly the clonal type.
We also noticed that neoantigen levels were high in cells (MDA-MB-231) with higher levels of reoxygenation induced DNA damage. However, the tumor microenvironment and the heterocellular crosstalk of cancer cells with the immune cells shape the neoantigen landscape of a tumor.Citation34,Citation35 Hence, studying the hypoxic zones in in-vivo tumor models will be of major interest to understand the immunogenicity of a tumor in the context of its microenvironment.
Further, hypoxic treatment resulted in the upregulation of antigen processing and presentation only in MDA-MB-231 with an increase in the expression of genes related to MHC Class I pathway. MDA-MB-231 has aggressive metastatic phenotype with higher rate of proliferation (supplementary Figure 4). The accumulation of mutations could be higher in cells with faster proliferation rate, as the cells can bypass DNA damage checkpoints.Citation36
The current study further confirms the complexity of hypoxia in shaping the biology of cancer cells. Our data showed the capacity of hypoxic stress to drive genomic instability and alter DNA damage repair pathways. This might have a direct effect on the design of new therapies and the targeting of hypoxic tumors. They support the concept that hypoxia can drive cancer progression through its impact on genetic heterogeneity. Although the clonality of neoantigens can render immunogenic phenotype, hypoxic induction of dynamic and non-recurrent mutations can also regulate the immune evasion strategies adapted by cancer cells.
Authors’ contribution
GHV, JT, SC conceived and designed the study.
BW, SM, KS, and PD performed/assisted the bioinformatic analysis.
GHV, WSME, FA, RAK, and PB performed the experiments and data interpretation.
GHV, FR, JT, and SC wrote the manuscript.
All authors read and approved the final manuscript.
Competing interests
All authors declare no competing interests.
Supplemental Material
Download ()Acknowledgments
We acknowledge Sheikh Hamdan Bin Rashid Al Maktoum Award for Medical Sciences (MRG-230/2017–2018) for providing the research funding and gulf medical university for all the research infrastructure support. KS and SM thank TIFAC-CORE in Pharmacogenomics, DST-FIST, K-FIST, and MAHE for infrastructure facilities.
Supplementary Material
Supplemental data for this article can be accessed here.
Additional information
Funding
References
- Chabanon RM, Pedrero M, Lefebvre C, Marabelle A, Soria JC, Postel-Vinay S. Mutational landscape and sensitivity to immune checkpoint blockers. Clin Cancer Res. 2016;22(17):4309–10. doi:10.1158/1078-0432.CCR-16-0903.
- Francis A, Venkatesh GH, Zaarour RF, Zeinelabdin NA, Nawafleh HH, Prasad P, Buart S, Terry S, Chouaib S. Tumor hypoxia: a key determinant of microenvironment hostility and a major checkpoint during the antitumor response. Crit Rev Immunol. 2018;38(6):505–524. doi:10.1615/CritRevImmunol.2019030168.
- Terry S, Buart S, Chouaib S. Hypoxic stress-induced tumor and immune plasticity, suppression, and impact on tumor heterogeneity. Front Immunol. 2017;8:1625. doi:10.3389/fimmu.2017.01625.
- Harris AL. Hypoxia–a key regulatory factor in tumour growth. Nat Rev Cancer. 2002;2(1):38–47. doi:10.1038/nrc704.
- Dewhirst MW, Cao Y, Moeller B. Cycling hypoxia and free radicals regulate angiogenesis and radiotherapy response. Nat Rev Cancer. 2008;8(6):425–437. doi:10.1038/nrc2397.
- Chen A, Sceneay J, Gödde N, Kinwel T, Ham S, Thompson EW, Humbert PO, Möller A. Intermittent hypoxia induces a metastatic phenotype in breast cancer. Oncogene. 2018;37(31):4214–4225. doi:10.1038/s41388-018-0259-3.
- Giglia-Mari G, Zotter A, Vermeulen W. DNA damage response. Cold Spring Harb Perspect Biol. 2011;3(1):a000745. doi:10.1101/cshperspect.a000745.
- Scanlon SE, Glazer PM. Multifaceted control of DNA repair pathways by the hypoxic tumor microenvironment. DNA Repair (Amst). 2015;32:180–189. doi:10.1016/j.dnarep.2015.04.030.
- Ng N, Purshouse K, Foskolou IP, Olcina MM, Hammond EM. Challenges to DNA replication in hypoxic conditions. Febs J. 2018;285(9):1563–1571. doi:10.1111/febs.14377.
- Michiels C, Tellier C, Feron O. Cycling hypoxia: A key feature of the tumor microenvironment. Biochim Biophys Acta. 2016;1866(1):76–86. doi:10.1016/j.bbcan.2016.06.004.
- Koritzinsky M, Wouters BG. The roles of reactive oxygen species and autophagy in mediating the tolerance of tumor cells to cycling hypoxia. Semin Radiat Oncol. 2013;23(4):252–261. doi:10.1016/j.semradonc.2013.05.006.
- Chae YK, Anker JF, Bais P, Namburi S, Giles FJ, Chuang JH. Mutations in DNA repair genes are associated with increased neo-antigen load and activated T cell infiltration in lung adenocarcinoma. Oncotarget. 2018;9(8):7949–7960. doi:10.18632/oncotarget.23742.
- Germano G, Lamba S, Rospo G, Barault L, Magrì A, Maione F, Russo M, Crisafulli G, Bartolini A, Lerda G, et al. Inactivation of DNA repair triggers neoantigen generation and impairs tumour growth. Nature. 2017;552(7683):116–120. doi:10.1038/nature24673.
- Luoto KR, Kumareswaran R, Bristow RG. Tumor hypoxia as a driving force in genetic instability. Genome Integr. 2013;4(1):5. doi:10.1186/2041-9414-4-5.
- Olive PL, Banáth JP. The comet assay: a method to measure DNA damage in individual cells. Nat Protoc. 2006;1(1):23–29. doi:10.1038/nprot.2006.5.
- Gyori BM, Venkatachalam G, Thiagarajan PS, Hsu D, Clement MV. OpenComet: an automated tool for comet assay image analysis. Redox Biol. 2014;2:457–465. doi:10.1016/j.redox.2013.12.020.
- Koboldt DC, Zhang Q, Larson DE, Shen D, McLellan MD, Lin L, Miller CA, Mardis ER, Ding L, Wilson RK, et al. VarScan 2: somatic mutation and copy number alteration discovery in cancer by exome sequencing. Genome Res. 2012;22(3):568–576. doi:10.1101/gr.129684.111.
- McLaren W, Gil L, Hunt SE, Riat HS, Ritchie GR, Thormann A, Flicek P, Cunningham F. The ensembl variant effect predictor. Genome Biol. 2016;17(1):122. doi:10.1186/s13059-016-0974-4.
- Mayakonda A, Lin DC, Assenov Y, Plass C, Koeffler HP. Maftools: efficient and comprehensive analysis of somatic variants in cancer. Genome Res. 2018;28(11):1747–1756. doi:10.1101/gr.239244.118.
- Schenck RO, Lakatos E, Gatenbee C, Graham TA, Anderson ARA. NeoPredPipe: high-throughput neoantigen prediction and recognition potential pipeline. BMC Bioinformatics. 2019;20(1):264. doi:10.1186/s12859-019-2876-4.
- Jurtz V, Paul S, Andreatta M, Marcatili P, Peters B, Morten N. Netmhcpan-4.0: improved peptide–mhc class i interaction predictions integrating eluted ligand and peptide binding affinity data. J Immunol. 2017;199(9):3360–3368. doi:10.4049/jimmunol.1700893.
- Babicki S, Arndt D, Marcu A, Liang Y, Grant JR, Maciejewski A, Wishart DS. Heatmapper: web-enabled heat mapping for all. Nucleic Acids Res. 2016;44(W1):W147–53. doi:10.1093/nar/gkw419.
- Olcina M, Lecane PS, Hammond EM. Targeting hypoxic cells through the DNA damage response. Clin Cancer Res. 2010;16(23):5624–5629. doi:10.1158/1078-0432.CCR-10-0286.
- Hammond EM, Denko NC, Dorie MJ, Abraham RT, Giaccia AJ. Hypoxia links ATR and p53 through replication arrest. Mol Cell Biol. 2002;22(6):1834–1843. doi:10.1128/MCB.22.6.1834-1843.2002.
- Huang LE, Bindra RS, Glazer PM, Harris AL. Hypoxia-induced genetic instability–a calculated mechanism underlying tumor progression. J Mol Med (Berl). 2007;85(2):139–148. doi:10.1007/s00109-006-0133-6.
- Havel JJ, Chowell D, Chan TA. The evolving landscape of biomarkers for checkpoint inhibitor immunotherapy. Nat Rev Cancer. 2019;19(3):133–150. doi:10.1038/s41568-019-0116-x.
- Bhandari V, Li CH, Bristow RG, Boutros PC, Consortium PCAWG. Divergent mutational processes distinguish hypoxic and normoxic tumours. Nat Commun. 2020;11(1):737. doi:10.1038/s41467-019-14052-x.
- Rospo G, Lorenzato A, Amirouchene-Angelozzi N, Magrì A, Cancelliere C, Corti G, Negrino C, Amodio V, Montone M, Bartolini A, et al. Evolving neoantigen profiles in colorectal cancers with DNA repair defects. Genome Med. 2019;11(1):42. doi:10.1186/s13073-019-0654-6.
- Turajlic S, Litchfield K, Xu H, Rosenthal R, McGranahan N, Reading JL, Wong YNS, Rowan A, Kanu N, Al Bakir M, et al. Insertion-and-deletion-derived tumour-specific neoantigens and the immunogenic phenotype: a pan-cancer analysis. Lancet Oncol. 2017;18(8):1009–1021. doi:10.1016/S1470-2045(17)30516-8.
- Davoli T, Uno H, Wooten EC, Elledge SJ. Tumor aneuploidy correlates with markers of immune evasion and with reduced response to immunotherapy. Science. 2017;355:6322. doi:10.1126/science.aaf8399.
- Tripathi R, Modur V, Senovilla L, Kroemer G, Komurov K. Suppression of tumor antigen presentation during aneuploid tumor evolution contributes to immune evasion. OncoImmunology. 2019;8(11):1657374. doi:10.1080/2162402X.2019.1657374.
- McGranahan N, Furness AJ, Rosenthal R, Ramskov S, Lyngaa R, Saini SK, Jamal-Hanjani M, Wilson GA, Birkbak NJ, Hiley CT, et al. Clonal neoantigens elicit T cell immunoreactivity and sensitivity to immune checkpoint blockade. Science. 2016;351(6280):1463–1469. doi:10.1126/science.aaf1490.
- Petrova V, Annicchiarico-Petruzzelli M, Melino G, Amelio I. The hypoxic tumour microenvironment. Oncogenesis. 2018;7(1):10. doi:10.1038/s41389-017-0011-9.
- de Miranda NFCC, Trajanoski Z. Advancing cancer immunotherapy: a vision for the field. Genome Med. 2019;11(1):51. doi:10.1186/s13073-019-0662-6.
- Lakatos E, Williams MJ, Schenck RO, Cross WCH, Househam J, Werner B, Gatenbee C, Robertson-Tessi M, Barnes CP, Anderson ARA, et al. Evolutionary dynamics of neoantigens in growing tumours. bioRxiv. 2019;536433.
- Shaltiel IA, Krenning L, Bruinsma W, Medema RH. The same, only different - DNA damage checkpoints and their reversal throughout the cell cycle. J Cell Sci. 2015;128(4):607–620. doi:10.1242/jcs.163766.