
ABSTRACT
Treatment of ovarian cancer (OC) remains the biggest challenge among gynecological malignancies. Immune checkpoint blockade therapy is promising in many cancers but shows low response rates in OC because of its heterogeneity. Although the biological and molecular heterogeneity of OC has been extensively investigated, heterogeneity of immune microenvironment remains elusive. We have collected the expression profiles of 3071 OC patients from 22 publicly available datasets. CIBERSORT was applied to infer the infiltration fraction of 22 immune cells among 2086 patients with CIBERSORT P < .05. We then explored the heterogeneity landscape of immune microenvironment in OC at three levels (immune infiltration, prognostic relevance of immune infiltration, immune checkpoint expression patterns). Multivariable Cox regression model was used to investigate the associations between survival risk and immune infiltration. Constructed immune risk score stratified patients with significantly different survival risk (HR: 1.47, 95% CI: 1.31–1.66, P < .0001). The immune infiltration landscape, prognostic relevance of immune cells, and expression patterns of 79 immune checkpoints exhibited remarkable clinicopathological heterogeneity. For instance, M1 macrophages were significantly associated with better outcomes among patients with high-grade, late-stage, type-II OC (HR: 0.77–0.83), and worse outcomes among patients with type-I OC (HR: 1.78); M2 macrophages were significantly associated with worse outcomes among patients with high-grade, type-II OC (HR: 1.14–1.17); Neutrophils were significantly associated with worse outcomes among patients with high-grade, late-stage, type-I OC (HR: 1.14–1.73). The heterogeneous landscape of immune microenvironment presented in this study provided new insights into prognostic prediction and tailored immunotherapy of OC.
Introduction
Treatment of ovarian cancer (OC) remains the biggest challenge for oncologists among gynecological malignancies.Citation1,Citation2 Although the combination of surgery and chemotherapy is initially effective in most patients, it is often ineffective in eliminating residual lesions and preventing metastasis and recurrence of OC.Citation2 Immunotherapy has established itself as a promising therapeutic modality with its better specificity, long-term benefits, and fewer side effects, which is the ultimate goal of cancer treatment. Immune checkpoint blockade therapy has achieved an unprecedented therapeutic effect in many cancers such as melanoma and lung cancer.Citation3,Citation4 However, the response rate of checkpoint blockade therapy is merely around 15% in OC, which is largely attributed to its extensive heterogeneity.Citation3–Citation5 Even so, patients with OC who respond to immune checkpoint blockade therapy will achieve long-term benefits because successful immunotherapy could effectively clear tumor lesions, prevent recurrence of tiny lesions as a result of the immune surveillance and memory functions.Citation5 Thus, precisely identifying potential benefits in patients is critical to improving the current plight of immunotherapy in the context of OC heterogeneity. Although the biological and molecular heterogeneity of OC has been extensively investigated through massive omics sequencing data,Citation2 the heterogeneity of immune microenvironment remains elusive.
Immune response was orchestrated between various immune cells and immune checkpoints. Accumulating evidence suggested that both the type and extent of immune infiltration correlate with responses to immunotherapy among patients with OC.Citation6 Immune cells (e.g., NK cells) might exercise different antitumor activities within the tumor depending on the FIGO stages of OC.Citation7,Citation8 Moreover, different pathological grades of OC also presented with distinct patterns of immune cells (e.g., CD8 T cells) infiltration.Citation9 Given the heterogeneous nature of OC, a dualistic model (type-I and type-II tumors) was proposed to categorize various types of OC. These two types of OC exhibited quite distinct morphological and molecular characteristics and were recognized as completely distinct types of tumors. Type-I OC was characterized by resistance to chemotherapy, indolent progression, infrequent TP53 mutation, and good prognosis, while type-II OC seemed on the contrary.Citation10 Heterogeneity of immune infiltration is not only reflected in patients with different clinical characteristics but also closely related to the patients’ epithelial to mesenchymal transition (EMT) status. Increasing evidence indicated that EMT played an essential role in mediating tumor metastasis, chemoresistance, and immune escape.Citation11–Citation13 Furthermore, EMT has been reported to be associated with immune infiltration and expression of immune checkpoints.Citation13,Citation14 However, ways in which immune infiltration and its prognostic relevance, as well as the expression patterns of immune checkpoints, differ by stage, grade, type, and EMT status of OC have not yet been systematically elucidated.
Moreover, previous studies have limitations regarding the immune infiltration of cancers. The experimental protocols to detect the immune infiltration lacked standardized assays and evaluation system. For example, the primary detection method, immunohistochemistry, has some limitations. First, it relies on restricted phenotypic biomarkers, and the judgment of staining intensity is subjective and poorly reproducible. Second, immunohistochemistry can only cover a minute subset of immune cells.Citation7 Last but not least, the impact of myeloid and erythroid cells on survival is not well studied. Therefore, it is of paramount importance to objectively decipher the full landscape of immune infiltration microenvironment in OC based on large patient cohorts.
In this study, we explored the immune infiltration based on CIBERSORT, which is a computational method to decipher the infiltration fractions of 22 immune cell types from tissue bulk mRNA profiles.Citation15 The present study enrolled large-scale expression profiles of 3071 patients with OC from 22 publicly available expression data sets. Then, we systematically investigated the heterogeneous landscape of immunological infiltration and its prognostic implications as well as the expression patterns of 79 immune checkpoints under different clinicopathological characteristics of OC patients. Finally, we reviewed the potential guidance of the heterogeneous immune microenvironment for prognostic prediction and immunotherapy for OC.
Materials and methods
Study design and participants
A systematic search of Gene Expression Omnibus (GEO), Array Express, The Cancer Genome Atlas (TCGA), and related literature was conducted to locate expression datasets of OC with samples >20. As a result, we collected OC samples from 22 publicly available data sets with survival information encompassing 19 databases from GEO, one from ArrayExpress, one from OV-AU, and one from TCGA (). The primary endpoint was overall survival (OS). OS refers to the date of diagnosis to death or last follow-up. Early stage was defined as FIGO stage I and stage II, and late stage was defined as FIGO stage III and stage IV.Citation16,Citation17 Low grade includes grade I and grades I to II; high grade includes grades II and above. Optimal debulking indicates no evident disease or minimal residual disease (≤1 cm); suboptimal debulking indicates gross residual disease (>1 cm) or no operation.Citation17 Type-I tumors encompass endometrioid, clear cell, and seromucinous carcinomas, low-grade serous carcinomas, mucinous carcinomas, and malignant Brenner tumors; Type-II tumors comprise high-grade serous carcinomas, carcinosarcoma, undifferentiated carcinoma, and primary peritoneal carcinoma.Citation10 Samples without “overall survival information” or “overall survival” equal to 0, samples belong to “normal” or “benign tissues,” and GEO samples belong to TCGA were excluded, which resulted in a total cohort of 3071 samples from 22 datasets (, Table S1).
Table 1. Baseline characteristics of datasets
The use of datasets and the processing protocol was approved by the Ethical Committee of Tongji Medical College, Huazhong University of Science and Technology according to the principles of the Declaration of Helsinki.
Data collection and preprocessing
Data collection and preprocessing followed the guideline of Ali et al.Citation18 and Shen et al.Citation19 21 microarray datasets were normalized and scaled. To make RNA sequencing datasets OV-AU and GSE102073 suitable for the downstream linear modeling, we utilized voomCitation20 to transform the raw count into log2-counts per million and scale it. Then, we adopt ComBat to adjust the batch effects 1) between repetitions within each dataset; 2) between different datasets within the same platform; 3) between different platforms step by step. The detail of preprocessing and normalization procedure for each dataset and platform is listed in Table S2. As illustrated from Figure S1 PCA plot, patients across cohorts and platforms were mixed together, suggesting the batch effects were well eliminated.
Deciphering the composition of infiltrating immune cells
Utilizing CIBERSORT computational tool, prepossessed mRNA expression data were used to infer the absolute fraction score of 22 subtypes of infiltrating immune cells. The immune cells consist of granulocytes and myeloid cells. CIBERSORT is a computational program based on support vector regression used to decipher the immune cell-type fractions from mixed cell-type tumor samples, which uses 547 gene signature values as a reference baseline.Citation15 The overlap between 547 genes in CIBERSORT L22 reference and genes in different platforms was shown in Figure S2.
In this study, the mRNA expression matrix was analyzed using CIBERSORT R script downloaded from “http://cibersort.stanford.edu,” with 1000 permutations, without quantile normalization, and “absolute” mode turned on. The LM22.txt signature matrix was used as input reference.
Calculating prognostic risk score from infiltrating immune cell composition
Univariate Cox regression model implemented in R package “survival” was applied for the selection of prognostic associated infiltrating immune cells. We fit infiltrating immune cells absolute fraction to a survival regression model and obtained its prognostic risk score. To stratify patients into different prognostic risk groups, we set the mean value 1.486e-17 and standard deviation (SD) as 0.225 of the entire data set as the cutoff value. A patient was predicted to be at high risk if the prognostic risk score was greater than the cutoff value and vice versa.
Patient stratification by EMT gene signature
Utilizing EMT signatures consisting of 77 genes,Citation21 EMT scores were calculated as the mean expression of the 25 “mesenchymal (M)” markers subtracted by the mean expression of the 52 “epithelial (E)” markers; a higher EMT score indicates a more mesenchymal phenotype. EMT signatures and calculation methods are described as before.Citation21 Here, we categorized the patient as “E” type if the EMT score was negative, and as “M” type if the score was positive.
Survival analysis
Kaplan–Meier curve and univariate/multivariate Cox regression model implemented in R package “survival” were used to illustrate the difference in survival outcomes among different patient subgroups. P < .05 was considered statistically significant by the log-rank test; 95% confidence intervals (CIs) were reported if necessary.
Prognostic interpretation of inferred immune cells
Associations between inferred proportions of immune cell types and survival among different patient cohorts were tested using multivariate Cox regression. Analyses were conducted separately for “low- and high-grade,” “early- and late-stage,” and “type-I and type-II” subgroups, with OS as the survival outcome. In order to derive smaller Hazard ratio (HR) values in a Cox model, the absolute immune cell fraction scores for each cell were classified into quantiles according to the infiltrating distribution landscape (Figure S3) and subsequently treated as category variables in the Cox model, where 0% ≤ Q1 (low) < 50%, and 50% ≤ Q2 (high) ≤ 100%. In the multivariate Cox model, variables containing only a single quantile fraction were excluded.
Differential expression of immunomodulators
Seventy-nine immunomodulators were collected from Thorsson et al.Citation22 Expression differences between “low-” and “high-risk,” “low-” and “high-grade,” “early-” and “late-stage,” “type-I” and “type-II,” “E” and “M” subgroups were conducted using “limma” for 2086 patients, respectively.
Results
Infiltration fraction overview of 22 immune cells across patients
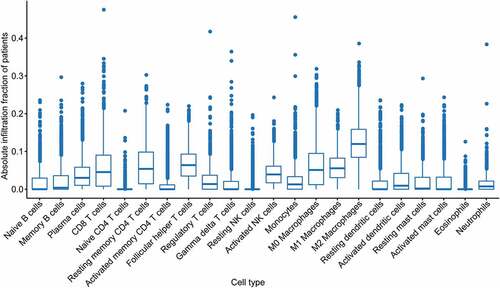
The baseline characteristics of patients and datasets were summarized in Table S1 and , respectively. Patients in this study included various stages, grades, and pathological subtypes of OC. In order to understand the immune status of patients with OC, we first analyzed the infiltration fraction of immune cells. CIBERSORT derived a P value for each patient according to the deconvolution of infiltration fraction, and only patients with CIBERSORT P < .05 were included in the main analysis. As a result, 985 patients with CIBERSORT P ≥ 0.05 were excluded from the total patients of 3071. Distinct infiltration patterns of 22 immune cell types among 2086 patients with CIBERSORT P < .05 were shown in . It could be seen that the infiltration fraction of immune cells varied across OC samples. We speculated that variations in immune infiltration might be an intrinsic characteristic representing individual immune microenvironment differences. To better interpret , we showed the infiltration fraction of 22 immune cells in . In general, we found that M2 macrophages (12.28%), T follicular helper cells (6.60%), and resting memory CD4 T cells (6.31%) had the highest mean infiltration fraction, whereas naive CD4 T cells (0.12%), eosinophils (0.31%), and resting NK cells (0.66%) had the lowest infiltration fraction ().
Table 2. Infiltration fraction of 22 immune cells among 2086 OC patients
Figure 1. Absolute infiltration fraction overview of 22 immune cells across 2806 OC patients with CIBERSORT P-value <0.5. Each blue dot represents the infiltration fraction of certain immune cells in a patient. OC, ovarian cancer
An immune risk model based on the fraction of 22 immune cells and patient outcome
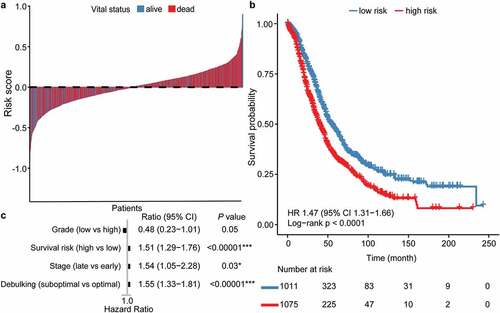
To procure a prognostic implication of immune cell subtypes, we grouped the cells of 2086 CIBERSORT P < .05 patients into quantiles according to the absolute immune cell fraction score and treated quantiles as category variables in subsequent analyses. Quantiles of the absolute infiltration proportion of each immune cell were computed for OS analysis. First, we calculated the survival risk score by fitting the absolute infiltration fraction into the survival regression model (Table S3). Then, we assigned patients whose risk score was larger than the mean value of 1.486e-17 (SD: 0.225) to the high-risk group and others to the low-risk group. Patients with higher survival risk score mean they would have worse outcomes and vice versa. The model robustly stratified patients with better (median OS: 55.0 months) and worse (median OS: 39.8 months) outcomes (HR: 1.47, 95% CI: 1.31–1.66, P < .0001; Table S4, ). Risk stratification remained statistically significant after adjusting for confounding factors such as grade, stage, and debulking status (HR: 1.51, 95% CI: 1.29–1.76, P < .00001; ).
Figure 2. Patient stratification by immune infiltration derived prognostic immune score. (a) Risk score landscape among dead and alive OC patients, the dashed line denotes the mean. Patients with risk score larger than mean are categorized as “high risk,” otherwise “low risk.” (b, c) Kaplan–Meier and Cox survival analysis of “low-risk” and “high-risk” groups with OS as endpoint. OC, ovarian cancer. OS, overall survival
Infiltration fraction of 22 immune cells across clinicopathological subgroups of patients
Next, we analyzed the infiltration fraction of immune infiltration with clinicopathological characteristics. As shown in , the infiltration fraction of 22 immune cells varied significantly across different clinicopathological (grade, stage, type, survival risk, and EMT) subgroups of patients. The number of immune cell types with significant infiltration differences was most among patients with different survival risks and EMT status (). Notably, the infiltration fraction of the most infiltrating M2 macrophages was 10.20% among patients with low survival risk versus 14.25% among patients with high survival risk (P = 3.60e-61), and 11.54% among patients with epithelial type versus 12.94% among patients with mesenchymal type (P = 4.50e-08). There was no statistical difference in the infiltration of M2 macrophages among other patient subgroups.
Table 3. Differential infiltration of immune cells across patient subgroups
Prognostic relevance of immune cells under distinct clinicopathological characteristics
Long-term clinical practice showed that clinicopathological characteristics such as grade, stage, and type status might affect the prognosis of OC. Our data in Table S4 also confirmed the different OS among patients with distinct grades, stages, and types. Given prognostic differences across these patient subgroups, we tried to explore the prognostic relevance of a particular immune cell type and how these associations varied by clinical characteristics. Prognostic relevant immune cells varied among OC patients with distinct clinicopathological characteristics (). Among patients with high-grade OC, M1 macrophages (HR: 0.83, 95% CI: 0.72–0.95, P = .008) were significantly associated with better outcomes, whereas M2 macrophages (HR: 1.14, 95% CI: 1.00–1.30, P = .04) and neutrophils (HR: 1.16, 95% CI: 1.02–1.32, P = .02) were significantly associated with worse outcomes (Figure S4a). Among patients with low-grade OC, activated dendritic cells (HR: 0.20, 95% CI: 0.04–0.96, P = .04) were significantly associated with better outcomes, whereas follicular helper T cells (HR: 9.20, 95% CI: 1.70–49.76) were significantly associated with worse outcomes (Figure S4b).
Figure 3. Hazard ratio of immune infiltration level in patients with different grades, stages, and types of OC, respectively, with multivariate cox as a model. Twenty-two immune cell infiltration quarantine level as variables, and OS as the endpoint. Only significant results were presented and thus data of patients with early-stage OC were not shown. The absolute infiltration fraction for each immune cell was grouped by median, where 0% ≤ Q1 (low) < 50%, and 50% ≤ Q2 (high) ≤ 100%. OC, ovarian cancer
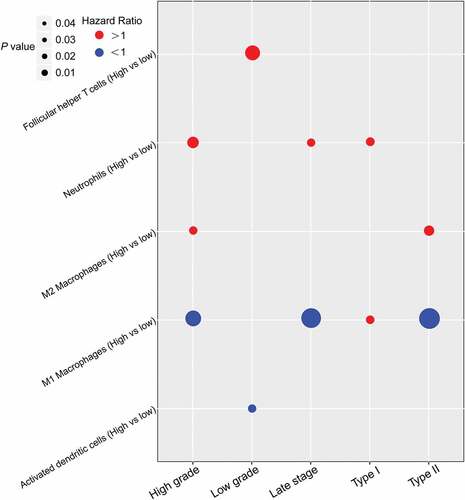
Among patients with late-stage OC, M1 macrophages (HR: 0.80, 95% CI: 0.70–0.92, P = .001) were significantly associated with better outcomes, whereas neutrophils (HR: 1.14, 95% CI: 1.00–1.30, P = .04) were associated with worse outcomes (Figure S5a). Among patients with early-stage OC, none immune cell was significantly associated with patient outcome (Figure S5b). Among patients with type-II OC, M1 macrophages (HR: 0.77, 95% CI: 0.66–0.90, P = 9e−04) were significantly associated with better outcomes, whereas M2 macrophages (HR: 1.17, 95% CI: 1.01–1.35, P = .03) were significantly associated with worse outcomes (Figure S6a). In contrast, among patients with type-I OC, no immune cells were found to be significantly associated with better outcomes, whereas neutrophils (HR: 1.73, 95% CI: 1.03–2.93, P = .04) and M1 macrophages (HR: 1.78, 95% CI: 1.02–3.10, P = .04) were significantly associated with worse outcomes (Figure S6b).
In general, M1 macrophages appeared to have opposite effects on the prognosis of OC patients with different types. Follicular helper T cells had the greatest negative effect on prognosis (HR: 9.20, P = .01) in patients with low-grade OC among all prognostic relevant immune cells.
Correlation between EMT and immune infiltration
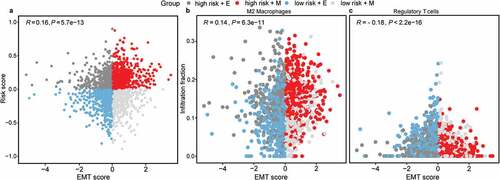
Considering the potential effect of EMT on patients’ prognosis and immune escape in OC, we further explored the correlation of EMT between prognostic risk score and 22 immune cells. There was a significant positive correlation between EMT and survival risk score (R = 0.16, P = 5.7e−13, ). In total, 16 of the 22 immune cells showed a significant correlation with EMT. Eleven immune cell types were positively correlated with EMT, and five were negatively correlated ( and Figure S7). M2 macrophages showed the strongest positive correlation (R = 0.14, P = 6.3e−11) with EMT, whereas Tregs showed the strongest negative correlation (R = – 0.18, P < 2.2e−16) with EMT among all 16 cell types ().
Figure 4. Correlations between EMT and immune infiltration. The Pearson correlation between EMT score and (a) immune risk score (R = 0.16, P = 5.7e−13), (b) M2 macrophages (R = 0.14, P = 6.3e−11), and (c) regulatory T cells (R = – 0.18, P < 2.2e−16), respectively. “High risk” and “E” OC were colored with “dark gray,” “high risk” and “M” OC were colored with “red,” “low risk” and “E” OC were colored with “blue,” “low risk” and “M” OC were colored with “light gray.” OC, ovarian cancer. E, epithelial. M, mesenchymal
Expression patterns of immune checkpoints varied by clinicopathological status
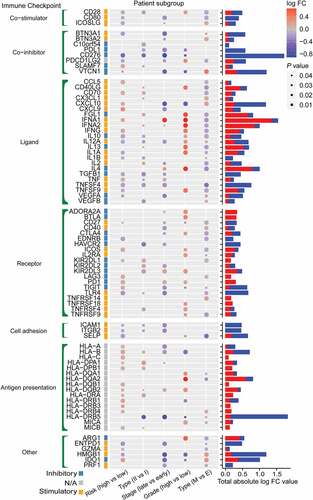
Only by understanding the prognostic relevance of certain immune cell types under the influence of clinical and molecular characteristics can we specifically target immune cells. Immune checkpoint blockade therapy provides therapeutic targets for particular immune cells. However, the mechanism by which expression of immune checkpoint varied by clinicopathological characteristics remained unclear. Therefore, we examined the expression patterns of crucial immunomodulators across 2086 patients. A total of 79 immunomodulators involved in the analysis encompassed sets of stimulators, inhibitors, ligands, receptors, cell adhesion, antigen presentation, and other modulators. The differential expression of these immunomodulators varied significantly across five (survival risk, type, stage, grade, and EMT status) patient subgroups (). The most differentially expressed immune checkpoints between the cohorts included CXCL10, VEGFA, HLADRB1, and HLADRB5. IFNG and TNFSF9 were differentially expressed across all five subgroups. The latest identified immune checkpoint inhibitor FGL1,Citation23 as a major immune inhibitory ligand of LAG-3, demonstrated different expression levels only in patient with different pathological grades. In general, expression levels of immunosuppressors were higher, and expression levels of stimulators were much lower among patients (high-risk, type II, late-stage, high-grade, and M-type) with worse outcomes (, Table S4).
Figure 5. Differential expression patterns of 79 immunoregulators across patient subgroups with “high-risk” against “low-risk,” “type-II” against “type-I,” “late-stage” against “early-stage,” “high-grade” against “low-grade,” and “M-type” and “E-type” OC, respectively. The right histogram sums up the total “up” (blue) and “down” (red) absolute log FC values of each immunomodulator. OC, ovarian cancer. E, epithelial. M, mesenchymal
Discussion
Based on the tissue bulk expression profiles of 3071 patients with OC from 22 cohorts, we uncovered the diverse infiltration patterns of 22 immune cells across 2086 patients with CIBESORT P < .05. The heterogeneous prognostic implications of immune infiltration and the expression patterns of immune checkpoints under different clinicopathological characteristics were also revealed. To our knowledge, the present study was the most extensive report to investigate the heterogeneity of immune microenvironment in OC to date. The immune microenvironment has always been intricate; our findings provided the possibility to understand the low response rate of immunotherapy in OC and yielded new insights into the prognostic prediction and tailored immunotherapy for patients with OC.
First, we constructed an immune risk model to stratify OC patients with different survival risks, which could complement the prognostic value of the existing FIGO staging. For patients with low survival risk indicated by the immune risk model, conventional treatments may be sufficiently effective for most patients. However, for patients with a higher survival risk, a combination of surgery and chemotherapy is often insufficient to inhibit disease progression, and hence, prognosis prediction based on this risk model for these patients is more clinically instructive. This unbiased model included various clinicopathological features of patients with OC in the context of heterogeneity. So far, many prognostic models based on expression profiles have been developed for OC.Citation19 In this study, we applied the state-of-the-art tool CIBERSORT and enrolled large heterogeneous patient cohorts to explore the association between immune infiltration and prognosis; thus, our model was universal.
This study showed several interesting findings regarding the prognostic relevance of several well-known immune cells (e.g., M1 macrophages, CD8 T cells, and Tregs). M1 macrophages and CD8 T cells have been reported to be associated with better outcomes, whereas Tregs associated with worse outcomes in OC.Citation9,Citation24,Citation25 Our study indicated that M1 macrophages were associated with better outcomes among patients with high-grade, late-stage, and type-II OC, while associated with worse outcomes among patients with type-I OC. Abdullah et al. observed two different phenotypes within M1 macrophages.Citation26 Furthermore, Cho et al. proved M1 macrophages augmented ovarian cancer cell metastasis through activation of NF-κB.Citation27 Therefore, our study, together with previous studies, suggested the heterogeneous effects of M1 macrophages on the prognosis of patients with OC.
However, CD8 T cells and Tregs cells were not found to be associated with prognosis in any patient subgroup in this study. Although Tregs were well known to be associated with poor prognosis, a meta-study of 800 patients with OC found no association between Tregs and patient outcomes.Citation28 These seemingly contradictory findings may be attributable to the following three aspects. On the one hand, from the perspective of immune checkpoints, the different prognostic impact of immune cells across patient subgroups may be attributed to the immunosuppressive tumor microenvironment. On the other hand, there may be functional subtypes of immune cells that could not yet be identified by CIBERSORT.Citation29 For instance, exhausted CD8 T cells characterized by the immunosuppressive hallmarks of PD1, LAG3, and IL10 showed antitumor activity dysfunction in many cancers.Citation30,Citation31 Last but not least, functional heterogeneity may also result from different histological localization of immune cells in OC.Citation32 Goode et al. reported the positive prognostic role of CD8 T cells among patients with high-grade serous, endometrioid, and mucinous ovarian cancer but not clean cell and low-grade serous ovarian cancer.Citation9 However, they only considered CD8 T cells in the intraepithelial component of the tumor. In this study, the prognostic relevance of immune infiltrates we discussed was the combined effects of intraepithelial and stromal immune cells.
Furthermore, findings of the heterogeneous immune microenvironment revealed in this study also provided instructive immunotherapeutic strategies. In general, the present study revealed that among all investigated immune cells, M2 macrophages (12.28%) were the ones with the largest infiltration fraction, whereas that of activated NK cells was only 4.23%. OC has been deemed as “cold tumor.”Citation33 Exploring effective means to turn the “cold” to “hot” cancer is a topic, such as how to increase the infiltration of antitumor NK cells. Among all patients, the high-grade subgroup had the most prognostic relevant immune cells, which meant that patients in this group would have more targeted options in immunotherapy.
Previous studies indicated that activated M1 macrophages had antitumor properties, whereas alternatively activated M2 macrophages had pro-tumoral properties. Given the plasticity and opposite prognostic effect of M1 macrophages on OC patients, the phenotype reprogramming of M1 into M2 macrophages would be an important direction of immunotherapy in patients with type-I OC. The present study revealed that among all investigated immune cells, M2 macrophages (12.28%) were the ones with the largest infiltration fraction. Omentum and ascites are specific mediators of OC metastasis, and macrophages account for more than 60% of the total cells in these areas,Citation34 which is consistent with the conclusion of this study. Neutrophils also reported promoting the formation of premetastatic omental niche in OC.Citation35 Thus, blocking the influx of neutrophils and macrophages might be an effective way to inhibit the abdominal metastasis of OC.
Transcoelomic spread and resistance to chemotherapy were essential hallmarks of refractory OC where EMT played an important role.Citation14 Macrophages and dendritic cells were reported to regulate the process of EMT through immunosuppressive TGFβ,Citation36,Citation37 which bridge the interplay between immune cells, immune checkpoints, and EMT. Furthermore, plasticity was a hallmark of macrophages. Therefore, plastic process of EMT lies at the core of regulatory networks composed of immune cells and immune checkpoints. Considering the extensive association between immune cells, EMT, and immune checkpoints, our findings suggest that multipronged approaches may be more effective for future immunotherapy. Moreover, differential expression patterns revealed that inhibitory checkpoint targets, such as PD1, might be more effective among patients with high-risk, late-stage, and high-grade OC than patients with low-risk, early-stage, and low-grade OC. Another strategy was to relieve the inhibition of immune cells such as exhausted CD8 T cells by immune checkpoints such as PD1, IL-10, LAG3 and restore their antitumor immunity.
The study on the heterogeneity of the immune microenvironment of ovarian cancer by introducing the unbiased tool CIBERSORT and the large number of heterogeneous patient samples provides us several inspirations in the future. First, to explore the immune microenvironment of specific tissue locations, we need to purify different parts of the tumor tissue with the help of microdissection, because the prognostic impact of immune cells varied depending on their location, such as Tregs.Citation38 Second, to explore the interaction between immune cells and between immune checkpoints, we will explore the interaction network at the level of the entire immune system. Third, considering the important role of chemotherapy in the current treatment of OC, which could increase neoantigen and immune infiltration,Citation39 the modification of the immune microenvironment needs to take into account by the multi-pronged combined therapy strategy.
This multicenter, large cohort study showed the extensive heterogeneity of immune cell infiltration, prognostic relevance of immune infiltration, and immune checkpoint expression in OC. The heterogeneous immune microenvironment might yield new insights into the dilemma of immunotherapy in OC and help offer guidance for the prognostic prediction and tailored immunotherapy of OC.
Abbreviations
Authors’ contributions
Yue Gao designed the study. Lingxi Chen carried out data analyses. Yue Gao and Lingxi Chen drafted the article. Qinglei Gao and Shuaicheng Li critically revised the manuscript. All authors approved the final submitted manuscript.
Availability of data and materials
GEO data sets were available at GEO repository (https://www.ncbi.nlm.nih.gov/geo/); TCGA data set was available at UCSC Xena (https://xenabrowser.net/datapages/); clinicopathological information of patients was available in Table S1.
Disclosure of interest
The authors report no conflict of interest.
Ethics approval
This study was performed in agreement with the Declaration of Helsinki and approved by the local institutional ethical committee of Huazhong University of Science and Technology.
Supplemental Material
Download ()Acknowledgments
We thank City University of Hong Kong for providing the computing resources.
Supplementary material
Supplemental data for this article can be accessed on the publisher’s website.
Additional information
Funding
References
- Giornelli GH. Management of relapsed ovarian cancer: a review. Springerplus. 2016;5(1):1197. doi:10.1186/s40064-016-2660-0.
- Kossai M, Leary A, Scoazec J-Y, Genestie C. Ovarian cancer: a heterogeneous disease. Pathobiology. 2018;85(1–2):41–11. doi:10.1159/000479006.
- Liu B, Song Y, Liu D. Recent development in clinical applications of PD-1 and PD-L1 antibodies for cancer immunotherapy. J Hematol Oncol. 2017;10(1):174. doi:10.1186/s13045-017-0541-9.
- Schwab CL, English DP, Roque DM, Pasternak M, Santin AD. Past, present and future targets for immunotherapy in ovarian cancer. Immunotherapy. 2014;6(12):1279–1293. doi:10.2217/imt.14.90.
- Sang W, Zhang Z, Dai Y, Chen X. Recent advances in nanomaterial-based synergistic combination cancer immunotherapy. Chem Soc Rev. 2019;48(14):3771–3810. doi:10.1039/c8cs00896e.
- Drakes ML, Stiff PJ. Regulation of ovarian cancer prognosis by immune cells in the tumor microenvironment. Cancers (Basel). 2018:10. doi:10.3390/cancers10090302.
- Dong HP, Elstrand MB, Holth A, Silins I, Berner A, Trope CG, Davidson B, Risberg B. NK- and B-cell infiltration correlates with worse outcome in metastatic ovarian carcinoma. Am J Clin Pathol. 2006;125(3):451–458. doi:10.1309/15b66dqmfyym78cj.
- Fridman WH, Pages F, Sautes-Fridman C, Galon J. The immune contexture in human tumours: impact on clinical outcome. Nat Rev Cancer. 2012;12(4):298–306. doi:10.1038/nrc3245.
- Goode EL, Block MS, Kalli KR, Vierkant RA, Chen W, Fogarty ZC, Gentry-Maharaj A, Tołoczko A, Hein A, Bouligny ALJensen A, et al. Dose-response association of cd8+ tumor-infiltrating lymphocytes and survival time in high-grade serous ovarian cancer. Jama Oncol. 2017;3:e173290. doi: 10.1001/jamaoncol.2017.3290.
- Kurman RJ, Shih I-M. The dualistic model of ovarian carcinogenesis: revisited, revised, and expanded. Am J Pathol. 2016;186(4):733–747. doi:10.1016/j.ajpath.2015.11.011.
- Kuwada K, Kagawa S, Yoshida R, Sakamoto S, Ito A, Watanabe M, Ieda T, Kuroda S, Kikuchi S, Tazawa H, et al. The epithelial-to-mesenchymal transition induced by tumor-associated macrophages confers chemoresistance in peritoneally disseminated pancreatic cancer. J Exp Clin Cancer Res. 2018;37(1):307. doi:10.1186/s13046-018-0981-2.
- Oh E, Hong J, Yun CO. Regulatory T cells induce metastasis by activating Tgf-beta and enhancing the epithelial-mesenchymal transition. Cells. 2019:8. doi:10.3390/cells8111387.
- Wang L, Saci A, Szabo PM, Chasalow SD, Castillo-Martin M, Domingo-Domenech J, Siefker-Radtke A, Sharma P, Sfakianos JP, Gong Y, et al. EMT- and stroma-related gene expression and resistance to PD-1 blockade in urothelial cancer. Nat Commun. 2018;9(1):3503. doi:10.1038/s41467-018-05992-x.
- Mak MP, Tong P, Diao L, Cardnell RJ, Gibbons DL, William WN, Skoulidis F, Parra ER, Rodriguez-Canales J, Wistuba II, et al. A patient-derived, pan-cancer EMT signature identifies global molecular alterations and immune target enrichment following epithelial-to-mesenchymal transition. Clin Cancer Res. 2016;22(3):609–620. doi:10.1158/1078-0432.CCR-15-0876.
- Newman AM, Liu CL, Green MR, Gentles AJ, Feng W, Xu Y, Hoang CD, Diehn M, Alizadeh AA. Robust enumeration of cell subsets from tissue expression profiles. Nat Methods. 2015;12(5):453–457. doi:10.1038/nmeth.3337.
- Kehoe S, Hook J, Nankivell M, Jayson GC, Kitchener H, Lopes T, Luesley D, Perren T, Bannoo S, Mascarenhas M, et al. Primary chemotherapy versus primary surgery for newly diagnosed advanced ovarian cancer (CHORUS): an open-label, randomised, controlled, non-inferiority trial. Lancet. 2015;386(9990):249–257. doi:10.1016/S0140-6736(14)62223-6.
- Wang C, Armasu SM, Kalli KR, Maurer MJ, Heinzen EP, Keeney GL, Cliby WA, Oberg AL, Kaufmann SH, Goode EL, et al. Pooled clustering of high-grade serous ovarian cancer gene expression leads to novel consensus subtypes associated with survival and surgical outcomes. Clin Cancer Res. 2017;23(15):4077–4085. doi:10.1158/1078-0432.CCR-17-0246.
- Ladanyi M, Ali HR, Chlon L, Pharoah PDP, Markowetz F, Caldas C. Patterns of immune infiltration in breast cancer and their clinical implications: a gene-expression-based retrospective study. PLoS Med. 2016:13. doi:10.1371/journal.pmed.1002194.
- Shen S, Wang G, Zhang R, Zhao Y, Yu H, Wei Y, Chen F. Development and validation of an immune gene-set based prognostic signature in ovarian cancer. EBioMedicine. 2019;40:318–326. doi:10.1016/j.ebiom.2018.12.054.
- Law CW, Chen Y, Shi W, Smyth GK. voom: precision weights unlock linear model analysis tools for RNA-seq read counts. Genome Biol. 2014;15(2):R29. doi:10.1186/gb-2014-15-2-r29.
- Byers LA, Diao L, Wang J, Saintigny P, Girard L, Peyton M, Shen L, Fan Y, Giri U, Tumula PK, et al. An epithelial-mesenchymal transition gene signature predicts resistance to EGFR and PI3K inhibitors and identifies Axl as a therapeutic target for overcoming EGFR inhibitor resistance. Clin Cancer Res. 2013;19(1):279–290. doi:10.1158/1078-0432.CCR-12-1558.
- Thorsson V, Gibbs DL, Brown SD, Wolf D, Bortone DS, Ou Yang T-H, Porta-Pardo E, Gao GF, Plaisier CL, Eddy JA, et al. The immune landscape of cancer. Immunity. 2019;51(2):411–412. doi:10.1016/j.immuni.2019.08.004.
- Wang J, Sanmamed MF, Datar I, Su TT, Ji L, Sun J, Chen L, Chen Y, Zhu G, Yin W, et al. Fibrinogen-like protein 1 is a major immune inhibitory ligand of LAG-3. Cell. 2019;176(1–2):334–347 e312. doi:10.1016/j.cell.2018.11.010.
- Curiel TJ, Coukos G, Zou L, Alvarez X, Cheng P, Mottram P, Evdemon-Hogan M, Conejo-Garcia JR, Zhang L, Burow M, et al. Specific recruitment of regulatory T cells in ovarian carcinoma fosters immune privilege and predicts reduced survival. Nat Med. 2004;10(9):942–949. doi:10.1038/nm1093.
- Guo L, Zhang Y, Yang Z, Peng H, Wei R, Wang C, Feng M. Tunneling nanotubular expressways for ultrafast and accurate M1 macrophage delivery of anticancer drugs to metastatic ovarian carcinoma. ACS Nano. 2019;13(2):1078–1096. doi:10.1021/acsnano.8b08872.
- Xue J, Schmidt SV, Sander J, Draffehn A, Krebs W, Quester I, De Nardo D, Gohel T, Emde M, Schmidleithner L, et al. Transcriptome-based network analysis reveals a spectrum model of human macrophage activation. Immunity. 2014;40(2):274–288. doi:10.1016/j.immuni.2014.01.006.
- Cho U, Kim B, Kim S, Han Y, Song YS. Pro-inflammatory M1 macrophage enhances metastatic potential of ovarian cancer cells through NF-κB activation. Mol Carcinog. 2018;57(2):235–242. doi:10.1002/mc.22750.
- Shang B, Liu Y, Jiang S-J, Liu Y. Prognostic value of tumor-infiltrating FoxP3+ regulatory T cells in cancers: a systematic review and meta-analysis. Sci Rep. 2015;5(1):15179. doi:10.1038/srep15179.
- Coffre M, Placek K, Maiella S, Bianchi E, Rogge L. Single-cell analysis techniques reveal a striking heterogeneity of human CD4+ T cell subsets. J Transl Med. 2010:8. doi:10.1186/1479-5876-8-s1-o5.
- Alsaab HO, Sau S, Alzhrani R, Tatiparti K, Bhise K, Kashaw SK, Iyer AK. PD-1 and PD-L1 checkpoint signaling inhibition for cancer immunotherapy: mechanism, combinations, and clinical outcome. Front Pharmacol. 2017;8:561. doi:10.3389/fphar.2017.00561.
- K F, K Y, T O. Overview of LAG-3-expressing, IL-10-producing regulatory T cells. Curr Top Microbiol Immunol. 2017;17:410. doi:10.1007/82_2017_59.
- Sato E, Olson SH, Ahn J, Bundy B, Nishikawa H, Qian F, Jungbluth AA, Frosina D, Gnjatic S, Ambrosone C, et al. Intraepithelial CD8+ tumor-infiltrating lymphocytes and a high CD8+/regulatory T cell ratio are associated with favorable prognosis in ovarian cancer. Proc Natl Acad Sci U S A. 2005;102(51):18538–18543. doi:10.1073/pnas.0509182102.
- Corradetti B, Pisano S, Conlan RS, Ferrari FM. Nanotechnology and immunotherapy in ovarian cancer: tracing new landscapes. J Pharmacol Exp Ther. 2019;370(3):636–646. doi:10.1124/jpet.118.254979.
- van Furth R, Raeburn JA, van Zwet TL. Characteristics of human mononuclear phagocytes. Blood. 1979;54(2):485–500. doi:10.1182/blood.V54.2.485.485.
- Lee W, Ko SY, Mohamed MS, Kenny HA, Lengyel E, Naora H. Neutrophils facilitate ovarian cancer premetastatic niche formation in the omentum. J Exp Med. 2019;216(1):176–194. doi:10.1084/jem.20181170.
- Li MO, Wan YY, Sanjabi S, Robertson AK, Flavell RA. Transforming growth factor-beta regulation of immune responses. Annu Rev Immunol. 2006;24(1):99–146. doi:10.1146/annurev.immunol.24.021605.090737.
- Mills CD. Anatomy of a discovery: m1 and m2 macrophages. Front Immunol. 2015;6:212. doi:10.3389/fimmu.2015.00212.
- Li J, Wang J, Chen R, Bai Y, Lu X. The prognostic value of tumor-infiltrating T lymphocytes in ovarian cancer. Oncotarget. 2017;8(9):15621–15631. doi:10.18632/oncotarget.14919.
- Lo CS, Sanii S, Kroeger DR, Milne K, Talhouk A, Chiu DS, Rahimi K, Shaw PA, Clarke BA, Nelson BH, et al. Neoadjuvant chemotherapy of ovarian cancer results in three patterns of tumor-infiltrating lymphocyte response with distinct implications for immunotherapy. Clin Cancer Res. 2017;23(4):925–934. doi:10.1158/1078-0432.CCR-16-1433.