
ABSTRACT
The induction of tumor-targeted, cytotoxic T lymphocytes has been recognized as a key component to successful immunotherapy. DPX-based treatment was previously shown to effectively recruit activated CD8+ T cells to the tumor. Herein, we analyze the unique phenotype of the CD8+ T cells recruited into the tumor in response to DPX-based therapy, and how combination with checkpoint inhibitors impacts T cell response. C3-tumor-bearing mice were treated with cyclophosphamide (CPA) for seven continuous days every other week, followed by DPX treatment along with anti-CTLA-4 and/or anti-PD-1. Efficacy, immunogenicity, and CD8+ T cells tumor infiltration were assessed. The expression of various markers, including checkpoint markers, peptide specificity, and proliferation and activation markers, was determined by flow cytometry. tSNE analysis of the flow data revealed a resident phenotype of CD8+ T cells (PD-1+TIM-3+CTLA-4+) within untreated tumors, whereas DPX/CPA treatment induced recruitment of a novel population of CD8+ T cells (PD-1+TIM-3+CTLA-4−) within tumors. Combination of anti-CTLA-4 (ipilimumab) with DPX/CPA versus DPX/CPA alone significantly increased survival and inhibition of tumor growth, without changing overall systemic immunogenicity. Addition of checkpoint inhibitors did not significantly change the phenotype of the newly recruited cells induced by DPX/CPA. Yet, anti-CTLA-4 treatment in combination with DPX/CPA enhanced a non-antigen specific response within the tumor. Finally, the tumor-recruited CD8+ T cells induced by DPX/CPA were highly activated, antigen-specific, and proliferative, while resident phenotype CD8+ T cells, seemingly initially exhausted, were reactivated with combination treatment. This study supports the potential of combining DPX/CPA with ipilimumab to further enhance survival clinically.
Introduction
Cancer immunotherapy has grown to become a clinically viable alternative to traditional treatments such as radiation, chemotherapy, and targeted therapies. Having demonstrated clinical efficacy in a significant number of patients, research in immunotherapy is shifting its focus to understanding the biological mechanisms of resistance in order to improve clinical outcome. Treatment challenges remain, given that tumors are highly heterogeneous. The analysis of cell populations in tumors has shown that they are composed of a complex mix of tumor cells, stroma cells and leukocytes. Some cells within the tumor may be susceptible to a targeted immune response, while others may be resistant, or may be contributing to a protumorigenic and/or immunosuppressive environment.Citation1 One approach to address this heterogeneity is to combine immunotherapies that target different components of the tumor microenvironment.Citation2
Detailed immune analysis of leukocytes in tumors reveals a continuum of immune infiltrates, ranging from “cold” (little to no infiltrate) to “hot” (highly infiltrated), with approved immunotherapies demonstrating inferior efficacy in “cold” tumors”.Citation3 The hypothesized approach to treating immunotherapy-resistant tumors is to use immunotherapy that induces immune cell, particularly cytotoxic T cell, infiltration into the tumor. Therefore, the most successful treatment regimens will include technologies that stimulate the infiltration of antigen-activated cells, such as CD8+ T cells, and combine these treatments with agents that target mechanisms of immune suppression, facilitating the tumor-killing capacity of infiltrating cells.
The DPX platform is a water-free lipid-based formulation, where antigens and adjuvants can be combined into an oil phase and injected subcutaneously. When it is administered in vivo, rather than passively releasing its contents at the site of injection, the components are retained, forcing an active process by which antigen-presenting cells take up the components and transport them to regional lymph nodes.Citation4 When containing MHC class I restricted epitopes, DPX-based formulations comprise an in vivo T cell targeting immunotherapy that induces robust immune responses both in preclinical animal studies and in clinical trials.Citation5,Citation6 In the clinic, the most advanced product is DPX-Survivac, containing minimal peptide epitopes from survivin, a key component of tumor cell biology.Citation5,Citation6 DPX-Survivac has been used in several cancer types, including advanced ovarian cancer, and is currently being studied in ongoing Phase 2 trials (NCT02785250, NCT03836352, NCT03029403). DPX-Survivac-based immunotherapy has the capacity to induce T cell immune responses as a monotherapy, and administering it with intermittent oral low dose cyclophosphamide (CPA) has been demonstrated, both preclinically and clinically, to enhance antigen-specific immune responses.Citation5 The proposed mechanism of action for the improved response, as explored in preclinical mouse models, is that when CPA is given early in the treatment cycle, CPA transiently depletes lymphocytes; facilitating an enhanced antigen-specific CD8+ T cell response by DPX treatment, with strong cytotoxic T lymphocyte activity in the lymph nodes and the tumor.Citation5
However pivotal, a robust antigen-specific CD8+ infiltrate may not be sufficient to induce a clinically meaningful response in all patients.Citation3 Many tumors can suppress CD8+ T cell response by inducing an immunosuppressive environment, which can include: induction of an acidic environment,Citation7 recruitment of suppressive immune cells such as T regulatory cells and myeloid-derived suppressor cells,Citation8,Citation9 and induction of checkpoint markers on immune cells.Citation10–Citation12 Checkpoint markers (e.g. PD-1 and CTLA-4) are immune receptors whose expression can lead to cell anergy. Many cancers have been shown to upregulate the PD-1 ligand, PD-L1.Citation13 Interactions between PD-1 and PD-L1 can result in inhibition of T cell activities and suppression of T cell proliferation.Citation14 By blocking this interaction with monoclonal antibodies targeting either the ligand or the receptor, immune suppression via this mechanism is hindered, which can then allow for an effector immune response to occur within the tumor.Citation15,Citation16
In a preclinical C3 model, a C57BL/6-derived tumor that presents the HPV-16 E749-57 peptide (R9F peptide) in the context of class I MHC molecules,Citation17 we have shown that combining DPX-FP (containing the R9F peptide and also referred to as DPX onwards)/CPA treatment with antibody targeting PD-1 results in greater tumor suppression than DPX/CPA regimen.Citation18 There are approved antibodies for the treatment of cancer patients that inhibit checkpoint markers, including PD-1 (e.g., pembrolizumab and nivolumab) or CTLA-4 (e.g., ipilimumab).Citation19 Other checkpoint inhibitors, such as TIM-3 and LAG-3, are also being investigated to determine if blocking these receptors in patients enhances clinical responses.Citation20,Citation21 Similarly, agonist antibodies that activate receptors (such as OX-40 and GITR),Citation22,Citation23 and therefore enhance an immune response, are also being examined.
The objectives of this work were to: First, investigate whether DPX/CPA treatment modifies the expression of checkpoint markers in the tumor infiltrate and recruitment of cells expressing these receptors in our preclinical C3 model; and secondly, to determine whether the use of checkpoint inhibitors, specifically anti-CTLA-4, anti-PD-1, and anti-TIM-3 antibodies, improves the anti-tumoral mechanisms induced by DPX-based immunotherapies.
In order to determine the best DPX-checkpoint inhibitor combination, we performed an in-depth analysis of the impact of the treatment on the immune infiltrates of the tumor, with a focus on treatment-induced, cytotoxic, antigen-specific T cells. The analysis of tumor-infiltrating cells using flow cytometry has traditionally examined general changes in the population, with only a few selected parameters being analyzed against each other at a time, which may limit the ability to see unexpected or previously undescribed population changes. Recently, there has been a shift toward looking at individual cells rather than the entire cell population as a whole, which further allows us to analyze multiple parameters at once. One of these methods is t-distributed stochastic neighbor embedding (tSNE), which allows analysis of all parameters on a per-cell basis, and plotting it on a two-dimensional plot, where each point represents a cell. The nearer two cells are to each other on the plot, the more parameters they have in common. This analysis allows researchers to assess if there are any unique populations based on the clustered parameters within a given cell population, and whether treatment will induce changes in the cell populations, based on the parameters assessed.Citation24
Using tSNE, we analyzed 12-color flow cytometry panels to compare C3 tumor immune cell infiltrate collected from untreated mice and mice treated with DPX/CPA to determine what alterations in immune cell infiltrate were being induced with treatment. We then conducted an in-depth analysis on the cytotoxic antigen-specific T cells. From the tSNE analysis, we selected checkpoint markers that were altered with treatment, and analyzed whether adding monoclonal antibodies targeting these checkpoint markers to the DPX/CPA regimen would enhance tumor suppression, and/or alter tumor-infiltrating cells. tSNE analysis comparing tumor immune cell infiltrate from untreated mice and mice treated with DPX/CPA revealed that DPX/CPA treatment induces recruitment of a new population of highly activated CD8+ T cells into the tumor, which is absent in the tumors of untreated mice. Furthermore, by identifying this new population of cells, we found that blockade of CTLA-4 enhances the anti-tumor effect DPX/CPA regimen has through a unique mechanism.Citation18
Results
Flow analysis indicates DPX-based immunotherapy induces infiltration of T cells, macrophages, and NKT cells into tumors, with a consistent decrease in CTLA-4 expression across multiple leukocyte subsets
We have previously demonstrated that DPX/CPA regimen increases tumor-infiltrating PD-1+ CD8+ T cells compared to no treatment.Citation18 We expanded upon these findings with an in-depth profiling of different populations of tumor-infiltrating leukocytes and assessed how DPX-based immunotherapy combined with CPA alters these cells compared to untreated C3 tumors. Specifically, we analyzed differences in CD8+ T cells, CD4+ T cells, CD19+ B cells, NK1.1+TCRβ− NK cells, NK1.1+TCRβ+ NKT cells, dendritic cells, and F4/80+CD24− macrophages by traditional, immune marker-based flow cytometry. Immune subsets were analyzed in independent panels. Pattern expression is presented relative to fluorescence minus one (FMO) controls. Based on our experience exploring the mechanism of action of this treatment regimen,Citation18 and to ensure mice would develop tumors for leukocyte infiltration analysis at the time of evaluation we initiated CPA treatment 2 weeks after C3 cell implantation and provided a single DPX treatment on study day 21. Mice were then euthanized on study day 31, 10 days after DPX treatment, as previously published.Citation18 As expected under this DPX/CPA regimen, tumor volumes between the treated and untreated groups were similar prior treatment (day 13, untreated group 25.50 ± 8.75 mm3; DPX/CPA group 33.66 ± 5.16 mm3) and at the end of the study (day 31, untreated group 634.8 ± 222.0 mm3; DPX/CPA 141.9 ± 22.98 mm3. p>0.05; Mann Whitney test). In tumors isolated from mice treated with DPX/CPA, there was a significant increase in NKT cells and macrophages compared to untreated mice (). In general, there was also a trend for an increase in total CD3+ T cells within the tumor. Subset analysis of total T cells showed a significant increase in CD8+ T cells within the C3 tumor with DPX/CPA treatment, with no significant increase in CD4+ T cells ().
Figure 1. 'Flow cytometry analysis suggests DPX/CPA treatment causes a decrease in CTLA-4+ tumor-infiltrating cells into the C3 tumor.
We then assessed whether DPX/CPA regimen alters the expression of checkpoint markers in the tumor-infiltrating CD8+ T cells (). As CD8+ T cell recruitment to the tumor is the major effector population responsible for tumor regression with DPX treatment,Citation18 we focused on whether treatment changed the phenotype of these cells within the tumor. Flow cytometry analysis showed that with DPX/CPA treatment there is a significant decrease in the proportion of CTLA-4+ and CD40+ CD8+ T cells, and a significant increase in TIM-3+, LAG-3+, and ICOS+ CD8+ T cells in the tumor (). Analysis of the other cellular infiltrates showed that in all cells analyzed (B cells, CD4+ T cells, dendritic cells, macrophages, NK cells, and NKT cells), the proportion of CTLA-4+ cells was significantly decreased with DPX/CPA treatment, whereas other checkpoint marker molecules were not similarly impacted (i.e. significant decrease across all cell types analyzed) (, data not shown).
tSNE analysis shows significant changes in the CD8+ T cell populations in the tumor microenvironment following DPX-based immunotherapy
We performed tSNE analysis on all the tumor-infiltrating cells that we had analyzed by flow cytometry (CD4+ T cells, B cells, macrophages, dendritic cells, NK cells, and NKT cells) () to determined whether there were changes in individual infiltrating cell populations with DPX/CPA treatment compared to untreated. There was some increased recruitment of specific immune cells into the tumor (Supplementary Figure 1) in response to DPX/CPA regimen compared to untreated. However, we did not see a novel phenotype of cells infiltrating into the tumor in a similarly extensive fashion as what we observed with CD8+ T cells (Supplementary Figure 1 and Figure 2a). Based on this, and the knowledge that CD8+ T cells are likely the major effector cell type induced by DPX treatment,Citation18 we focused on CD8+ T cells for the remainder of these studies.
Figure 2. CD8+ T cells in untreated C3 tumor is PD-1+TIM-3+CTLA-4+, while DPX/CPA treatment induces recruitment of PD-1+TIM-3+CTLA-4− CD8+ T cells.
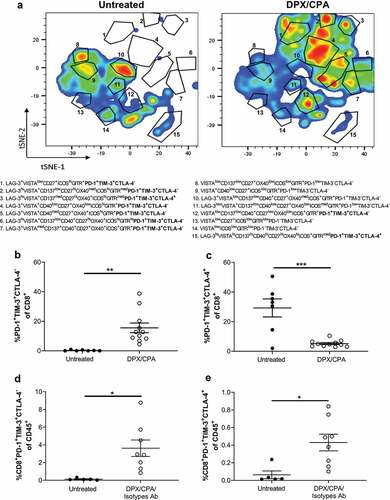
tSNE analysis of bulk CD8+ T cells revealed that DPX/CPA treatment induced recruitment of a novel CD8+ T cell population into the tumor, which is phenotypically distinct from the CD8+ T cells present in the untreated tumor (). By analyzing the tSNE image as a heat map, gating on the cell populations, and analyzing what checkpoint markers were present, the recruited population of CD8+ T cells present in the tumor with DPX/CPA treatment were determined to be predominantly PD-1+TIM-3+CTLA-4− (e.g., subpopulations in gates 1, 2, 4–7, and 12 in representative ), irrespective of any other checkpoint markers analyzed (). Subpopulations that were PD-1+TIM-3+CTLA-4+ (e.g., subpopulations 15 in representative ) were primarily found as “resident phenotype cells” in the untreated tumors (). The ratio of CTLA-4− to CTLA-4+ CD8+ T cells in treated tumors (3.57 ± 0.91) was skewed to CTLA-4− while in the untreated it is skewed toward CTLA-4+ cells (0.070 ± 0.70). When analyzing the percent of CD8+PD-1+TIM-3+CTLA-4− or CD8+PD-1+TIM-3+CTLA-4+ of total CD45+ tumor leukocyte, both populations are significantly increased with treatment compared to the untreated C3 tumors ( and E, respectively), suggesting that although DPX/CPA does recruit a new population of CD8+ T cells into the tumor, it also increases the number of “resident phenotype” CD8+ T cells.
CTLA-4 and TIM-3 inhibition combined with DPX/CPA treatment to enhance survival and inhibition of C3 tumor growth
In our previous work, PD-1 blockade was shown to synergize with DPX and CPA to significantly delay C3 tumor growth and increase survival compared to DPX/CPA regimen.Citation18 Since the two main CD8+ T cell populations within the tumor were PD-1+TIM-3+CTLA-4+/-, we sought to determine if antibodies targeting CTLA-4 or TIM-3 would also enhance the anti-tumor effects of DPX/CPA treatment, in a similar manner to targeting PD-1.
C57BL/6 mice (n = 8/group) were implanted with C3 tumors and were treated with DPX/CPA along with anti-CTLA-4 or anti-TIM-3 antibodies in two separate experiments. Mice implanted with C3 tumors were treated with CPA for a week starting 8 days after implantation. On study day 15, mice were administered DPX. Antibody treatment, including anti-CTLA-4 or anti-TIM-3 therapy, or isotype control, was administered on either day 15, 18, or 21. This treatment regimen was repeated 2 weeks later, with CPA commencing on day 22. In our experience with this model, initiating DPX/CPA regimen on these days provides suboptimal protection from tumor growth; therefore, we considered this to represent more advanced tumors. Anti-CTLA-4 treatment alone had no effect on C3 tumor growth or survival compared to the untreated group ( and b), while combining anti-CTLA-4 treatment with DPX/CPA immunotherapy led to a significant increase in mouse survival when administered on the day of DPX treatment (day 15 and 29) and a significant delay in tumor growth compared to mice treated with DPX/CPA alone ( and b).
Figure 3. Anti-CTLA-4 treatment combined with DPX/CPA treatment to enhance survival and suppress tumor growth, when administered on day of DPX treatment.
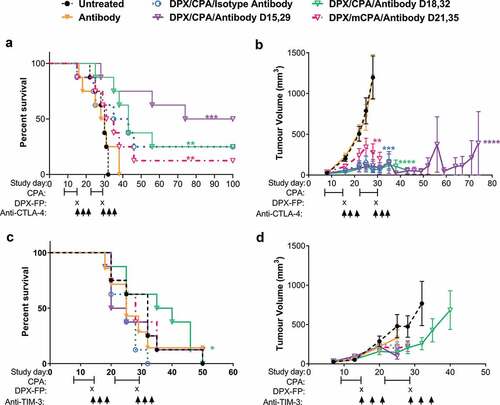
Anti-TIM-3 antibody alone did not impact survival () or tumor growth () significantly compared to untreated group, while anti-TIM-3 treatment administered on day 18 and 32 (3 days post DPX administration) significantly enhanced survival with DPX/CPA compared to DPX/CPA with isotype control. This enhancement was not to the same degree as anti-CTLA-4 enhanced survival despite the marker being expressed on nearly all T cells in the tumor. Due to the differential expression of CTLA-4 on these tumor T cells and due to the availability of a clinically approved target, anti-CTLA-4 treatment was further analyzed to explore its role in this model.
Antibody treatment combined with DPX and low dose cyclophosphamide does not impact expression of receptors or populations of C3 tumor-infiltrating lymphocytes
As anti-PD-1Citation18 and anti-CTLA-4 ( and b) had an impact on survival and tumor growth when in combination with DPX/CPA, we wanted to determine whether the addition of antibody treatment to DPX/CPA treatment further alters the number of CD8+ T cells in the tumor, or the checkpoint markers present on CD8+ T cell infiltrates. As previously described (), CPA treatment was initiated 2 weeks after tumor cell implant, and DPX-FP was administered on day 21 to ensure mice would have tumors at the time of evaluation. Anti-CTLA-4, anti-PD-1, and associated isotypes were administered on days 21 (for anti-CTLA-4), and 27 (for anti-PD-1, as previously determined to be the optimal day for treatmentCitation18). The addition of either antibody treatment alone or together did not significantly alter the increase in CD8+ T cell that DPX/CPA induces by itself (. Gating strategies are indicated in Supplementary Figures 2 to 4). The antibodies with or without DPX/CPA did not modify the subpopulation of PD-1+CTLA-4+ cells (). The combination of both antibodies without DPX, however, did increase the PD-1+CTLA-4− CD8+ T cell population compared to untreated (). Still, this increase was lower than DPX/CPA alone. The DPX/CPA effect was not further enhanced by the addition of both antibodies, either alone or together.
Figure 4. Antibody targeting either PD-1 or CTLA-4 does not alter the DPX/CPA-induced recruitment of PD-1+CTLA-4− CD8+ T cells into the C3 tumor.
DPX/CPA treatment increases effector memory, highly proliferative, antigen-specific, CD8+ T cells with a phenotype that is largely not impacted by checkpoint inhibition
It is known that DPX/CPA treatment induces recruitment of antigen-specific proliferating CD8+ T cells into the tumor,Citation18 but we also wanted to measure whether there were alterations to non-antigen specific CD8+ T cells, and whether they would have proliferative capabilities based on the expression of Ki67 by flow cytometry. The activation status of CD8+ T cell-specific populations such as CTLA-4+ or CTLA-4− was also characterized by examining the expression of the memory markers CD62L and CD44. Antigen-specific CD8+ T cells were identified for their specificity to the R9F peptide antigen, delivered by DPX, using an antigen-specific dextramer (Dex+). Additionally, we determined whether anti-PD-1 or anti-CTLA-4 antibody therapy could alter the characteristics of these populations.
Our analysis shows a higher proportion of CD8+ T effector memory cells (CD44+CD62L−) in the DPX/CPA/antibody-treated mice compared to untreated or antibody only treated mice (). There were no significant differences between DPX/CPA/Isotype antibody-treated mice and mice treated with DPX/CPA/anti-CTLA-4 and/or anti-PD-1. Analysis of these effector memory CD8+ T cells revealed that in the DPX/CPA ± antibody-treated groups a majority were antigen-specific (Dex+) compared to untreated or antibody alone treated mice ( and c). Conversely, a higher proportion of CD8+ T cells (antigen-specific or nonspecific) in untreated or antibody-alone treated mice were naïve (CD44−CD62L+) compared to DPX/CPA/antibody-treated mice, with no significant differences between untreated or antibody-treated only mice (-f).
Figure 5. DPX/CPA causes an increase in effector memory CD8+ T cells into the C3 tumor.
CD8+ T cells within the tumor were further characterized from total T cells. Our data show that mice treated with DPX/CPA had a high number of CD8+ T cells than groups treated with antibodies alone or untreated (). The proliferating status (Ki67+) of both antigen specific and non-antigen specific within the CD8+ T cell population was determined. It was observed that DPX/CPA-treated mice (with or without targeting antibody) had a significant increase in proliferating CD8+ T cells that were both antigen-specific () and non-antigen-specific (), compared to the untreated/antibody alone treated mice. There was also a significant increase of non-proliferating antigen-specific CD8+ T cells in groups treated with DPX/CPA in combination with anti-PD-1 alone or both antibodies in comparison to untreated (). Conversely, and as anticipated, the CD8+ T cells found in untreated/antibody alone treated mice were predominantly non-proliferating and non-antigen-specific ().
Figure 6. DPX/CPA enhances infiltrate of proliferative R9F peptide-specific and nonspecific CD8+ T cells into the C3 tumor.
Within the CD8+ T cell PD-1+TIM-3+, the CTLA-4+/- cells were also analyzed for their antigen-specificity and/or proliferating status. We found that the CTLA-4+ population was not proliferating in the untreated or antibody-treated mice (), while there was proliferation () (both antigen-specific [H] and non-antigen-specific []) in the DPX/CPA/antibody-treated mice. Similarly, in the CTLA-4− population, the non-proliferating cells were also significantly higher in the untreated or antibody-alone treated mice (J), while proliferating CTLA-4− cells () (both antigen-specific [] and non-antigen-specific []) were significantly higher in DPX/CPA/antibody-treated mice. As seen previously, anti-PD-1 or anti-CTLA-4 treatment did not enhance either of these populations more than DPX/CPA already induced. Therefore, the increased novel population of CTLA-4− CD8+ T cells induced by DPX/CPA, or the resident phenotype CTLA-4+ population, is not explicitly antigen-specific or non-antigen-specific, and/or proliferative.
CTLA-4 inhibition does not enhance DPX/CPA-induced IFN-γ response against antigen or C3 cancer cells
Because of the enhanced tumor suppression observed when DPX/CPA is combined with anti-CTLA-4, and our previous data showing that anti-PD-1 enhances IFN-γ production induced by DPX/CPA treatment,Citation18 we assessed whether there was enhanced IFN-γ production when DPX/CPA treatment was combined with either anti-CTLA-4, or anti-PD-1 and anti-CTLA-4 monoclonal antibody treatments combined. The DPX/CPA/antibody regimen schedule for analysis of tumor-infiltrating cells via flow cytometry was used as stated above. Spleens and DPX-draining inguinal lymph nodes from C3 tumor-bearing mice were collected 10 days post DPX treatment for an IFN-γ ELISPOT. Targeted effects were analyzed by exposing cells to the R9F peptide antigen or C3 cells. R9L, an irrelevant peptide, and Panc02 cells were used to determine IFN-γ production due to off-target (i.e. non-R9F specific) immune stimulation.
As expected, DPX/CPA treatment significantly increased the immune response against R9F peptide in both splenocytes and DPX-draining lymph node cells compared to untreated samples or samples treated with antibody alone ( and b). DPX/CPA also significantly increased the immune response against C3 cells in splenocytes, but not in DPX-draining lymph node cells, compared to untreated or antibody alone treated mice (and d).
Figure 7. CTLA-4 blockade does not enhance the impact DPX/CPA treatment has on antigen-specific IFN-γ production.
Anti-CTLA-4 treatment (alone and combined with anti-PD-1) did not increase the immune response to either R9F peptide antigen or C3 cells ( and b). However, there was a trend toward a decrease in response compared to DPX/CPA when anti-CTLA-4 treatment was added to the regimen whereas, the addition of both anti-PD-1/anti-CTLA-4 treatment significantly enhanced an IFN-γ response to C3 cells ( and d) compared to all the other treatment combinations.
DPX/CPA/anti-PD-1/anti-CTLA-4 treatment also induced off-target effects in the spleen and lymph nodes. Splenocytes produced higher levels of IFN-γ in response to stimulation with Panc02 cells when compared to untreated or R9L-activated splenocytes (Supplementary Figure 5A). However, this response was significantly less than the response observed by splenocytes against C3 cells, and with lymph node cells, the response to nonspecific peptide and Panc02 cells was equivalent to the response to R9F and C3 cells, respectively. In addition, unstimulated cells also produced IFN-γ in equivalent levels to cells stimulated with Panc02 or C3 cells (Supplementary Figure 5B).
PD-1 and CTLA-4 blockade combined with DPX/CPA enhances a non-antigen-specific CD8+ T cell infiltrate into the C3 tumor
As anti-CTLA-4 treatment did not alter the R9F peptide antigen response from splenocytes or lymph node cells with DPX/CPA ( and b), we analyzed whether there were alterations in non-antigen-specific responses, or in non-proliferating cells. The non-R9F-specific (Dex−) and Ki67− CD8+ population within the C3 tumor were gated for their analysis. Untreated tumors and tumors treated with the anti-PD-1/anti-CTLA-4 antibody combination showed an increased percentage of non-R9F-specific CD8+ T cells in comparison to the DPX/CPA/isotypes-treated group (). However, a trend for an increase in non-antigen specific CD8+ T cells is observed when DPX/CPA regimen is combined with anti-PD-1 and/or anti-CTLA-4. Analysis of total non-R9F-specific proliferative CD8+ T cells of CD45+ cells was only significantly higher in DPX/CPA/antibody treated samples compared to untreated mice, while the proportion in DPX/CPA/Isotype antibody-treated mice was not significantly elevated compared to untreated ( and c). Of the non-proliferative R9F peptide-specific total CD8+ T cells, anti-PD-1 and anti-CTLA-4 individually combined with DPX/CPA also enhanced (although not significantly) the proportion compared to DPX/CPA treated mice ( and e). Analysis of non-R9F-specific IFN-γ+ CD8+ T cells revealed that DPX/CPA/anti-PD-1 or anti-CTLA-4 elevated this population, with DPX/CPA/anti-CTLA-4 significantly increasing the levels compared to DPX/CPA treatment by itself (), suggesting that antibody treatment combined with DPX/CPA may enhance the non-antigen specific response occurring in the tumor.
Figure 8. PD-1 and CTLA-4 treatment induces non-R9F peptide-specific CD8+ T cell response into the C3 tumor.
When analyzing the PD-1+CTLA-4− CD8+ T cell population in the tumor, DPX/CPA/antibody treatment had higher levels of R9F-specific cells () and proliferating cells () compared to untreated or antibody alone treated group. Interestingly, anti-PD-1/anti-CTLA-4-combined treatment in the absence of DPX/CPA leads to higher levels of non-R9F-specific () and non-proliferative cells () compared to all DPX/CPA/antibody-treated groups, untreated, or anti-CTLA-4 alone treated groups. Similar results were observed for the group treated with anti-PD-1 alone (n = 2). In these populations of CD8+ T cells, antibody combined with DPX/CPA did not alter the non-R9F-specific or non-proliferative population compared to DPX/CPA treatment.
The PD-1+CTLA-4−CD8+ T cell population induced by DPX/CPA are highly activated and DPX peptide-specific
The identified PD-1+CTLA-4− CD8+ T cell population recruited to the C3 tumor with DPX/CPA treatment was further characterized for their antigen specificity, proliferating status, IFN-γ+ production, granzyme B+ content, and expression of the transcription factors Tbet and Eomes following a tSNE analysis of flow cytometry. tSNE analysis showed a novel population of cells being recruited into the tumor with DPX/CPA (Supplementary Figure 6B to E), that was not present in untreated or antibody-alone treated mice (Supplementary Figure 6A and F to H). There were no obvious differences between the tSNE graphs of DPX/CPA/antibody-treated mice (Supplementary Figure 6C, D, and E) and DPX/CPA alone treated mice (Supplementary Figure 6B).
Analysis of the tSNE graphs revealed that the PD-1+CTLA-4−CD8+ T cells that were recruited with DPX/CPA were also predominantly proliferative (Ki67+), antigen-specific (Dex+), and Tbet+Eomes+ (). There were virtually no cells of this phenotype in the untreated or antibody alone treated groups, while it was significantly present with DPX/CPA with or without anti-PD-1 and/or anti-CTLA-4 treatment (). These cells can be IFN-γ+ () or granzyme B+ () although that was not one of the distinguishing markers of this unique population.
Figure 9. The PD-1+CTLA-4− CD8+ T cells induced into the C3 tumor by DPX/CPA treatment is a R9F peptide-specific, proliferative, highly activated population.
Tbet and Eomes can be markers for a variety of phenotypes, including activation and exhaustion status, and markers of effector and memory cells, depending on the level of expression of these markers together. Tbet+Eomes− cells are generally considered effector cells including effector memory cells,Citation25–Citation27 while TbetloEomes+ cells include transitional memory cells and exhausted T cells.Citation25,Citation26,Citation28 Within the CD8+Ki67+Dex+ population, there was no significant difference in TbetloEomes+ expression across the groups regardless of treatment (). In general, there were elevated levels of TbetloEomes+ CD8+ T cells in the tumor with DPX/CPA ± antibody compared to untreated or antibody alone treated groups, but as there were increased levels of CD8+ T cells within the tumor with DPX/CPA regimen, that was to be expected (). Interestingly, we also found with DPX/CPA/antibody treatment, an increase in Tbet+Eomes− cells compared to the untreated group, within the proliferative non-antigen-specific CD8+ population (). This correlates with the increased CD44+CD62L− effector memory phenotype shown in . There were no significant differences when antibody treatment was added to DPX/CPA treatment, compared to DPX/CPA alone treatment.
Within the PD-1+CTLA-4+ population, there was no alteration in the presence of either Tbet+Eomes− () or Tbet+Eomes+ cells () with DPX/CPA treatment. Within the PD-1+CTLA-4−CD8+ T cell population, when compared to the untreated group, there were some significantly increased levels of Tbet+Eomes− cells in groups treated with anti-CTLA-4/anti-PD-1 alone, DPX/CPA/Isotype antibody, or DPX/CPA with either anti-PD-1 or anti-CTLA-4 (). Furthermore, there were significantly elevated levels of Tbet+Eomes+ cells within the PD-1+CTLA-4− CD8+ T cells with DPX/CPA treated groups compared to antibody alone treated groups (). Across these phenotypes, the addition of antibody treatment to DPX/CPA treatment did not significantly alter these populations compared to DPX/CPA regimen alone. Therefore, DPX/CPA treatment generally induced a population of Tbet+Eomes−, or Tbet+Eomes+ activated CD8+ T cells, with no enhancement of an exhaustive T cell phenotype.
Within the PD-1+CTLA-4− non-proliferative CD8+ T cells, anti-PD-1 or anti-CTLA-4 significantly increased the levels of Tbet+Eomes− cells with DPX/CPA treatment, compared to DPX/CPA alone regimen (), suggesting the antibody treatment specifically causes induction of an activated non-proliferative phenotype within the tumor.
Discussion
DPX-based immunotherapy is designed to stimulate and deliver targeted T cells to tumors and requires an active and robust anti-tumor phenotype for maximal efficacy. The analysis in this preclinical study has demonstrated that DPX/CPA treatment induces a novel population of PD-1+CTLA-4− CD8+ T cells into the tumor not found in untreated tumors (). Flow analysis revealed that this treatment induced a mix of predominantly effector memory phenotype cells () that were both antigen-specific and non-antigen-specific cells as well as proliferative and non-proliferative (). A relatively high number of naïve CD8+ T cells were observed in untreated or antibody-alone treated mice compared to DPX/CPA groups (). However, these cells were insufficient to significantly impact tumor progression. Naïve T cells within tumors have been shown to differentiate into effector T cells.Citation29,Citation30 Further studies will elucidate whether DPCX/CPA regimen promotes this differentiation, adding to the explanation of the mechanism of action for the novel population of PD-1+CTLA-4− CD8+ T cell observed in the tumor following DPX/CPA regimen. CTLA-4 blockade enhanced the suppression of tumor growth induced by DPX/CPA treatment (), similar to PD-1 blockade,Citation18 despite a lack of expression on newly recruited DPX-induced T cells (). In addition, neither CTLA-4 blockade and/or PD-1 blockade significantly altered the phenotype of the tumor-infiltrating CD8+ T cells induced by DPX/CPA ( and ). Anti-CTLA-4 or combined anti-CTLA-4/anti-PD-1 blockade did not significantly alter the immune response to the C3 tumor target induced by DPX/CPA (). Combination of anti-CTLA-4 and anti-PD-1 with DPX/CPA treatment did, however, induce a non-antigen-specific response in the tumor, which may represent epitope spreading within the tumor microenvironment (). Further characterization of the novel population of CD8+PD-1+CTLA-4− revealed these cells were also predominantly proliferative, antigen-specific, and expressed both Tbet and Eomes, suggesting these cells are highly activated ().
Although CTLA-4 and PD-1 blockade have been found to be a viable option for the treatment of some cancer types,Citation10,Citation31 the success rate is limited in other cancer types.Citation10,Citation32 One of the main mechanisms thought to be the cause of non-responsiveness in patients to CTLA-4 or PD-1 blockade is that these checkpoint inhibitors exert their effects predominantly within the tumor on tumor-infiltrating cells expressing these receptors. For antibody treatment alone to be efficacious, it would require a “hot” tumor, that already has tumor-infiltrating immune cells present.Citation3,Citation33 If a patient’s tumor is “cold”, or does not have strong infiltration, then there are no immune cells within the tumor for these antibodies to bind to, leading to lack of efficacy. In addition, as shown here and by others,Citation34,Citation35 CTLA-4 and PD-1 blockade does not directly induce the recruitment of new CD8+ T cells to the tumor. In this study and previous studies,Citation18,Citation36 DPX has been shown to induce CD8+ T cell infiltration into the tumor, which expresses receptors which anti-PD-1 or anti-CTLA-4 can bind to (), making the antibody treatments more efficacious. Interestingly, our studies reveal that although CTLA-4 blockade does enhance tumor suppression (), it does not alter the antigen-specific CD8+ T cell population recruited into the tumor () or the antigen-specific systemic IFN-γ response (). In fact, although not statistically significant, a decreased IFN-γ production was observed in the group treated with DPX/CPA/anti-CTLA-4 compared to the DPX/CPA regimen group (). This response is unlikely to be attributed to the depletion of CTLA-4+ effector T cells by an action of the anti-CTLA-4 antibodies.Citation37–Citation39 Combining CTLA-4 and PD-1 blockade did enhance the overall systemic immune response to our C3 target and whole-cultured C3 cells, but it also caused an enhanced “off-target” immune response, as shown by enhanced IFN-γ production when stimulated with either irrelevant peptide or whole-cultured Panc02 cells (Supplementary Figure 5). Blocking both these checkpoint markers is essentially “removing the brakes” on immune cells, therefore leading to hyperactivated cells,Citation40,Citation41 which results in both a antigen-specific and non-antigen response. These responses could lead to a synergistic effect on anti-tumor efficacy and provide additional benefits in clinic.
Our previous study showed that PD-1 blockade increased the clonality of antigen-specific CD8+ T cells induced by DPX and CPA within the tumor microenvironment, but did not contain an in-depth analysis of the phenotype of these cells.Citation18 In this current study, we show that both DPX/CPA/anti-PD-1 and DPX/CPA/anti-CTLA-4 caused enhanced infiltrate of non-R9F specific responses that DPX/CPA does not induce alone (). This study complements the data from our previous study, and suggests that CTLA-4 blockade may have a similar impact on survival and tumor volume as that of PD-1 blockade, albeit likely through a different mechanism, due to the differential expression of this molecule by the T cells induced by treatment. Another studyCitation42 suggests the survival of subdominant CD8+ T cell clones is usually negatively affected by immunodominant clones; however, PD-1 blockade inhibits this effect thus enhancing survival and population size. In another study,Citation43 CTLA-4 knockout mice had increased T cell clonality in the lymph node, while Karandikar et al.Citation44 showed that CTLA-4 blockade during the acute phase of experimental autoimmune encephalomyelitis leads to enhanced epitope spreading. Both of these studies suggest that the T cell clonality mechanism was due to CTLA-4 being a natural inhibitor of self-reactive or subdominant clones and that blocking CTLA-4 lowers the threshold for activation of both clonotypes. Therefore, although the end result of both blockades may lead to an enhanced non-antigen specific response, the mechanism by which this occurs is different. Furthermore, blockade may be acting on two different CD8 phenotypes within the tumor. As there is no overall increase in CD8+ T cells into the tumor when antibody treatment is combined with DPX/CPA (), these antibodies must be acting on either the resident phenotype T cells or T cells recruited upon DPX/CPA treatment. Similar to Duraiswamy et al.,Citation40 PD-1 blockade may be acting on one or both of these populations, although as PD-1 blockade works when administered 6 days post-DPX treatment,Citation18 it suggests it is primarily working on the newly recruited cells. Anti-CTLA-4 has to be targeting the resident phenotype CTLA-4+ cells present prior to treatment,Citation40 or the cells with the same phenotype that were induced by DPX/CPA (). Whether this is by recruitment or induction of proliferation is uncertain, although we do see an increase in proliferating PD-1+CTLA-4+ CD8+ T cells with DPX/CPA treatment (). Anti-CTLA-4 treatment works best at suppressing tumor growth when administered on the same day as DPX treatment, as previously demonstrated,Citation45 suggesting it is working on resident cells within the tumor, yet anti-CTLA-4 treatment is still able to enhance an anti-tumor response induced by DPX/CPA treatment.
The increase in non-antigen-specific proliferating cells with antibody treatment suggests that the mechanisms by which PD-1 or CTLA-4 blockade enhances DPX/CPA treatment are by improving proliferation and IFN-γ production of non-antigen-specific CD8+ T cells, essentially facilitating epitope spreading within the tumor. There was no enhanced IFN-γ production in response to C3 cells in the ELISPOT assay, but this could be attributed to some suppression occurring in the assay, as C3 cells in culture can express PD-L1.Citation18 As this non-antigen-specific CD8+ T cell population is smaller than the antigen-specific population induced by DPX/CPA (), when assessed by traditional flow cytometry, it appears as if there is no change in overall CD8+ T cell infiltration; this population, however, is sufficient to have an impact on tumor suppression. Given that tumor suppression does not occur when mice are treated with antibody alone (), it appears that although CTLA-4 blockade may be able to prime the tumor microenvironment by acting on existing CTLA-4+ T cells, an immune-activated environment, such as the one induced by DPX/CPA, is required to initiate a robust tumor-specific immune. Supporting this theory, anti-CTLA-4 is most effective when delivered concomitantly with DPX/CPA (), and yet CTLA-4 is not expressed on DPX/CPA-induced recruited CD8+ T cells (), suggesting the antibody acts on cells already present within the tumor. Combination therapy with anti-PD-1 may work in a similar fashion by DPX/CPA treatment first inducing an immune-activated environment, prompting a response in both antigen-specific and nonspecific cells, and then anti-PD-1 treatment enhancing that response. In summary, DPX/CPA “fuels” an immune-activating response by induction of an antigen-specific response inside the tumor which induces a non-antigen-specific CD8+ T cell response, that can be enhanced by the addition of checkpoint blockade.
This study reveals the heterogenous nature of the CD8+ T cells inside the tumor microenvironment, highlighting that bulk analysis of total CD8+ may not give an accurate representation of the functional immune response in the tumor microenvironment. We explored the distinct phenotype induced by immunotherapy and delved into the impacts on these effector cells throughout combination treatment. Our data also demonstrate the additional information that can be gleaned when cells are analyzed as a whole within their environment ( and ), rather than exploring them with individual markers (). Standard analysis of the tumor-infiltrating population by flow cytometry revealed what appeared to be a decrease in CTLA-4+ cells with DPX/CPA treatment (). However, looking at the CD8+ T cell population as individual cells and individual phenotypes via tSNE analysis revealed that the CTLA-4 expression does not actually decrease with DPX/CPA treatment, and instead a new population of CTLA-4− cells is being brought into the tumor, and resident CTLA-4+ T cells are also increasing ( and C), just not to the same magnitude as those induced by DPX/CPA treatment (). tSNE analysis also revealed that this induced population is not present within untreated tumors and DPX/CPA causes this novel cell population to infiltrate the tumor to a high magnitude and is likely key to DPX/CPA’s efficacy in controlling tumor progression. This further supports data about the mechanism by which DPX treatment causes tumor suppression, through induction of a novel population of CD8+ T cells into the tumor that has a different phenotype than the resident CD8+ T cells that are present without treatment.
The dual populations of PD-1+CTLA-4+/- cells have been described in other tumor models,Citation40 but to our knowledge, this is the first time that we see a treatment that induces a specific population of T cells into the tumor. PD-1+CTLA-4− cells are proliferative () and express IFN-γ and granzyme B ( and c). In contrast, PD-1+CTLA-4+ cells are described as a phenotype of severely exhausted cells, and within the tumor, antigen-specific,Citation40 which may be the case in the resident phenotype CD8+ population in untreated mice (whether that antigen is the antigen delivered by DPX, or another tumor-associated antigen). These cells are capable of being reactivated when both PD-1 and CTLA-4 receptors are blocked by nivolumab or ipilimumab,Citation46 and increase in number with anti-PD-1 or anti-CTLA-4 treatment.Citation47 In our study, the increase in Ki67+ cells in DPX/CPA treated groups () suggests that DPX/CPA treatment may be overcoming exhaustion and cause reactivation of those cells that can then actively target the tumor to induce tumor suppression. This proposed mechanism is likely due to the unique way in which DPX activates T cells. The oil-based formulation exposes the immune system to the immune-activating components over an extended period of time and forces active update by antigenpresenting cells. The draining lymph nodes are then also prolongingly exposed to target antigens and likely result in feeding the tumors with newly activated T cells in a continuous manner.Citation4,Citation48
Although it is known that the mechanism by which DPX induces tumor regression is by induction of an antigen-specific PD-1+ CD8+ T cell infiltrate into the tumor,Citation18 this study adds to the theory by demonstrating that a new population of highly activated CD8+ T cells, not present in untreated tumors, is being recruited, which advances our knowledge of the phenotype of these tumor infiltrating CD8+ T cells. Tbet+Eomes− T cells are considered effector or effector memory T cells,Citation25–Citation27 while TbetloEomes+ T cells are considered memory or exhausted,Citation25,Citation26,Citation28 which is a typical state of T cells found within the tumor microenvironment without treatment.Citation47 Tbet+Eomes+ T cells are not greatly described and there is little consensus on the phenotype; this population has been described as an effector cell type,Citation28 a terminally differentiated cell type,Citation43 and an exhausted phenotype.Citation47 These newly recruited CD8+ T cells are proliferating, as identified by the presence of Ki67+ stain (), and we are also seeing suppressed tumor growth (), all suggesting that these cells are active and responding within the tumor. Wei et al.Citation47 categorize PD-1+Tbet+Eomes+ as terminally differentiated exhausted cells but highly proliferative, which increases in number with anti-PD-1 or anti-CTLA-4 treatment and also correlated with a decrease in tumor growth. In our study, DPX caused a large infiltrate of these cells into the tumor, therefore, further demonstrating that DPX induces an important anti-tumorigenic CD8+ T cell population into the tumor, in this case greater than what was induced by just antibody treatment alone or even antibody in combination with GVAX in the previously described study.Citation47 Furthermore, exhausted cells are thought to be a main target for anti-PD-1 treatment, and in patients, expansion of exhausted cells has been shown to correlate with clinical benefit when treated with anti-PD-1 treatment.Citation28 This supports how anti-PD-1 and anti-CTLA-4 have an additive effect when combined with DPX/CPA treatment. Due to the high level of response in the tumor, we propose that this is a phenotype of a highly activated, potentially reinvigorated T cell population. Other markers would have to be analyzed to further characterize these cells in the future, such as other exhaustion markers like the newly discovered TOX transcription factor,Citation49 and to extend this data to the phenotype of samples collected in clinical trials with DPX-Survivac.
In summary, we have shown that DPX/CPA single regimen induces the recruitment of a novel population of CD8+ T cells that is phenotypically distinct from resident phenotype CD8+ T cells found within the tumor without treatment. The phenotype of this recruited population appears to be antigen-specific, proliferative, and highly activated PD-1+CTLA-4− cells. We have also demonstrated that blockade of CTLA-4 enhances DPX/CPA-dependent tumor suppression, and, similarly to PD-1 blockade, is due to enhancing a non-antigen-specific response. There is potential that in clinical settings, similar populations of CD8+ T cells are being recruited to the tumor, and that additional checkpoint blockade with candidates such as ipilimumab can combine well with DPX-Survivac treatment to enhance treatment.
Materials & Methods
Experimental Animals
All animal studies are preapproved by the Dalhousie University Committee on Laboratory Animals, which complies with the Canadian Council on Animal Care (CCAC) Guidelines and Policies.
Pathogen-free, female C57BL/6 mice were obtained from Charles River Labs (St. Constant, QC, Canada) at 6 weeks of age. Mice were group-housed in individually ventilated cages within a barrier facility; food and water were supplied ad libitum and environmental enrichment was provided (house and nesting materials). Mice were acclimatized for at least 7 d, at which point they were enrolled in studies at approximately 7 weeks of age and 15 to 25 g body weight. Detailed clinical examinations were performed at least once per week for the duration of each study to monitor health status. Five to eight mice were assigned to each study groups prior to initiating treatment. Studies were performed one to three times.
Peptides and DPX Formulation and Delivery
All peptides were synthesized by NeoMPS (San Diego, CA, USA) at >90% purity. The H2-Db peptide epitope HPV16 E749-57 (RAHYNIVTF; R9F) was used in each study. All vaccines contained a universal T helper peptide PADRE (AKXVAAWTLKAA).
Peptides were formulated in DPX with a proprietary adjuvant as previously described.Citation50 Briefly, peptides and adjuvant were solubilized in appropriate buffer and mixed with 10:1 (w:w) DOPC/cholesterol mixture (Lipoid GmBH, Germany) to form liposomes. The aqueous mixture was lyophilized to a dry cake which was reconstituted with Montanide ISA51 VG (SEPPIC, France) just prior to injection.
Mice were injected subcutaneously on the right flank with 50 µL of DPX. Each dose of DPX contained 10 µg R9F fused to PADRE and 20 µg adjuvant. When multiple treatments were administered, they were given in the same area but avoiding previous sites of injection.
Intermittent Low Dose Cyclophosphamide
Cyclophosphamide (Sigma-Aldrich, Oakville, Ontario) was reconstituted and provided for seven consecutive days in drinking water (PO) at 0.133 mg/mL, calculated to deliver 20 mg/kg/day, based on 3 mL water/mouse/day. Water was changed every 3–4 days. Mice that were treated with cyclophosphamide were monitored for signs of ill health indicating adverse reactions to treatment.
Monoclonal Antibodies
Monoclonal antibodies for in vivo administration were purchased from BioXCell (West Lebanon, NH, USA). Anti-CTLA-4 (clone 9D9, mouse IgG2b, 100 µg) or isotype control (clone MPC-11, mouse IgG2b, 100 μg), anti-PD-1 (clone RMP1-14, rat IgG2a, 200 μg) or isotype control (clone 2A3, rat IgG2a, 200 μg), or anti-TIM-3 (clone RMT3-23, 250 µg) or isotype control (clone 2A3, 250 μg) was administered by intraperitoneal injection on days indicated in figure legends.
C3 in vivo tumor studies
The C3 cell line, provided by Dr. Martin Kast (USC, Los Angeles, USA), is derived from C57BL/6 mouse embryo cells transfected to express genes from HPV16.Citation17 The C3 tumor line was maintained in IMDM (Gibco, ThermoFisher, Waltham, MA USA) supplemented with 10% cosmic calf serum (CCS; HyClone, ThermoFisher), 2% penicillin-streptomycin (Gibco), 50 mM β-mercaptoethanol (Gibco) and 2 mM L-glutamine (Gibco).
Mice were implanted with 3 × 10⁵ C3 tumor cell subcutaneously in the left flank (study day 0). Tumor growth was measured with digital calipers twice weekly and tumor volume calculated using the formula (widthCitation2 x length)/2. For experiments requiring determinations of survival, endpoint was determined to be when mice had tumor volumes of ≥2000 mm3, showed significant signs of ill health, or when necrotic lesions were observed on tumor.
When endpoint was determined, mice were humanely euthanized per CCAC guidelines. For flow cytometry and ELISPOT assays, animals were euthanized at pre-determined timepoints and the right (treatment draining) inguinal lymph node, spleen, and tumors were collected from mice upon termination.
Mice were treated with either of the following regiments following implantation: For tumor analysis studies, mice received CPA for a week starting on day 14, DPX-FP was administered on day 21 (in some analysis, anti-CTLA-4 antibodies administered on day 21 and anti-PD-1 antibodies on day 27) and ten days later (day 31), mice were terminated. For challenge studies, CPA was administered for 1 week starting on days 8 and 22, DPX-FP was administered on days 15 and 29, and antibodies or corresponding isotype controls were added in a period ranging from days 15 to 35.
Tumor Dissociation
Tumors were cut into small pieces with a scalpel and transferred into a 15 mL tube containing 5–10 mL of digestion buffer [1 mg/mL collagenase type 1 (Gibco) + 0.1 mg/mL DNase I (Sigma Aldrich) in RPMI 1640 (Gibco)] and incubated in a shaker at 37°C for 30 minutes. Suspensions were then strained through 40 µm filters. Cells were washed in PBS and used for flow cytometry.
Immunofluorescence Staining and Flow Cytometry Analysis
Cells were pre-incubated with normal rat serum to block nonspecific staining, with or without R9F-dextramer-PE (Immudex, Copenhagen, Denmark). Antibody cocktails were added, and cells incubated at 4°C for 30 minutes. For intracellular staining, the FoxP3/Transcription Factor Staining Buffer Set (eBioscience, San Diego, CA, US) was used as per manufacturer’s instructions. The following fluorochrome conjugated anti-mouse antibodies were used: NK1.1 (PK136), CD11c (N418), CD3e (145–2C11), Tim-3 (RMT3-23), CTLA-4 (UC10-4F10-11), Lag-3 [eBioC9B7 W (C9B7 W)], F4/80 (BM8), CD24 (30-F1 and M1/69), VISTA (MIH64), GITR (DTA-1), CD27 (LG 3A10), TCRβ (H57-597), CD40 (3/23), CD137 (1AH2), ICOS (C398.4A), OX40 (OX-86), CD68 (FA-11), CD45 (30-F11), CD19 (eBio1D3), CD8a (53–6.7), CD4 (GK1.5), PD-1 (RMP1-30 and J43), CD11b (M1/70), PD-L1 (MIH5), Ki-67 (SolA16), granzyme B (NGZB), Eomes (Dan11mag), Tbet (04–46), IFN-γ (GR20), TNF (MP6-XT22), CD44 (IM7), CD62L (MEL-14), FoxP3 (MF23), CD25 (PC61), IL-10 (JES5-16E3) – all purchased from BD Biosciences (Franklin Lakes, NJ, US) and Invitrogen (Carlsbad, CA, US). A BD LSRFortessa™ or BD FACSCelesta™ (BD Bioscience) was used for the acquisition of flow cytometry data and analysis (including tSNE analysis) was performed using FlowJo v10 (FlowJo, LLC, Ashland, USA). All flow analysis of tumor-infiltrating cells gates on CD45+ cells first, and then gates on the subpopulations of interest. Gates were set by the use of fluorescence minus one (FMO) controls to take in account autofluorescence as well as the spread of fluorescence from antibodies besides the specific antibody of interest.Citation51–Citation54
IFN-γ ELISPOT
IFN-γ ELISPOT was performed as described previously.Citation5 Briefly, mature dendritic cells (DCs) were generated by culturing bone marrow cells from naïve C57BL/6 mice in complete RPMI media [RPMI 1640 (Gibco) + 10% CCS, 2% penicillin/streptomycin (Gibco), 2 mM L-glutamine (Gibco), 50 mM β-mercaptoethanol (Sigma Aldrich), and 5 mM HEPES buffer (Gibco)] supplemented with murine GM-CSF (Peprotech, Rocky Hill, NJ, US). DCs were loaded with 20 µg/mL peptides (either R9F or irrelevant H2-Db peptide epitope WT-1126-134 [RMFPNAPYL peptide, R9L]) on day 7. Day 8 DCs were resuspended in complete RPMI at 3 × 10⁵ cells/mL and were used as antigen presenting cells for ELISPOT of lymph node cells.
Single-cell suspensions of the right (DPX draining) inguinal lymph nodes were prepared in complete RPMI media and cell concentration adjusted to 2 × 10⁶ cells/mL. Lymph node cells (100 µL) and DCs (100 µL) or 2 × 10⁵ cells/mL C3 cells or Panc02 cells (provided by Merck KGaA Darmstadt) (100 µL) were added to ELISPOT plates coated with purified anti-IFN-γ capture antibody (BD Bioscience). The ELISPOT plate was incubated overnight at 37°C, 5% CO2 and then developed the next day using AEC kit (Sigma Aldrich). Spots were counted using a CTL ImmunoSpot® S6 Core Analyzer (C.T.L. Ltd, Shaker Heights, OH, USA) and enumerated as number of spot-forming units (SFU) per well.
IFN-γ ELISPOT performed using splenocytes had the following modifications. Single-cell suspensions of splenocytes were prepared by lysing RBCs with ammonium-chloride-potassium solution and resuspending cells at 5 × 10⁶ cells/mL in complete RPMI media. A volume of 100 µL cells was added into anti-IFN-γ coated ELISPOT plate and stimulated with 100 µL complete RPMI containing: 20 µg/mL R9F or irrelevant peptide R9L, 100 µL C3 cells or Panc02 cells, or no peptide (background control).
Data analysis and statistical methods
Data were compiled and analyzed using GraphPad Prism 7 (La Jolla, CA, USA) software. Statistical analysis was performed by appropriate tests as described in the figure legends. Significance is noted as *p<0.05, **p<0.01, ***p<0.001, ****p<0.0001.
Author contributions
AVL contributed to study design, analysis and all stages of manuscript preparation. AM, LPC, GMW and AMJ contributed to study design and analysis. MMS oversaw all study design and analysis as well as manuscript preparation. All authors participated in manuscript revision and finalization.
Competing interests
All authors on this manuscript were employees at IMV Inc. while studies were conducted. All funding for completed studies was supplied by IMV Inc.
Data availability
The data that support the findings of this study are available from the corresponding author upon reasonable request.
Supplemental Material
Download ()Acknowledgments
The C3 model was developed with funding from the NIH (grant 2R01CA074397-16A1) and kindly provided by Dr. W. Martin Kast.
Supplementary material
Supplemental data for this article can be accessed on the publisher’s website.
References
- Hanahan D, Weinberg RA. Hallmarks of cancer: the next generation. Cell. 2011;144(5):646–19. doi:10.1016/j.cell.2011.02.013.
- Yu C, Liu X, Yang J, Zhang M, Jin H, Ma X, Shi H. Combination of Immunotherapy With Targeted Therapy: theory and Practice in Metastatic Melanoma. Front Immunol. 2019;10:990. doi:10.3389/fimmu.2019.00990.
- Gajewski TF, Corrales L, Williams J, Horton B, Sivan A, Spranger S. Cancer Immunotherapy Targets Based on Understanding the T Cell-Inflamed Versus Non-T Cell-Inflamed Tumor Microenvironment. Adv Exp Med Biol. 2017;1036:19–31. doi:10.1007/978-3-319-67577-0_2.
- Brewer KD, Lake K, Pelot N, Stanford MM, DeBay DR, Penwell A, Weir GM, Karkada M, Mansour M, Bowen CV. Clearance of depot vaccine SPIO-labeled antigen and substrate visualized using MRI. Vaccine. 2014;32(51):6956–6962. doi:10.1016/j.vaccine.2014.10.058.
- Weir GM, Hrytsenko O, Stanford MM, Berinstein NL, Karkada M, Liwski RS, Mansour M. Metronomic cyclophosphamide enhances HPV16E7 peptide vaccine induced antigen-specific and cytotoxic T-cell mediated antitumor immune response. Oncoimmunology. 2014;3(8):e953407. doi:10.4161/21624011.2014.953407.
- Berinstein NL, Karkada M, Oza AM, Odunsi K, Villella JA, Nemunaitis JJ, Morse MA, Pejovic T, Bentley J, Buyse M, et al. Survivin-targeted immunotherapy drives robust polyfunctional T cell generation and differentiation in advanced ovarian cancer patients. Oncoimmunology. 2015;4(8):e1026529. doi:10.1080/2162402X.2015.1026529.
- Morrot A, da Fonseca LM, Salustiano EJ, Gentile LB, Conde L, Filardy AA, Franklim TN, da Costa KM, Freire-de-Lima CG, Metabolic Symbiosis F-D-L-L. and Immunomodulation: how Tumor Cell-Derived Lactate May Disturb Innate and Adaptive Immune Responses. Front Oncol. 2018;8:81. doi:10.3389/fonc.2018.00081.
- Yano H, Andrews LP, Workman CJ, Vignali DAA. Intratumoral regulatory T cells: markers, subsets and their impact on anti-tumor immunity. Immunology. 2019;157(3):232–247. doi:10.1111/imm.13067.
- Gabrilovich DI, Ostrand-Rosenberg S, Bronte V. Coordinated regulation of myeloid cells by tumours. Nat Rev Immunol. 2012;12(4):253–268. doi:10.1038/nri3175.
- Topalian SL, Hodi FS, Brahmer JR, Gettinger SN, Smith DC, McDermott DF, Powderly JD, Carvajal RD, Sosman JA, Atkins MB, et al. Safety, activity, and immune correlates of anti-PD-1 antibody in cancer. N Engl J Med. 2012;366(26):2443–2454. doi:10.1056/NEJMoa1200690.
- Brahmer JR, Tykodi SS, Chow LQ, Hwu WJ, Topalian SL, Hwu P, Drake CG, Camacho LH, Kauh J, Odunsi K, et al. Safety and activity of anti-PD-L1 antibody in patients with advanced cancer. N Engl J Med. 2012;366(26):2455–2465. doi:10.1056/NEJMoa1200694.
- Leach DR, Krummel MF, Allison JP. Enhancement of antitumor immunity by CTLA-4 blockade. Science (80-). 1996;271(5256):1734–1736. doi:10.1126/science.271.5256.1734.
- Patel SP, Kurzrock R. PD-L1 Expression as a Predictive Biomarker in Cancer Immunotherapy. Mol Cancer Ther. 2015;14(4):847–856. doi:10.1158/1535-7163.MCT-14-0983.
- Freeman GJ, Long AJ, Iwai Y, Bourque K, Chernova T, Nishimura H, Fitz LJ, Malenkovich N, Okazaki T, Byrne MC, et al. Engagement of the PD-1 immunoinhibitory receptor by a novel B7 family member leads to negative regulation of lymphocyte activation. J Exp Med. 2000;192(7):1027–1034. doi:10.1084/jem.192.7.1027.
- Iwai Y, Ishida M, Tanaka Y, Okazaki T, Honjo T, Minato N. Involvement of PD-L1 on tumor cells in the escape from host immune system and tumor immunotherapy by PD-L1 blockade. Proc Natl Acad Sci U S A. 2002;99(19):12293–12297. doi:10.1073/pnas.192461099.
- Wong RM, Scotland RR, Lau RL, Wang C, Korman AJ, Kast WM, Weber JS. Programmed death-1 blockade enhances expansion and functional capacity of human melanoma antigen-specific CTLs. Int Immunol. 2007;19(10):1223–1234. doi:10.1093/intimm/dxm091.
- Feltkamp MC, Smits HL, Vierboom MP, Minnaar RP, de Jongh BM, Drijfhout JW, Ter Schegget J, Melief CJ, Kast WM. Vaccination with cytotoxic T lymphocyte epitope-containing peptide protects against a tumor induced by human papillomavirus type 16-transformed cells. Eur J Immunol. 1993;23(9):2242–2249. doi:10.1002/eji.1830230929.
- Weir GM, Hrytsenko O, Quinton T, Berinstein NL, Stanford MM, Mansour M. Anti-PD-1 increases the clonality and activity of tumor infiltrating antigen specific T cells induced by a potent immune therapy consisting of vaccine and metronomic cyclophosphamide. J Immunother Cancer. 2016;4:68. doi:10.1186/s40425-016-0169-2.
- Syn NL, Teng MWL, Mok TSK, Soo RA. De-novo and acquired resistance to immune checkpoint targeting. Lancet Oncol. 2017;18(12):e731–e741. doi:10.1016/S1470-2045(17)30607-1.
- He Y, Cao J, Zhao C, Li X, Zhou C, Hirsch FR. TIM-3, a promising target for cancer immunotherapy. Onco Targets Ther. 2018;11:7005–7009. doi:10.2147/OTT.S170385.
- Ascierto PA, Melero I, Bhatia S, Bono P, Sanborn RE, Lipson EJ, Callahan MK, Gajewski T, Gomez-Roca CA, Hodi FS, et al. Initial efficacy of anti-lymphocyte activation gene-3 (anti–LAG-3; BMS-986016) in combination with nivolumab (nivo) in pts with melanoma (MEL) previously treated with anti–PD-1/PD-L1 therapy. J Clin Oncol. 2017;35(15_suppl):9520. doi:10.1200/JCO.2017.35.15_suppl.9520.
- Kovacsovics-Bankowski M, Chisholm L, Vercellini J, Crittenden M, Lary S, Curti B, Weinberg A. Phase I/II clinical trial of anti-OX40, radiation and cyclophosphamide in patients with prostate cancer: immunological analysis. J Immunother Cancer. 2013;1(Suppl 1):P255–P255. doi:10.1186/2051-1426-1-S1-P255.
- Tran B, Carvajal RD, Marabelle A, Patel SP, LoRusso PM, Rasmussen E, Juan G, Upreti VV, Beers C, Ngarmchamnanrith G, et al. Dose escalation results from a first-in-human, phase 1 study of glucocorticoid-induced TNF receptor–related protein agonist AMG 228 in patients with advanced solid tumors. J Immunother Cancer. 2018;6(1):93. doi:10.1186/s40425-018-0407-x.
- Lin L, Frelinger J, Jiang W, Finak G, Seshadri C, Bart PA, Pantaleo G, McElrath J, DeRosa S, Gottardo R. Identification and visualization of multidimensional antigen-specific T-cell populations in polychromatic cytometry data. Cytom A. 2015;87(7):675–682. doi:10.1002/cyto.a.22623.
- Buggert M, Tauriainen J, Yamamoto T, Frederiksen J, Ivarsson MA, Michaelsson J, Lund O, Hejdeman B, Jansson M, Sonnerborg A, et al. T-bet and Eomes are differentially linked to the exhausted phenotype of CD8+ T cells in HIV infection. PLoS Pathog. 2014;10(7):e1004251. doi:10.1371/journal.ppat.1004251.
- Li G, Yang Q, Zhu Y, Wang HR, Chen X, Zhang X. Lu B. T-Bet and Eomes Regulate the Balance between the Effector/Central Memory T Cells versus Memory Stem Like T Cells. PLoS One. 2013;8(6):e67401. doi:10.1371/journal.pone.0067401.
- Intlekofer AM, Takemoto N, Kao C, Banerjee A, Schambach F, Northrop JK, Shen H, Wherry EJ, Reiner SL. Requirement for T-bet in the aberrant differentiation of unhelped memory CD8+ T cells. J Exp Med. 2007;204(9):2015–2021. doi:10.1084/jem.20070841.
- Huang AC, Postow MA, Orlowski RJ, Mick R, Bengsch B, Manne S, Xu W, Harmon S, Giles JR, Wenz B, et al. T-cell invigoration to tumour burden ratio associated with anti-PD-1 response. Nature. 2017;545(7652):60–65. doi:10.1038/nature22079.
- Thompson ED, Enriquez HL, Fu Y-X, Engelhard VH. Tumor masses support naive T cell infiltration, activation, and differentiation into effectors. J Exp Med. 2010;207(8):1791–1804. doi:10.1084/jem.20092454.
- Kirk CJ, Hartigan-O’Connor D, Mulé JJ. The dynamics of the T-cell antitumor response: chemokine-secreting dendritic cells can prime tumor-reactive T cells extranodally. Cancer Res. 2001;61:8794–8802.
- Hodi FS, O’Day SJ, McDermott DF, Weber RW, Sosman JA, Haanen JB, Gonzalez R, Robert C, Schadendorf D, Hassel JC, et al. Improved survival with ipilimumab in patients with metastatic melanoma. N Engl J Med. 2010;363(8):711–723. doi:10.1056/NEJMoa1003466.
- Schadendorf D, Hodi FS, Robert C, Weber JS, Margolin K, Hamid O, Patt D, Chen TT, Berman DM, Wolchok JD. Pooled Analysis of Long-Term Survival Data From Phase II and Phase III Trials of Ipilimumab in Unresectable or Metastatic Melanoma. J Clin Oncol. 2015;33(17):1889–1894. doi:10.1200/JCO.2014.56.2736.
- Ji RR, Chasalow SD, Wang L, Hamid O, Schmidt H, Cogswell J, Alaparthy S, Berman D, Jure-Kunkel M, Siemers NO, et al. An immune-active tumor microenvironment favors clinical response to ipilimumab. Cancer Immunol Immunother. 2012;61(7):1019–1031. doi:10.1007/s00262-011-1172-6.
- Tumeh PC, Harview CL, Yearley JH, Shintaku IP, Taylor EJ, Robert L, Chmielowski B, Spasic M, Henry G, Ciobanu V, et al. PD-1 blockade induces responses by inhibiting adaptive immune resistance. Nature. 2014;515(7528):568–571. doi:10.1038/nature13954.
- Spranger S, Koblish HK, Horton B, Scherle PA, Newton R, Gajewski TF. Mechanism of tumor rejection with doublets of CTLA-4, PD-1/PD-L1, or IDO blockade involves restored IL-2 production and proliferation of CD8(+) T cells directly within the tumor microenvironment. J Immunother Cancer. 2014;2:3. doi:10.1186/2051-1426-2-3.
- Karkada M, Quinton T, Blackman R, Mansour M. Tumor Inhibition by DepoVax-Based Cancer Vaccine Is Accompanied by Reduced Regulatory/Suppressor Cell Proliferation and Tumor Infiltration. ISRN Oncol. 2013;2013:753427. doi:10.1155/2013/753427.
- Du X, Tang F, Liu M, Su J, Zhang Y, Wu W, Devenport M, Lazarski CA, Zhang P, Wang X, et al. A reappraisal of CTLA-4 checkpoint blockade in cancer immunotherapy. Cell Res. 2018;28(4):416–432. doi:10.1038/s41422-018-0011-0.
- Selby MJ, Engelhardt JJ, Quigley M, Henning KA, Chen T, Srinivasan M, Korman AJ. Anti-CTLA-4 antibodies of IgG2a isotype enhance antitumor activity through reduction of intratumoral regulatory T cells. Cancer Immunol Res. 2013;1(1):32–42. doi:10.1158/2326-6066.CIR-13-0013.
- Liu Y, Zheng P. How Does an Anti-CTLA-4 Antibody Promote Cancer Immunity? Trends Immunol. 2018;39(12):953–956. doi:10.1016/j.it.2018.10.009.
- Duraiswamy J, Kaluza KM, Freeman GJ, Coukos G. Dual blockade of PD-1 and CTLA-4 combined with tumor vaccine effectively restores T-cell rejection function in tumors. Cancer Res. 2013;73(12):3591–3603. doi:10.1158/0008-5472.CAN-12-4100.
- Curran MA, Montalvo W, Yagita H, Allison JP. PD-1 and CTLA-4 combination blockade expands infiltrating T cells and reduces regulatory T and myeloid cells within B16 melanoma tumors. Proc Natl Acad Sci U S A. 2010;107(9):4275–4280. doi:10.1073/pnas.0915174107.
- Memarnejadian A, Meilleur CE, Shaler CR, Khazaie K, Bennink JR, Schell TD, Haeryfar SMM. PD-1 Blockade Promotes Epitope Spreading in Anticancer CD8(+) T Cell Responses by Preventing Fratricidal Death of Subdominant Clones To Relieve Immunodomination. J Immunol. 2017;199(9):3348–3359. doi:10.4049/jimmunol.1700643.
- Wei SC, Sharma R, Anang NAS, Levine JH, Zhao Y, Mancuso JJ, Setty M, Sharma P, Wang J, Pe’er D, et al. Negative Co-stimulation Constrains T Cell Differentiation by Imposing Boundaries on Possible Cell States. Immunity. 2019;50(4):1084–1098 e10. doi:10.1016/j.immuni.2019.03.004.
- Karandikar NJ, Eagar TN, Vanderlugt CL, Bluestone JA, Miller SD. CTLA-4 downregulates epitope spreading and mediates remission in relapsing experimental autoimmune encephalomyelitis. J Neuroimmunol. 2000;109(2):173–180. doi:10.1016/s0165-5728(00)00322-2.
- Field CS, Hunn MK, Ferguson PM, Ruedl C, Ancelet LR, Hermans IF. Blocking CTLA-4 while priming with a whole cell vaccine reshapes the oligoclonal T cell infiltrate and eradicates tumors in an orthotopic glioma model. Oncoimmunology. 2017;7(1):e1376154. doi:10.1080/2162402X.2017.1376154.
- Wolchok JD, Chiarion-Sileni V, Gonzalez R, Rutkowski P, Grob -J-J, Cowey CL, Lao CD, Wagstaff J, Schadendorf D, Ferrucci PF, et al. Overall Survival with Combined Nivolumab and Ipilimumab in Advanced Melanoma. N Engl J Med. 2017;377(14):1345–1356. doi:10.1056/NEJMoa1709684.
- Wei SC, Levine JH, Cogdill AP, Zhao Y, Anang NAS, Andrews MC, Sharma P, Wang J, Wargo JA, Pe’er D, et al. Distinct Cellular Mechanisms Underlie Anti-CTLA-4 and Anti-PD-1 Checkpoint Blockade. Cell. 2017;170(6):1120–1133 e17. doi:10.1016/j.cell.2017.07.024.
- Brewer KD, Weir GM, Dude I, Davis C, Parsons C, Penwell A, Rajagopalan R, Sammatur L, Bowen CV, Stanford MM. Unique depot formed by an oil based vaccine facilitates active antigen uptake and provides effective tumour control. J Biomed Sci. 2018;25(1):7. doi:10.1186/s12929-018-0413-9.
- Khan O, Giles JR, McDonald S, Manne S, Ngiow SF, Patel KP, Werner MT, Huang AC, Alexander KA, Wu JE, et al. TOX transcriptionally and epigenetically programs CD8+ T cell exhaustion. Nature. 2019. doi:10.1038/s41586-019-1325-x.
- Karkada M, Weir GM, Quinton T, Sammatur L, MacDonald LD, Grant A, Liwski R, Juskevicius R, Sinnathamby G, Philip R, et al. A novel breast/ovarian cancer peptide vaccine platform that promotes specific type-1 but not Treg/Tr1-type responses. J Immunother. 2010;33(3):250–261. doi:10.1097/CJI.0b013e3181c1f1e9.
- Tung JW, Parks DR, Moore WA, Herzenberg LA, Herzenberg LA. New approaches to fluorescence compensation and visualization of FACS data. Clin Immunol. 2004;110(3):277–283. doi:10.1016/j.clim.2003.11.016.
- Tung JW, Heydari K, Tirouvanziam R, Sahaf B, Parks DR, Herzenberg LA, Herzenberg LA. Modern Flow Cytometry: A Practical Approach. Clin Lab Med. 2007;27(3):453–468. doi:10.1016/j.cll.2007.05.001.
- Baumgarth N, Roederer M. A practical approach to multicolor flow cytometry for immunophenotyping. J Immunol Methods. 2000;243(1–2):77–97. doi:10.1016/S0022-1759(00)00229-5.
- Roederer M. Spectral compensation for flow cytometry: visualization artifacts, limitations, and caveats. Cytometry. 2001;45(3):194–205. doi:10.1002/1097-0320(20011101)45:3<194::AID-CYTO1163>3.0.CO;2-C.