
ABSTRACT
The American Joint Committee on Cancer (AJCC) staging system is insufficiently prognostic for gastric cancer (GC) patients and complementary factors are in urgent need. Here we aimed to develop a comprehensive model, consisting of both immune signatures and cancer signaling molecules, which was expected to accurately improve survival prediction in non-metastatic gastric cancer (GC). We first validated the prognostic value of a combination of 18 immune features and 52 cancer-signaling molecules in The Cancer Genome Atlas (TCGA) and Gene Expression Omnibus (GEO) database. Then, their expression and distribution were analyzed in consecutive 1180 GC patients using immunohistochemistry. We developed and validated a novel protein-based prognostic classifier using CDH1, an epithelial–mesenchymal transition (EMT) marker, and five immune features (CD3, CD4, CD274, GZMB, and PAX5) by Cox regression model with group LASSO penalty. We observed significant differences in the overall survival of the high- and low-prognostic risk groups (66.8% VS 27.0%, P < .001). A combination of this classifier with age and pTNM stage had better prognostic value than pTNM alone. The model was further validated in both treatment-naive patients and those treated with neoadjuvant chemotherapy. Moreover, GC patients with high-risk score exhibited a favorable prognosis to adjuvant chemotherapy. This integrated classifier could be automatically analyzed and effectively predict survival of GC patients and may provide a new clinically applicable strategy to identify patients who are more likely to benefit from adjuvant chemotherapy.
Introduction
Although the incidence of gastric cancer (GC) has declined in the recent decades, it remains the third most common cancer and the third leading cause of cancer death worldwide.Citation1 More than half of these cases occur in East Asia.Citation2 The tumor-node-metastasis (TNM) staging system and histological subtype have been adopted routinely to predict prognosis and guide treatment decision for GC.Citation3 However, the clinical outcome varies significantly among patients with the same TNM stage and similar regimens.Citation4-Citation6 Many signaling pathways and key regulators have been identified as abnormal in GC initiation and progression, some of which have also been reported to be correlated with GC outcome.Citation7-Citation10 Based on gene microarray analysis, several prognostic gene signatures have also been identified in gastric cancer.Citation2,Citation11-Citation14 However, tumor samples usually have a complex composition and tissue heterogeneity. These gene expressions (RNA)-based signatures could not accurately indicate the expression level and heterogeneity among the tumor cells and were not always consistent with the expression of proteins, which are the final executors of a biological function.
Nowadays, the “immunoscore” tool used for quantifying in situ immune cell infiltrates termed has been identified as a prognostic tool and may be highly promising as a supplement to the TNM classification of various tumors.Citation15-Citation18 An international task force has initiated prospective multicentre studies aiming to implement TNM-Immunoscore (TNM-I) in a routine clinical setting in colorectal cancer.Citation19 Several studies have reported immunescore signature showed remarkable prognostic value in GC as well.Citation16,Citation18,Citation20 Therefore, in this study, we integrated key immune signatures and GC-specific signaling proteins into a multi-protein model and aimed to substantially improve the prognostic value for GC patients. We retrospectively collected and analyzed formalin-fixed paraffin-embedded (FFPE) GC samples for 18 characteristic immunomarker proteins and 52 signaling proteins involved in cancer development in consecutive 1180 GC patients by immunohistochemistry (IHC). Using a machine learning approach, we developed an integrative classifier that significantly improved the prognostic power for GC patients. This classifier could be applicable to patients with or without neoadjuvant chemotherapy and showed predictive value to identify GC patients who would benefit from post-surgery adjuvant chemotherapy.
Results
Prognostic power of selected molecules in TCGA and GEO datasets
Before testing these proteins in patients, we performed a pre-study in public datasets. We first evaluated the prognostic power of our molecular panel including immunomarkers and cancer regulators in the TCGA GC patient cohort (n = 299) and Singapore GC patient cohort (n = 132). The upper quartile fragments per kilobase of transcript per million mapped reads (FPKM-UQ) values and the mean mRNA expression values of the 70 selected genes were used, respectively. The patients were classified into high- and low-risk groups with median fit score as the cutoff using standard Cox regression model. In the TCGA cohort, the OS gain of the high-risk group was significantly lower than that of the low-risk group (p < .001). The prognostic power was also validated in the Singapore cohort (p < .001). For each TNM stage (I, II, or III), the low-risk group also showed a significantly longer OS than the high-risk group did (p < .001), indicating the prognostic power of this comprehensive molecular panel in GC (Figure S1).
Study design and patient characteristics
After excluding 74 patients owing to loss to follow-up or missing data, a total of 1180 GC patients were enrolled. The median age at diagnosis is 60 y (range: 22–89 y) and median follow-up was 39 months (IQR 17–63). Their clinical characteristics are summarized in . All the tissue samples were identified as adenocarcinoma mostly with poor or moderate differentiation. The 1-, 3-, 5-y OS were 87.3%, 62.0%, and 52.8%, respectively.
Table 1. Clinical characteristics of patients in the training, testing, and validation sets.
The treatment-naive patients who underwent surgery before December 2010 were assigned as the first cohort to construct the prognostic classifier, including a training set (N = 593) and a testing set (n = 146); the distribution of TNM stages was not biased in the two sets. The patients who had surgery in 2011–2012 without NAC (n = 179) were tested as an internal validation set. All the patients with NAC (n = 262) were used as another validation set ().
Figure 1. Outline of the overall study flow. Assignment of gastric cancer patients into subgroups based on surgery times and treatments to construct and validate the prognostic classifier. Patients were divided into training, testing, and validation set and NAC cohort.
The integrative prognostic classifier construction
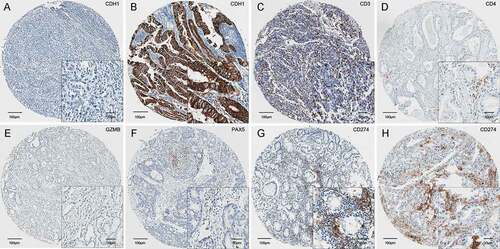
Per the datasets of patients in the training set, we applied a group Lasso model with bootstrap process (n = 100). Considering the importance of clinical risk factors such as pTNM stage and age, we combined both the molecular signatures and clinical features to construct the integrative prognostic classifier. The number of selected features (n = 8) was determined based on a trade-off between efficacy of the model and convenience of clinical practice in testing (Figure S2). Finally, six features including five immunomarkers (CD3, CD4, CD274, PAX5, and GZMB, ), an EMT protein marker (CDH1, ), and two clinical features (pTNM and age) were included.
Figure 2. Six features in the protein expression based classifier, including CDH1 (a and b), and five immunomarkers CD3 (c), CD4 (d), GZMB (e), PAX5 (f), and CD274 (g and h). CDH1 were recognized as negative or positive. The immunomarkers were quantified automatically.
To obtain a more objective evaluation of CDH1 expression, instead of the four expression levels, we categorized CDH1 as negative (0) or positiveCitation1-Citation3 in the model. An integrated model was constructed to calculate a prognosis score (online integrate classifier: https://thisbe.shinyapps.io/app-integrate_classifier). The cutoff value was estimated as 1.50 to assign a GC patient to the high-risk or low-risk group (Figure S3). The value of area under the receiver-operating characteristic (ROC) curve (AUC) of the signature on the training set was 0.708, thus exhibiting a higher prognostic value than that based on the six proteins or clinical characteristics (pTNM and age) only ()).
Figure 3. Identification and validation of the integrative prognostic gastric cancer classifier. (a) The receiver-operating characteristic (ROC) curve of the training set. Patients of the training set (b), testing set (c), internal validation set 1 (d) and neoadjuvant chemotherapy (NAC) cohort (e) were classified into high- and low-risk groups using the classifier. The Kaplan-Meier estimates of overall survival for the two groups are shown. (f) The prognosis score distribution, prognosis prediction using the classifier, the overall survival status, and the expression profile of the molecular features of all the 1180 patients involved in the study.
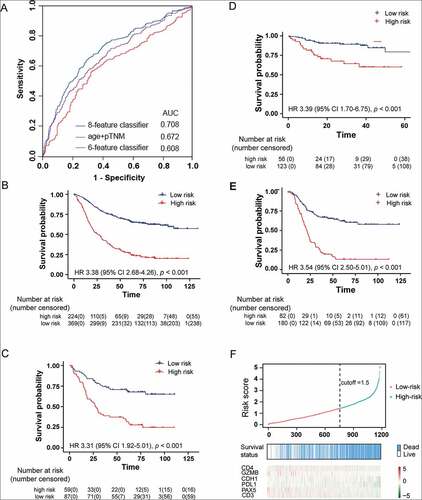
In the training subgroup, 224 (37.77%) and 369 (62.23%) GC patients were stratified into the high-risk and low-risk group, respectively (), Table S6). The 5-year OS was 66.8% (95%CI 61.6–71.6%) in the low-risk group, compared with 27.0% (95%CI 21.6–33.7%) in the high-risk group (HR 3.38 [95%CI 2.68–4.26], p < .001). We validated the stratification analysis in 146 GC patients of the testing subgroup (), Table S6). The OS gain of the low-risk patients (n = 87) was significantly longer than that of the high-risk patients (n = 59, HR 3.31 [95%CI 1.92–5.01, p < .001]), with 5-year OS of 70.7% (95%CI 61.7–81.1%) versus 31.7% (95%CI 21.7–46.3%). Further, univariate and multivariate Cox regression analysis also indicated that the classifier is a better prognostic predictor of OS (p < .001, ).
Table 2. Cox regression analysis of overall survival in the training and testing sets.
Validity of the classifier in validation set
To further confirm the performance of the classifier, we applied it to two internal validation sets of GC patients. The eight-feature integrative prognostic classifier stratified 56 patients (31.28%) into the high-risk group with 3-year OS of 64.3% (95%CI 51.6–80.2%), and 113 patients (68.72%) into the low-risk group with a significantly higher 3-year OS (89.3% [95%CI 83.6–95.3%]; p < .001; ), Table S7). The univariate and multivariate HR values between the two groups are 3.39 [95%CI 1.70–6.75] and 2.32 [95%CI 1.03–5.24], respectively (Table S8).
The classifier in NAC cohort
We also applied the classifier to the subgroups of GC patients with NAC and found that the integrative classifier could predict prognosis. The classifier stratified 82 patients (31.30%) into the high-risk group with 3-year OS of 23.6% (95%CI 15.9–34.9%), and 180 patients (68.7%) into the low-risk group with a significantly higher 3-year OS (67.5% [95%CI 60.8–75.0%]; p < .001; ), Table S9). The prognosis score distribution, the survival status, and the expression profile of the six signature proteins for all the 1180 patients are presented in ). The individual score distribution (top panel) and survival status (middle panel) indicate that the classifier accurately predicted the OS of patients.
Prognostic value of the classifier for different TNM stages
We further investigated whether our classifier could predict the outcomes of the GC patients in each TNM stage (stage I, II, or III). Owing to a limited sample size in each subgroup, we combined the treatment-naive patients in the training, testing, and validation sets together. The classifier divided all patients within stage I into low-risk groups and could clearly divide the patients into poor- and good-prognosis groups within stages II and III (Figure S5), indicating that our classifier had a better prognostic value than the TNM stage alone.
The classifier and adjuvant chemotherapy
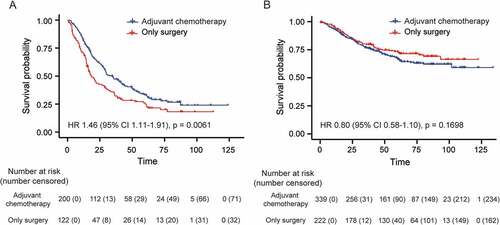
Adjuvant chemotherapy (AC) is recommended for routine use in stage II and III GC patients. However, a considerable number of patients do not benefit in terms of OS. To test whether our classifier could be helpful in selecting patients who would benefit from AC, we performed an exploratory analysis of its predictive value in GC outcome. The characteristics of patients treated with (n = 539) and without (n = 344) postoperative AC are shown in Table S9. In the high-risk group, patients with AC (n = 200) gained a significantly longer OS (33.3% [95%CI 26.8–41.3%]) than those without AC did (n = 122, OS 24.9% [95%CI 17.9–34.7%], p = .006, )). In the low-risk group, the 5-year OS in patients with (n = 339) or without AC (n = 222) was not significantly different (66.6% [95%CI 61.2–72.4%] vs. 73.5% [95%CI 67.6–79.9%], p = .170, )). These results indicate that the integrative classifier could successfully identify the candidates suitable for AC in the high-risk group among non-metastatic GC patients.
Figure 4. Survival curve based on the classifier for patients treated with adjuvant chemotherapy in the high-risk (a) and low-risk (b) groups.
Discussion
Multiple-advanced molecular techniques have been used for molecular subtyping of GC; however, these techniques are not cost-effective.Citation21-Citation23 IHC is currently the most practical method of estimating the expression status of a diagnostic and prognostic protein, showing both the intensity and the visible location of protein expression in tumor or stroma cells. For breast cancer, the combination of three protein markers (ER, PR, and HER2) has been successfully utilized for molecular subtyping and clinical decision-making.Citation24 Nowadays, recommendations for the evaluation of TILs have also been proposed considering its prognostic significance in multiple cancers.Citation15 Here, we identified a novel integrated prognostic classifier consisting of an epithelial–mesenchymal transition (EMT) marker CDH1 and five immunomarkers (CD274, CD3, CD4, GZMB, and PAX5), which could be performed by IHC and analyzed automatically thus being more practical in future. Together with pTNM stage and age, its value was validated in both treatment-naive and NAC-treated non-metastatic GC patients. Furthermore, it may enable oncologists to identify the potential GC candidates who would benefit from AC. There are no existing guidelines on TILs assessment in clinical or translational research. Based on the International TILs Working Group, TILs’ assessment requires only H&E staining slide and reported as an overall percentage of the stromal area within the borders of the invasive tumor that is covered by mononuclear immune cells. This semiquantitative method could not distinguish the different types of immune cells and takes much work from pathologists.Citation25 Although there are no established thresholds for TILs assessment, it is recommended that TILs be analyzed as a continuous variable. Here, the score of the immune marker was calculated as continuous variables via digital image analysis, which might be useful for standardization in the future. Despite we used tissue array to estimate TILs rather than the whole slide, percentage immunoreactivity (positive cells/(positive cells + negative cells) *100) from all three available cores from different regions per case was averaged taking heterogeneity into account. Immunohistochemistry (IHC) and multiplexed immunofluorescence-based TILs staining and digital assessment were utilized in other solid tumors.Citation26,Citation27 But there are still some issues remained, such as the relative importance of stromal TILs and intra-tumoral TILs or the delineation of the central tumor and invasive margin. Standardized methodology and scoring systems are critical to the integration of information about TILs into future research.
Using a signature of multiple proteins will likely overcome the limitation of using single proteins as prognostic predictors because multiple protein signatures may reflect the heterogeneity of tumorigenesis. Loss of CDH1 may indicate EMT and malignant transformation and contributes to the high-risk group of the classifier. It has also been reported as a susceptible gene in hereditary diffuse GC.Citation28-Citation32 The other validated immune classifier genes were CD3, CD4, CD274, GZMB, and PAX5. Tumor-infiltrating immune cells have diverse effects on tumor progression depending on the cancer type.Citation15 Not only does the quantity of lymphocytic infiltration but also the phenotype of the immune cells determine clinical outcome. Interestingly, the most consistent positive prognostic impact has been reported for T-cells, especially cytotoxic T-cells.Citation15,Citation18,Citation25 The five markers selected in this study were related to T-cell development. While CD3 is a pan T cell marker, CD4 functions primarily as a coreceptor for MHC class II molecule-peptide complex, which recruits the Src kinase LCK to the vicinity of the TCR-CD3 complex. On one hand, CD4 + T-helper 1 (Th1) cells facilitate antigen presentation through cytokine secretion and activation of antigen-presenting cells. On the other hand, type 2 CD4 + T-helper cells (Th2), including Forkhead box P3 (FOXP3) CD4+ regulatory T-cells (Treg cells), inhibit cytotoxic T cells function, support proliferation of B-lymphocytes, and may promote an anti-inflammatory immune response and hinder effective immune responses against cancer cells.Citation33,Citation34 Abundant Treg cell infiltration into tumors is associated with poor clinical outcomes in various types of cancers.Citation35-Citation37 However, the role of Treg cells remained controversial. Functionally distinct subpopulations of tumor-infiltrating CD4 + T cells contributing in different ways warranted further investigation. CD274 is a ligand that binds to the receptor PD1, commonly found on T-cells, and blocks T-cell activation. We have reported its prognostic value previously.Citation38 GZMB is secreted by CTLs and proteolytically processed to generate the active protease, which induces target cell apoptosis.Citation39,Citation40 PAX5 plays an important role in B-cell differentiation.Citation41,Citation42 Jiang et al. have detected 27 immune features and constructed an immunoscore signature in 879 GC patients with AUC of 0.800 in the training cohort. Another study from 166 patients has also exhibited that a four-factor immunoscore system including PDL1 in tumor cells, PDL1 in immune cells, PD1 and CD8 could predict clinical outcome for stage II and III gastric cancer.Citation20 In contrast with them, our study has 1180 patients, including patients with neoadjuvant chemotherapy. Besides, our classifier contained EMT features, which could improve its predictive accuracy. However, our AUC value is relatively lower than the previous model, possible reasons might be somewhat missing information due to tissue arrays, such as the TILs distinguished assessment from tumor center or the invasive margin.
In TCGA project, GC was divided into four subtypes based on the molecular classification: Epstein-Barr virus-positive tumors, microsatellite-instable tumors, genomically stable tumors, and tumors with chromosomal instability.Citation22 However, this subtyping did not show differences in outcomes. The Singapore study identified three distinct molecular signatures based on genetic and epigenetic expression of drug-responsive clusters.Citation21 Another study from the Asian Cancer Research Group used the proposed classification of gastric adenocarcinoma into microsatellite-instable GC, microsatellite-stable adenocarcinomas (with no EMT gene signature), and microsatellite-stable adenocarcinomas with EMT gene signature, which showed the worst prognosis.Citation23 It has also been reported that GC patients could be stratified into immune, stem-like, and epithelial subtypes with a single patient classifier based on a group of genes (GZMB, WARS, SFRP4, and CDX1).Citation20 Compared to these models, our model showed better performance and applicability. Identification of EMT markers and TILs with IHC might also be a straightforward and clinically applicable procedure. Moreover, it could indicate the bio-immunological characteristics of GC and provide additional information from TNM staging and identify high-risk patients more likely to benefit from AC. Although further validation is essential, our results suggest that GC patients with the same TNM stage might be stratified into different risk groups using this classifier, and thus be treated with different approaches to improve their outcome. Nevertheless, the mechanisms underlying the immune responses and EMT marker functions in AC for GC have not been thoroughly elucidated, and further investigation may provide additional information and novel therapeutic strategies.
Our study has some limitations. It was a retrospective study from patients only in China. However, the significant contribution of China to the worldwide burden of GC supports the performance of an initial investigation in a Chinese population. However, prospective studies with larger sample size cohorts from multiple centers, especially those including non-Asian cohorts, are warranted to further validate the performance of the signatures. Further studies should also investigate whether the classifier can predict the responses of GC patients to immunotherapy.
Materials and methods
Study population and sample collection
Samples from patients treated with curative gastrectomy for adenocarcinoma of the stomach or oesophago-gastric junction at Peking University Cancer Hospital between January 2000 and December 2012 were retrieved. Inclusion criteria for the 1180 patients were primary diagnosis of gastric adenocarcinoma, no metastatic disease at diagnosis, with available FFPE tissue and follow-up information. All the samples were independently inspected by two pathologists to confirm the existence of tumor cells and to confirm that the identified pTNM stages of the samples. Clinical information and follow-up data were obtained from the prospectively maintained database in the hospital. The overall survival time was defined to be the period of time in months from the date of surgery to the date of death from any cause. This study was approved by the institutional review boards, and appropriate written informed consent was obtained from all patients. The pTNM stage was determined according to the 7th edition of the UICC guidelines.
Proteins detection
We first included common immunomarker proteins, including CD3 (pan T-cells), CD8 (cytotoxic T-lymphocytes (CTL)), CD4 (helper T-cells), CD20 (B-cells), CD45RO (memory T-cells), CD45RA (naïve T-cells), CD57 (natural killer cells), CD66b (neutrophils), CD68 (macrophages), and FoxP3 (regulatory T-cells). We also included the cytotoxic T-lymphocyte-associated serine esterase 1 (GZMB), B-cell lineage-specific activator (PAX5), and negative regulator of T-cell responses (CTLA4, IDO1, TIM3, and PD1). CD274 and PDL2 were also included, as we previously reported their potential for predicting outcomes in GC patients.Citation24 Next, we empirically selected a list of well-recognized cancer regulators, including proteins functioning in cell cycle (CDK1, CDK4, CCND1, CCNE1), stem cell (CD44, LGR5, CXCR4), DNA damage repair (TP53, BCL2, MDM2, PTEN), mismatch repair (MSH2, MLH1, MSH6, PSM2), and cell adhesion and junction (CDH1, CTNNB1, VIM). Protein kinases and phosphatases (AKT, MET, KIT), growth factor-related genes (ERBB2, EGFR, VEGFA) were also selected (Table S1).
IHC staining was performed and evaluated as previously described.Citation32 Details of the protocols and scoring schema are presented in supplementary documents.
Data processing and model construction
After data processing with the missing data exclusion and imputation calculation by random forest model, the patients were assigned to a disjoint training set, testing set, and validation set by using the “caret” package in R (version 3.5.1). We applied the group Lasso model to all the features (proteins and clinical characteristics) and used the Cox regression model to develop the model for the classifier in the training set. To ensure a robust selection, we applied a bootstrap process wherein group Lasso implementation was repeated 100 times, and the most prevalent features were selected. Detailed methods and cutoffs for data processing and model construction are described in the supplementary methods.
Author’s contributions
XFX designed the study and drafted the manuscript. SQJ, YXL, and QW interpreted the results and revised the manuscript. FML participated in the quantification of pathological images. BD, ZWL, QF, and YQL supported the study with pathological evaluation and experimentation. TG, XJC, and XXM supported with sample collection, clinical information integration, and image scanning. ZYL provided clinical advice. ZL and NM provided statistical support. JFJ is responsible for the study concept and supervision.
Disclosure of potential conflicts of interest
All the authors have no conflict of interest to declare.
Supplemental Material
Download ()Acknowledgments
The results here are in part based upon data generated by the TCGA Research Network: https://www.cancer.gov/tcga.
Supplementary material
Supplemental data for this article can be accessed on the publisher’s website.
Additional information
Funding
References
- Torre LA, Bray F, Siegel RL, Ferlay J, Lortet-Tieulent J, Jemal A. Global cancer statistics, 2012. CA Cancer J Clin. 2015;65:87–9. doi:10.3322/caac.21262.
- Zhou J, Wu X, Li G, Gao X, Zhai M, Chen W, Hu H, Tang Z. Prediction of radiosensitive patients with gastric cancer by developing gene signature. Int J Oncol. 2017;51(4):1067–1076. doi:10.3892/ijo.2017.4107.
- Sasako M, Inoue M, Lin JT, Khor C, Yang HK, Ohtsu A. Gastric Cancer Working Group report. Jpn J Clin Oncol. 2010;40(Suppl 1):i28–37. doi:10.1093/jjco/hyq124.
- Noh SH, Park SR, Yang HK, Chung HC, Chung IJ, Kim SW, Kim HH, Choi J-H, Kim H-K, Yu W. Adjuvant capecitabine plus oxaliplatin for gastric cancer after D2 gastrectomy (CLASSIC): 5-year follow-up of an open-label, randomised phase 3 trial. Lancet Oncol. 2014;15:1389–1396. doi:10.1016/S1470-2045(14)70473-5.
- Nakajima T, Fujii M. What make differences in the outcome of adjuvant treatments for resected gastric cancer? World J Gastroenterol. 2014;20:11567–11573. doi:10.3748/wjg.v20.i33.11567.
- Nakamura Y, Yamanaka T, Chin K, Cho H, Katai H, Terashima M, Misawa K, Hirao M, Yoshida K, Oki E, et al. Survival outcomes of two phase 2 studies of adjuvant chemotherapy with S-1 plus oxaliplatin or capecitabine plus oxaliplatin for patients with gastric cancer after D2 gastrectomy. Ann Surg Oncol. 2019;26(2):465–472. doi:10.1245/s10434-018-7063-8.
- Wadhwa R, Song S, Lee JS, Yao Y, Wei Q, Ajani JA. Gastric cancer-molecular and clinical dimensions. Nat Rev Clin Oncol. 2013;10:643–655. doi:10.1038/nrclinonc.2013.170.
- Zali H, Rezaei-Tavirani M, Vafaee R, Rezaei-Tavirani M. Gastric cardia adenocarcinoma pathway analysis. Gastroenterol Hepatol Bed Bench. 2013;6:S11–18.
- Okines AF, Gonzalez de Castro D, Cunningham D, Chau I, Langley RE, Thompson LC, Stenning SP, Saffery C, Barbachano Y, Coxon F, et al. Biomarker analysis in oesophagogastric cancer: results from the REAL3 and TransMAGIC trials. Eur J Cancer. 2013;49:2116–2125. doi:10.1016/j.ejca.2013.02.007.
- Fareed KR, Kaye P, Soomro IN, Ilyas M, Martin S, Parsons SL, Madhusudan S. Biomarkers of response to therapy in oesophago-gastric cancer. Gut. 2009;58:127–143. doi:10.1136/gut.2008.155861.
- Miao Y, Sui J, Xu SY, Liang GY, Pu YP, Yin LH. Comprehensive analysis of a novel four-lncRNA signature as a prognostic biomarker for human gastric cancer. Oncotarget. 2017;8:75007–75024. doi:10.18632/oncotarget.20496.
- Lee J, Cristescu R, Kim KM, Kim K, Kim ST, Park SH, Kang WK. Development of mesenchymal subtype gene signature for clinical application in gastric cancer. Oncotarget. 2017;8:66305–66315. doi:10.18632/oncotarget.19985.
- Clermont PL, Fornaro L, Crea F. Elevated expression of a pharmacologic Polycomb signature predicts poor prognosis in gastric and breast cancer. Epigenomics. 2017;9:1329–1335. doi:10.2217/epi-2017-0074.
- Song P, Jiang B, Liu Z, Ding J, Liu S, Guan W. A three-lncRNA expression signature associated with the prognosis of gastric cancer patients. Cancer Med. 2017;6:1154–1164. doi:10.1002/cam4.1047.
- Fridman WH, Pages F, Sautes-Fridman C, Galon J. The immune contexture in human tumours: impact on clinical outcome. Nat Rev Cancer. 2012;12:298–306. doi:10.1038/nrc3245.
- Jiang Y, Zhang Q, Hu Y, Li T, Yu J, Zhao L, Ye G, Deng H, Mou T, Cai S, et al. ImmunoScore signature: a prognostic and predictive tool in gastric cancer. Ann Surg. 2018;267:504–513. doi:10.1097/SLA.0000000000002116.
- Donnem T, Kilvaer TK, Andersen S, Richardsen E, Paulsen EE, Hald SM, Al-Saad S, Brustugun OT, Helland A, Lund-Iversen M, et al. Strategies for clinical implementation of TNM-Immunoscore in resected nonsmall-cell lung cancer. Ann Oncol. 2016;27(2):225–232. doi:10.1093/annonc/mdv560.
- Lee HE, Chae SW, Lee YJ, Kim MA, Lee HS, Lee BL, Kim WH. Prognostic implications of type and density of tumour-infiltrating lymphocytes in gastric cancer. Br J Cancer. 2008;99:1704–1711. doi:10.1038/sj.bjc.6604738.
- Pages F, Mlecnik B, Marliot F, Bindea G, Ou FS, Bifulco C, Lugli A, Zlobec I, Rau TT, Berger MD, et al. International validation of the consensus Immunoscore for the classification of colon cancer: a prognostic and accuracy study. Lancet. 2018;391:2128–2139. doi:10.1016/S0140-6736(18)30789-X.
- Cheong JH, Yang HK, Kim H, Kim WH, Kim YW, Kook MC, Park YK, Kim -H-H, Lee HS, Lee KH, et al. Predictive test for chemotherapy response in resectable gastric cancer: a multi-cohort, retrospective analysis. Lancet Oncol. 2018;19:629–638. doi:10.1016/S1470-2045(18)30108-6.
- Lei Z, Tan IB, Das K, Deng N, Zouridis H, Pattison S, Chua C, Feng Z, Guan YK, Ooi CH, et al. Identification of molecular subtypes of gastric cancer with different responses to PI3-kinase inhibitors and 5-fluorouracil. Gastroenterology. 2013;145(3):554–565. doi:10.1053/j.gastro.2013.05.010.
- Cancer Genome Atlas Research N. Comprehensive molecular characterization of gastric adenocarcinoma. Nature. 2014;513(7517):202–209. doi:10.1038/nature13480.
- Cristescu R, Lee J, Nebozhyn M, Kim KM, JC T, Wong SS, Liu J, Yue YG, Wang J, Yu K, et al. Molecular analysis of gastric cancer identifies subtypes associated with distinct clinical outcomes. Nat Med. 2015;21:449–456. doi:10.1038/nm.3850.
- Giordano SH, Elias AD, Gradishar WJ. NCCN guidelines updates: breast cancer. J Natl Compr Canc Netw. 2018;16:605–610. doi:10.6004/jnccn.2018.0043.
- Salgado R, Denkert C, Demaria S, Sirtaine N, Klauschen F, Pruneri G, Wienert S, Van den Eynden G, Baehner FL, Penault-Llorca F, et al. The evaluation of tumor-infiltrating lymphocytes (TILs) in breast cancer: recommendations by an International TILs Working Group 2014. Ann Oncol. 2015;26(2):259–271. doi:10.1093/annonc/mdu450.
- Yan R, Yang X, Wang X, Wang B, Zhao Y, Huang W, Zhao W, Jia L. Association between intra-tumoral immune response and programmed death ligand 1 (PD-L1) in gastric cancer. Med Sci Monit. 2019;25:6916–6921. doi:10.12659/MSM.916432.
- Schalper KA, Brown J, Carvajal-Hausdorf D, McLaughlin J, Velcheti V, Syrigos KN, Herbst RS, Rimm DL. Objective measurement and clinical significance of TILs in non-small cell lung cancer. J Natl Cancer Inst. 2015;107:dju435.
- Melo S, Figueiredo J, Fernandes MS, Goncalves M, Morais-de-Sa E, Sanches JM, Seruca R. Predicting the functional impact of CDH1 Missense mutations in hereditary diffuse gastric cancer. Int J Mol Sci. 2017;18:12.
- Guilford P, Humar B, Blair V. Hereditary diffuse gastric cancer: translation of CDH1 germline mutations into clinical practice. Gastric Cancer. 2010;13:1–10. doi:10.1007/s10120-009-0531-x.
- Luo W, Fedda F, Lynch P, Tan D. CDH1 gene and hereditary diffuse gastric cancer syndrome: molecular and histological alterations and implications for diagnosis and treatment. Front Pharmacol. 2018;9:1421. doi:10.3389/fphar.2018.01421.
- Hansford S, Kaurah P, Li-Chang H, Woo M, Senz J, Pinheiro H, Schrader KA, Schaeffer DF, Shumansky K, Zogopoulos G. Hereditary diffuse gastric cancer syndrome: CDH1 mutations and beyond. JAMA Oncol. 2015;1:23–32. doi:10.1001/jamaoncol.2014.168.
- Hakkaart C, Ellison-Loschmann L, Day R, Sporle A, Koea J, Harawira P, Cheng S, Gray M, Whaanga T, Pearce N, et al. Germline CDH1 mutations are a significant contributor to the high frequency of early-onset diffuse gastric cancer cases in New Zealand Maori. Fam Cancer. 2019;18:83–90. doi:10.1007/s10689-018-0080-8.
- Crunkhorn S. Cancer immunotherapy: targeting regulatory T cells. Nat Rev Drug Discov. 2017;16:754.
- Tanaka A, Sakaguchi S. Regulatory T cells in cancer immunotherapy. Cell Res. 2017;27:109–118. doi:10.1038/cr.2016.151.
- Curiel TJ, Coukos G, Zou L, Alvarez X, Cheng P, Mottram P, Evdemon-Hogan M, Conejo-Garcia JR, Zhang L, Burow M, et al. Specific recruitment of regulatory T cells in ovarian carcinoma fosters immune privilege and predicts reduced survival. Nat Med. 2004;10(9):942–949. doi:10.1038/nm1093.
- deLeeuw RJ, Kost SE, Kakal JA, Nelson BH. The prognostic value of FoxP3+ tumor-infiltrating lymphocytes in cancer: a critical review of the literature. Clin Cancer Res. 2012;18:3022–3029. doi:10.1158/1078-0432.CCR-11-3216.
- Sato E, Olson SH, Ahn J, Bundy B, Nishikawa H, Qian F, Jungbluth AA, Frosina D, Gnjatic S, Ambrosone C, et al. Intraepithelial CD8+ tumor-infiltrating lymphocytes and a high CD8+/regulatory T cell ratio are associated with favorable prognosis in ovarian cancer. Proc Natl Acad Sci U S A. 2005;102(51):18538–18543. doi:10.1073/pnas.0509182102.
- Xing X, Guo J, Ding G, Li B, Dong B, Feng Q, Zhang J, Ying X, Cheng X, Guo T, et al. Analysis of PD1, PDL1, PDL2 expression and T cells infiltration in 1014 gastric cancer patients. Oncoimmunology. 2018;7:e1356144. doi:10.1080/2162402X.2017.1356144.
- Andrade F, Casciola-Rosen LA, Rosen A. Granzyme B-induced cell death. Acta Haematol. 2004;111:28–41. doi:10.1159/000074484.
- Jarosch A, Sommer U, Bogner A, Reissfelder C, Weitz J, Krause M, Folprecht G, Baretton GB, Aust DE. Neoadjuvant radiochemotherapy decreases the total amount of tumor infiltrating lymphocytes, but increases the number of CD8+/Granzyme B+ (GrzB) cytotoxic T-cells in rectal cancer. Oncoimmunology. 2018;7(2):e1393133. doi:10.1080/2162402X.2017.1393133.
- Carotta S, Holmes ML, Pridans C, Nutt SL. Pax5 maintains cellular identity by repressing gene expression throughout B cell differentiation. Cell Cycle. 2006;5:2452–2456. doi:10.4161/cc.5.21.3396.
- Medvedovic J, Ebert A, Tagoh H, Busslinger M. Pax5: a master regulator of B cell development and leukemogenesis. Adv Immunol. 2011;111:179–206.