
ABSTRACT
The metabolic gene isocitrate dehydrogenase 1 (IDH1) is commonly mutated in lower grade glioma (LGG) and secondary glioblastoma (GBM). Regulatory T cells (Tregs) play a significant role in the suppression of antitumor immunity in human glioma. Given the importance of Tregs in the overall framework of designing immune-based therapies, a better understanding on their association with IDH mutational status remains of critical clinical importance. Using multispectral imaging analysis, we compared the incidence of Tregs in IDH-mutant and IDH wild-type glioma from patient tumor samples of LGG. An orthotopic IDH-mutant murine model was generated to evaluate the role of mutant IDH on Treg infiltration by immunohistochemistry. When compared to IDH wild-type controls, Tregs are disproportionally underrepresented in mutant disease, even when taken as a proportion of all infiltrating T cells. Our findings suggest that therapeutic agents targeting Tregs may be more appropriate in modulating the immune response to wild-type disease.
Introduction
Glioma represents a set of molecularly diverse neoplasms that are notoriously resistant to standard therapies. For glioblastoma (GBM), the most common and highest grade primary brain tumor in adults, there have been very few therapeutic advances over the last 20 years,Citation1 and prognosis remains poor despite maximal surgical resection followed by a combination of radiation and chemotherapy .Citation2 Gliomas harboring mutations in isocitrate dehydrogenase 1 (IDH1) represent the great majority of World Health Organization (WHO) grade II and grade III gliomas (80–90%), known as “lower grade glioma (LGG).” Though patients with LGG have prolonged survival compared to those with GBM, the majority of these tumors recur after first-line therapies and ultimately transform into higher grade, rapidly fatal malignancies. Higher-grade gliomas are associated with profound immune suppression, due in part to infiltration of suppressive T cells known as regulatory T cells (Tregs). In fact, Treg infiltration is considered a hallmark of GBM and likely plays a role in tumor development and progression .Citation3–Citation5 The number of infiltrating Tregs in high-grade glioma has been shown to correlate with increasing grade and prognosis .Citation3,Citation6-Citation9 Most investigative work on the interaction between glial tumors and Tregs has focused on GBM, which is predominately IDH wild-type disease. The relationship between IDH mutations and Treg infiltration is not well-understood.
Here, we use multispectral imaging analysis to compare Treg infiltration in IDH-mutant and IDH wild-type glioma using human subject samples of LGG, and we correlate these results with those in an orthotopic syngeneic glioma rodent model. We demonstrate that IDH-mutant glioma is associated with fewer infiltrating Tregs than their wild-type counterparts, suggesting distinct tumor microenvironments.
Materials and methods
TCGA analysis
Using the Xena Functional Genomic Browser, we accessed The Cancer Genome Atlas (TCGA) LGG level 3 gene expression data from the University of North Carolina TCGA genome characterization center. The Treg -associated gene panel was assembled in two distinct ways: (i) Using a gene set previously described and clinically validated for Treg enrichment ;Citation10 and (ii) using Treg-associated genes from the literature documented to have an immunosuppresive role in malignant glioma .Citation11–Citation14 Data were stratified into two groups based on IDH mutational status; IDH-mutant (n = 413) and IDH wild-type cases (n = 117). Log2 expression of genes was used to compare the expression levels of 29 Treg -associated genes.
CIBERSORT analysis
To characterize the immune cell composition using transcriptional data derived from the TCGA LGG dataset, we utilized the CIBERSORT algorithm .Citation15 The recommended model parameters were used to computationally predict the immune cell abundance for 22 immune cell types based on the deconvolution of gene expression profiles from each patient .Citation15 The RNA-seq deconvolution results for the relative Treg abundance (n = 370) were compared between IDH-mutational status.
Cell culture
293 T immortalized human embryonic kidney cells, GL261 murine glioma cells were maintained in Dulbecco’s Modified Eagle Medium (DMEM) supplemented with 10% fetal bovine serum (FBS) and 1% Corning’s antibiotic-antimycotic solution, housed in a 37 C/5% CO2 incubator.
Generation of cell lines transduced with IDH1R132H cDNA
Recombinant destination vectors were sequenced to confirm gateway cloning of donor plasmids that contained either IDH1 (Addgene; 82133) or IDH1R132H (Addgene; 81686). 293 T cells were plated at a density of 1 × 10⁶ in a 6-well plate in antibiotic-free DMEM media overnight. Cells were then co-transfected with 0.5 μg VSVG, 1.0 μg dR8.2 and 1.0 μg pLenti CMV Blast DEST 1.0 μg (Addgene; 17451) encoding cDNA for either IDH1 or the IDH1R132H. 48 hours post-transfection, viral supernatant was harvested. Parental GL261 cells were plated at a density of 1 × 10⁶ in a 6-well plate in antibiotic-free DMEM media and sequentially transduced with virus encoding cDNA for either IDH1 or IDH1R132H. 72-h post transduction, GL261 cell lines were selected for stably transduced cells with blasticidin at 20 μg/ml.
Intracranial injections of murine cell lines
Six-week old C57BL/6 mice were purchased from the Charles River Laboratory. Using a Hamilton 11701 Gastight syringe (Hamilton Company), GL261 IDH1 and GL261 IDH1R132H (7.5 x 10⁴ cells per mouse) cells were suspended in 3 μl of cold PBS and stereotactically (Kopf Instruments) injected into the brain (2.5 mm right of the bregma and 3.0 mm below the skull) of seven-week-old mice. Cell lines were tested for mycoplasma prior to injection. Mice were monitored daily and maintained in accordance with our Institutional Animal Care and Use Committee (IACUC) approved protocol.
Western blot
2 x 10⁶ cells were lysed using ice-cold RIPA buffer containing protease and phosphatase inhibitors. Total protein concentration was quantified using Pierce BCA Protein Assay Kit (Thermo Scientific; 23225). Protein sample were prepared at a concentration of 2 μg/μl with SDS loading dye and MilliQ H2O then denatured at 95 C prior to being loaded to gel (BioRad; 456–1085). Parental cell lysate was used as a negative control. Western blot staining was performed using primary antibodies; IDH1R132H (1:100; Dianova; DIA-H09), Vinculin (1:10000; Thermo Scientific; 700062) and Actin (1:1000; Cell Signaling; 3700) following the manufacture’s protocol. For western blot detection, enhanced chemiluminescent (BioRad; 170–5061) was used for visualization and band densities were read using BioRad Image Lab Software.
Detection of 2-Hydroxyglutarate
1 x 10⁶ cells were lysed using Cell Lytic M (Sigma-Aldrich; C3228) and deproteinized with perchloric acid (PCA). Sample pH was adjusted to neutral pH range 6.5–8.0 using 0.1 M potassium hydroxide (KOH) or 0.1 M PCA. Following the manufacture’s protocol, a 2-fold serial dilution was performed to generate a standard curve. 2-Hydroxyglutarate (2HG) Complete Reaction Mixture (Sigma-Aldrich; MAK320B) including Resazurin solution (Sigma-Aldrich; MAK320C) was reconstituted with the sample. Sample triplicate were plated on a 96-well black plate and results were read using a multi-well fluorometer (BioTek Instrumentals) using the following conditions: λex = 540 nm/λem = 590 nm.
Immunohistochemistry
Mice were sacrificed at day 25 post-injection and brains were harvested and fixed in 10% formalin followed by 70% ethanol. Brains were sequentially embedded in paraffin blocks, serially sectioned (8 μm thick) and H&E stained. After deparaffinization in xylene and gradual rehydration in ethanol, slides were placed in 10 mM sodium citrate buffer (pH 6.0) and microwaved for 15 minutes for antigen retrieval. Slides were then treated with 3% H2O2 to block endogenous peroxidase followed by a 60 minute incubated with 1% bovine serum albumin in normal horse serum blocking buffer (Vector Laboratories). Slides were then incubated with primary antibodies: IDH1R132H (1:100; Dianova; DIA-H09), CD3 (1:200; Abcam; ab5690), CD4 (1:200; eBioscience; 14–9766-80), CD8 (1:200; eBioscience; 14–0808-80) and FoxP3 (1:100; Cell Signaling; 12653) overnight at 4 C. The absence of the primary antibody was used as a negative control. The slides were then incubated for 30 minutes with the appropriate secondary antibody (Vector Laboratories) according to the manufacturer’s protocol followed by diaminobenzidine (DAKO; K3468) reaction and hematoxylin counterstain. Slide covers were mounted with cytoseal-XYL and imaged using a light microscope (Nikon Optiphot 2). To quantify positive cells, 5 fields per tumor section were photographed at 10x magnification. Stained slides were enumerated and averaged. Counter was blinded to the study and enumerated positive cells per field using Image J.
Multiplex immunofluorescence
Based on the 2016 WHO histological and molecular critera, WHO grade III glioma primary specimen were randomly selected from a tumor archive at Massachusetts General Hospital (MGH). IDH1 mutational status was determined during the diagnosis through next-generation sequencing or immunohistochemistry for all cases. Formalin-fixed, paraffin-embedded (FFPE) blocks with solid tumor with tumor cell percentages higher than 80% were selected by a dedicated neuropathologist (A.O.S) at MGH prior to sectioning. Unstained sections were then stained using the Ventana Discovery Ultra Immunostaining platform following the manufacture’s protocol for the Multi-plex immunofluorescence panel (Roche). The following antibodies were used: DAPI (pre-diluted; Ventana; 760–4196), CD3 (pre-diluted; Ventana; 790–4341), CD4 (pre-diluted; Ventana; 790–4423) and FoxP3 (1:50; Biolegend; 320101). Single stains were used to generate a spectral library required for multispectral image analysis. The absence of the primary antibody was used as a negative control and human nonmalignant tonsil was used as a positive control for all antibodies.
Multispectral image acquisition and analysis
Uniplex and multiplex immunofluorescence-stained slides were imaged and scanned using the Vectra 3.0 spectral imaging system (PerkinElmer). To properly discern each fluorescent stain from autofluorescence, artifact and/or background, uniplex spectral libraries were generated using InForm 2.2.1 image analysis software (PerkinElmer) and Phenochart 1.0.4 (PerkinElmer) by capturing each fluorophore at higher resolution (20x) within the tumor. Once the spectral library was established, data from the scanned multispectral images were accessed by InForm 2.2.1 and each image was unmixed and then fused, incorporating the algorithm set by the spectral library. The images were sequentially uploaded to HALO imaging analysis software (Indica Labs) for segmentation and analysis. First, the tumor area (mm2) was manually annotated, and parameters were set using DAPI to define a cell’s cytoplasm, nucleus, and membrane. The following fluorophores were used: DAPI (Nuclear), Texas Red (CD3), Aqua (CD4), and FITC (FoxP3). Thresholds were assigned to each marker corresponding to a particular fluorescence intensity in order to capture and enumerate each cell type of interest. Due to the very slight variability in staining uptake, the parameters were calibrated-specific to each specimen. The algorithm searched for the colocalization of DAPI+ CD3+ (i.e., CD3 T cells), DAPI+ CD3+ CD4+ FoxP3− (i.e., CD4 T cells) and DAPI+ CD3+ CD4+ FoxP3+ (i.e., Tregs). The number of positive cells per area (mm2) and proportion of all infiltrating T cells were calculated.
Statistics
All statistical analyses were conducted using GraphPad Prism version 7. P values were obtained using a two-sided, unpaired t-test and values ≤ 0.05 were considered significant.
Study approval
Clinical samples were obtained from the Pathology Tissue Core at MGH under a protocol that was approved by the MGH institutional review board. All mouse experiments were conducted under a protocol approved by MGH IACUC.
Results
Genes associated with regulatory T cells are differentially expressed in IDH glioma subtypes
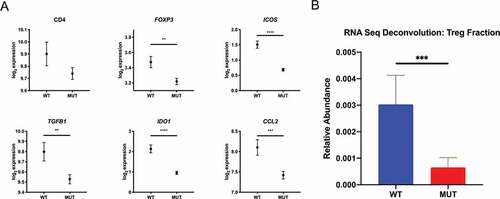
We analyzed mRNA expression levels of Treg-associated genes from the TCGA LGG dataset and compared gene expression profiles of IDH-mutant (n = 413) and IDH wild-type cases (n = 117). A panel of 29 Treg-associated genes were used in our analysis, based on a set of genes previously described and clinically validated for Treg enrichmentCitation10 and Treg-associated genes curated from literature previously documented to have an immunosuppressive role in malignant glioma .Citation11–Citation14 Our analysis identified 19 Treg-associated genes to be significantly downregulated in IDH-mutant cases (Supplementary Table 1). Genes critical for the function and stability of Tregs (e.g., FOXP3 and ICOS), inducible Treg factors (e.g., IDO1 and TGFB1), as well as Treg chemoattractants (e.g., CCL2), were significantly downregulated in IDH-mutant cases when compared to IDH wild-type cases (). To substantiate this finding, we utilized the CIBERSORT platform to interrogate gene expression profiles derived from the TCGA LGG dataset to estimate the immune cell composition between IDH mutational status .Citation15 In line with our observations, we found a lower mean abundance of Tregs in IDH-mutant glioma cases compared to IDH wild-type cases (). At the transcriptional level, Treg-associated genes are preferentially enriched in IDH wild-type tumors compared to mutant tumors.
Figure 1. Differential gene expression profile of intratumoral Tregs associates with IDH1 status. Using the Xena Functional Genomic Browser, TCGA gene expression data were downloaded for WHO grade II and III glioma cases. IDH wild-type (n = 117) and IDH-mutant (n = 413) cases were compared for differential Treg-associated gene expression and relative Treg abundance using the CIBERSORT algorithm. (a) Lower expression levels of Treg-associated genes and (b) lower relative Treg abundance in IDH-mutant versus IDH-wild type patients. In A, graphs depict the log2 expression value of each gene, each dot represents the mean expression and error bars indicate the SEM for each group. In B, graph depict the mean relative abundance of infiltrating Tregs and error bars indicate the SEM for each group. P-values were determined using two-sided, unpaired t tests; *P < .05; **P < .01; ***P < .001; ****P < .0001.
IDH-mutant tumors contain decreased numbers of regulatory T cells in mice
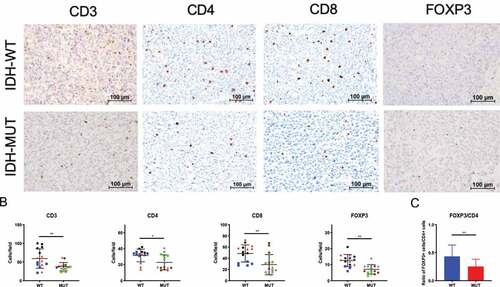
Next, we evaluated the degree to which IDH status might correlate with intratumoral Treg infiltration using an in vivo experimental system in immune-competent mice. Using the syngeneic GL261 murine glioma cell line we generated two isogenic cell lines that differed only in IDH mutational status. We transduced GL261 cells with a lentiviral construct encoding either IDH1 cDNA or IDH1R132H cDNA and then probed for tumor expression of mutant IDH1 protein and 2HG levels (). Tumors were harvested from tumor-bearing C57BL/6 mice and evaluated for Treg infiltration. Consistent with previous reports ,Citation16,Citation17 the overall lymphocytic infiltrate was significantly reduced in IDH-mutant tumors, as measured by CD3+, CD4+, and CD8+ cells per field (). Furthermore, in tumors harboring the IDH1 mutation, immunohistochemistry showed significant reductions in the total number of FoxP3+ cells as well as decreased proportions of Tregs within the CD4+ compartment (IDH-mutant: 24.7% vs. IDH wild-type: 44.3%) (p < .05; ).
Figure 2. Syngeneic GL261 IDH-mutant murine gliomas demonstrate reduced FoxP3+ cell infiltration. C57BL/6 mice received intracranial injections of 7.5 × 10⁴ GL261 glioma cells stably transduced with cDNA for either wild-type (n = 3) or the R132H (n = 3) form of IDH1. Day-25 tumors were removed from mice and brain tumor sections stained for immunohistochemistry. (a) Representative immunohistochemistry staining for CD3, CD4, CD8 or FoxP3 in both IDH wild-type (top panel) and IDH-mutant (bottom panel) mice. Scale bars, 100 µm. (b) The number of positive cells from 5 fields at 10x magnification per mouse were counted and presented here. Each individual mouse is identified by a symbol and color. (c) FoxP3+ lymphocyte/CD4+ lymphocyte ratio in murine syngeneic IDH-mutant and IDH wild-type gliomas. In B and C, mean and error bars indicate the SD of each group. P-values were determined using 2-sided, unpaired t tests; * p < .05; ** p < .01.
IDH mutations are associated with decreased numbers of infiltrating regulatory T cells in human glioma
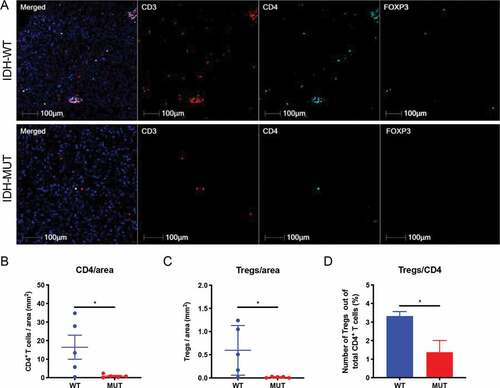
We next performed multiplex-immunofluorescence staining on FFPE sections from patient samples of IDH-mutant and IDH wild-type LGG. We enumerated CD3+CD4+FoxP3+ triple positive cells using HALO multispectral imaging analysis software in IDH-mutant and IDH wild-type tissue sections. Similar to our murine data, we found significantly fewer tumor-infiltrating Tregs in IDH-mutant gliomas when compared with IDH wild-type gliomas (). Moreover, IDH-mutant tumors displayed significantly decreased Tregs when considered as a proportion of CD4+ cells (IDH-mutant: 1.37% vs. IDH wild-type: 3.32%) (p < .05; ). There was a trend toward fewer total CD3+ (p = .18; ) and CD4+ (p < .05; ) cells in IDH-mutant gliomas. Altogether, these data indicate that glioma-associated Treg infiltration is less abundant in both murine models and patient samples of IDH-mutant glioma.
Figure 3. Reduced Treg numbers and proportions of Treg/CD4 T cells in WHO grade III IDH-mutant gliomas compared with IDH wild-type glioma. FFPE sections from IDH wild-type (n = 5) and IDH-mutant (n = 5) WHO grade III gliomas were stained for CD3 (Texas Red), CD4 (Aqua), FoxP3 (FITC). The number of CD3+CD4+FoxP3+ triple positive cells from IDH wild-type and IDH-mutant tumors was calculated using HALO imaging analysis software. (a) Representative immunofluorescence images were taken for CD3 (red), CD4 (aqua), FoxP3 (green) either alone or merged in IDH wild-type (top panel) and IDH-mutant (bottom panel) tumors. (b) The number of CD3+CD4+ double positive cells per area (mm2) of tumor was calculated for each specimen. (c) The number of CD3+CD4+FoxP3+ triple positive cells per area (mm2) of tumor was calculated for each specimen. (d) CD3+CD4+FoxP3+ triple positive cells as a percentage of total CD3+CD4+ cells were calculated for each specimen. In B and C, each individual patient is identified by a dot. In B-D, mean and error bars indicate the SD of each group. P-values were determined using 2-sided, unpaired t tests; * p < .05.
Discussion
Tregs play a critical role in the suppression of anti-tumor immunity. Prior studies have been performed that demonstrate differences in Treg infiltration across histological grades in glioma .Citation3 In the current study, we use human samples and murine models to show that Tregs are disproportionally underrepresented in IDH-mutant glioma.
Previous work by Kohanbash and colleagues demonstrate that human IDH-mutant glioma displays marked reduction of CD8+ T-cell infiltration compared to IDH wild-type tumors .Citation17 In this report, we demonstrate a significant reduction in CD4+ T cells and FoxP3+ Tregs in IDH-mutant glioma. The decreased numbers of Tregs in IDH-mutant tumors may be related to the concomitant dearth of proinflammatory cells present in these cancers relative to IDH wild-type tumors .Citation3,Citation18 The downstream metabolite of mutant IDH, 2-HG, is also known to drive downregulation of leukocyte chemotactic factors, though the impact of this phenomenon on Tregs in particular is unknown .Citation16 Recent studies have demonstrated that T cells can take up 2-HG derived from tumors harboring IDH mutations. In addition to altered chemotaxis, the decreased Tregs in IDH-mutant gliomas may be due to the accumulation of intracellular 2-HG, resulting in increased apoptosis and reduced proliferation as evidenced by Bunse and colleagues .Citation19 Interestingly in the context of acute myeloid leukemia, 2-HG increased the frequency of Tregs suggesting that niche and cell specific effects of 2-HG may exist .Citation20 Further investigation will be needed to better elucidate potential mechanisms driving our observations.
Our data support mounting evidence that IDH mutations in gliomas are associated with a distinct immune microenvironment. Based on our findings, it is possible that therapeutic agents targeting TregsCitation21,Citation22 would have greater impact when treating IDH wild-type tumors than their IDH-mutant counterparts. Additional work is needed to examine whether this phenomenon is mediated through neomorphic metabolic activity of the IDH-mutant enzyme and whether Treg infiltration is impacted by the use of specific IDH-inhibitors. Early preclinical evidence suggests that checkpoint blockade and antigen specific peptide vaccines may be more effective when combined with IDH inhibitors ,Citation17,Citation19 though the degree of Treg modulation achieved through the use of these inhibitors is unclear.
We used a GL261 glioma murine model to investigate whether IDH-mutations are associated with degree of Treg infiltration. One limitation of this approach is that transduced IDH-mutant cell lines may not completely recapitulate IDH-mutant glioma as it occurs naturally in humans .Citation23 Despite this, our approach did allow us to study IDH-mutations in an immune-competent preclinical model.
In summary, we have identified a considerable reduction in Treg infiltrate in IDH-mutant gliomas in both humans and mice. These data provide additional support for the concept that IDH mutational status may be used as an immunological biomarker in glioma. The relationship between IDH status and Treg burden in lower grade gliomas may help identify optimal responders to experimental therapeutics.
Disclosure of potential conflicts of interest
The authors declare no potential conflicts of interest.
Supplemental Material
Download ()Acknowledgments
This work was supported by the Jenny Fund (www.thejennyfund.org) (W.T.C.), A Shot For Life (www.ashotforlife.org) (W.T.C.), and The Marcus Foundation (www.marcus.foundation) (W.T.C.). This work was also supported by grants from the National Institutes of Health R25NS065743 (B.D.C.), the Neurosurgery Research & Education Foundation and B*Cured Research Fellowship Grant (B.D.C), and the Society for Immunotherapy of Cancer—AstraZeneca Postdoctoral Cancer Immunotherapy in Combination Therapies Clinical Fellowship Award (B.D.C).
Supplementary material
Supplemental data for this article can be accessed on the publisher’s website.
Additional information
Funding
References
- Bastien JI, McNeill KA, Fine HA. Molecular characterizations of glioblastoma, targeted therapy, and clinical results to date. Cancer. 2015;121(4):502–6. doi:10.1002/cncr.28968.
- Stupp R, Mason WP, van den Bent MJ, Weller M, Fisher B, Taphoorn MJ, Belanger K, Brandes AA, Marosi C, Bogdahn U, et al. Radiotherapy plus concomitant and adjuvant temozolomide for glioblastoma. N Engl J Med. 2005;352(10):987–996. doi:10.1056/NEJMoa043330.
- Heimberger AB, Abou-Ghazal M, Reina-Ortiz C, Yang DS, Sun W, Qiao W, Hiraoka N, Fuller GN. Incidence and prognostic impact of FoxP3+ regulatory T cells in human gliomas. Clin Cancer Res. 2008;14(16):5166–5172. doi:10.1158/1078-0432.CCR-08-0320.
- El Andaloussi A, Lesniak MS. An increase in CD4+CD25+FOXP3+ regulatory T cells in tumor-infiltrating lymphocytes of human glioblastoma multiforme. Neuro-oncology. 2006;8(3):234–243. doi:10.1215/15228517-2006-006.
- Crane CA, Ahn BJ, Han SJ, Parsa AT. Soluble factors secreted by glioblastoma cell lines facilitate recruitment, survival, and expansion of regulatory T cells: implications for immunotherapy. Neuro-oncology. 2012;14(5):584–595. doi:10.1093/neuonc/nos014.
- El Andaloussi A, Lesniak MS. CD4+ CD25+ FoxP3+ T-cell infiltration and heme oxygenase-1 expression correlate with tumor grade in human gliomas. J Neurooncol. 2007;83(2):145–152. doi:10.1007/s11060-006-9314-y.
- Sayour EJ, McLendon P, McLendon R, De Leon G, Reynolds R, Kresak J, Sampson JH, Mitchell DA. Increased proportion of FoxP3+ regulatory T cells in tumor infiltrating lymphocytes is associated with tumor recurrence and reduced survival in patients with glioblastoma. Cancer Immunol Immunother. 2015;64(4):419–427. doi:10.1007/s00262-014-1651-7.
- Yue Q, Zhang X, Ye HX, Wang Y, Du ZG, Yao Y, Mao Y. The prognostic value of Foxp3+ tumor-infiltrating lymphocytes in patients with glioblastoma. J Neurooncol. 2014;116(2):251–259. doi:10.1007/s11060-013-1314-0.
- Jacobs JF, Idema AJ, Bol KF, Grotenhuis JA, de Vries IJ, Wesseling P, Adema GJ. Prognostic significance and mechanism of Treg infiltration in human brain tumors. J Neuroimmunol. 2010;225(1–2):195–199. doi:10.1016/j.jneuroim.2010.05.020.
- Charoentong P, Finotello F, Angelova M, Mayer C, Efremova M, Rieder D, Hackl H, Trajanoski Z. Pan-cancer immunogenomic analyses reveal genotype-immunophenotype relationships and predictors of response to checkpoint blockade. Cell Rep. 2017;18(1):248–262. doi:10.1016/j.celrep.2016.12.019.
- Doucette T, Rao G, Rao A, Shen L, Aldape K, Wei J, Dziurzynski K, Gilbert M, Heimberger AB. Immune heterogeneity of glioblastoma subtypes: extrapolation from the cancer genome atlas. Cancer Immunolo Res. 2013;1(2):112–122. doi:10.1158/2326-6066.CIR-13-0028.
- Wainwright DA, Dey M, Chang A, Lesniak MS. Targeting tregs in malignant brain cancer: overcoming IDO. Front Immunol. 2013;4:116. doi:10.3389/fimmu.2013.00116.
- Xu S, Shao QQ, Sun JT, Yang N, Xie Q, Wang DH, Huang Q-B, Huang B, Wang X-Y, Li X-G, et al. Synergy between the ectoenzymes CD39 and CD73 contributes to adenosinergic immunosuppression in human malignant gliomas. Neuro Oncol. 2013;15(9):1160–1172. doi:10.1093/neuonc/not067.
- Zimmer N, Kim E, Sprang B, Leukel P, Khafaji F, Ringel F, Sommer C, Tuettenberg J, Tuettenberg A. GARP as an immune regulatory molecule in the tumor microenvironment of glioblastoma multiforme. Int J Mol Sci. 2019;20:15. doi:10.3390/ijms20153676.
- Newman AM, Liu CL, Green MR, Gentles AJ, Feng W, Xu Y, Hoang CD, Diehn M, Alizadeh AA. Robust enumeration of cell subsets from tissue expression profiles. Nat Methods. 2015;12(5):453–457. doi:10.1038/nmeth.3337.
- Amankulor NM, Kim Y, Arora S, Kargl J, Szulzewsky F, Hanke M, Margineantu DH, Rao A, Bolouri H, Delrow J, et al. Mutant IDH1 regulates the tumor-associated immune system in gliomas. Genes Dev. 2017;31(8):774–786. doi:10.1101/gad.294991.116.
- Kohanbash G, Carrera DA, Shrivastav S, Ahn BJ, Jahan N, Mazor T, Chheda ZS, Downey KM, Watchmaker PB, Beppler C, et al. Isocitrate dehydrogenase mutations suppress STAT1 and CD8+ T cell accumulation in gliomas. J Clin Invest. 2017;127(4):1425–1437. doi:10.1172/JCI90644.
- Berghoff AS, Kiesel B, Widhalm G, Wilhelm D, Rajky O, Kurscheid S, Kresl P, Wöhrer A, Marosi C, Hegi ME, et al. Correlation of immune phenotype with IDH mutation in diffuse glioma. Neuro Oncol. 2017;19(11):1460–1468. doi:10.1093/neuonc/nox054.
- Bunse L, Pusch S, Bunse T, Sahm F, Sanghvi K, Friedrich M, Alansary D, Sonner JK, Green E, Deumelandt K, et al. Suppression of antitumor T cell immunity by the oncometabolite (R)-2-hydroxyglutarate. Nat Med. 2018;24(8):1192–1203. doi:10.1038/s41591-018-0095-6.
- Bottcher M, Renner K, Berger R, Mentz K, Thomas S, Cardenas-Conejo ZE, Dettmer K, Oefner PJ, Mackensen A, Kreutz M, et al. D-2-hydroxyglutarate interferes with HIF-1alpha stability skewing T-cell metabolism towards oxidative phosphorylation and impairing Th17 polarization. Oncoimmunology. 2018;7(7):e1445454. doi:10.1080/2162402X.2018.1445454.
- Maes W, Verschuere T, Van Hoylandt A, Boon L, Van Gool S. Depletion of regulatory T cells in a mouse experimental glioma model through anti-CD25 treatment results in the infiltration of non-immunosuppressive myeloid cells in the brain. Clin Dev Immunol. 2013;2013:952469. doi:10.1155/2013/952469.
- Sampson JH, Schmittling RJ, Archer GE, Congdon KL, Nair SK, Reap EA, Desjardins A, Friedman AH, Friedman HS, Herndon JE, et al. A pilot study of IL-2Ralpha blockade during lymphopenia depletes regulatory T-cells and correlates with enhanced immunity in patients with glioblastoma. PloS One. 2012;7(2):e31046. doi:10.1371/journal.pone.0031046.
- Johnson BE, Mazor T, Hong C, Barnes M, Aihara K, McLean CY, Fouse SD, Yamamoto S, Ueda H, Tatsuno K, et al. Mutational analysis reveals the origin and therapy-driven evolution of recurrent glioma. Science (New York, NY). 2014;343(6167):189–193. doi:10.1126/science.1239947.