
ABSTRACT
Background
Costimulatory molecules play significant roles in mounting anti-tumor immune responses, and antibodies targeting these molecules are recognized as promising adjunctive cancer immunotherapies. Here, we aim to conduct a first full-scale exploration of costimulatory molecules from the B7-CD28 and TNF families in patients with lung adenocarcinoma (LUAD) and generated a costimulatory molecule-based signature (CMS) to predict survival and response to immunotherapy.
Methods
We enrolled 1549 LUAD cases across 10 different cohorts and included 502 samples from TCGA for discovery. The validation set included 970 cases from eight different Gene Expression Omnibus (GEO) datasets and 77 frozen tumor tissues with qPCR data. The underlying mechanisms and predictive immunotherapy capabilities of the CMS were also explored.
Results
A five gene-based CMS (CD40LG, TNFRSF6B, TNFSF13, TNFRSF13C, and TNFRSF19) was initially constructed using the bioinformatics method from TCGA that classifies cases as high- vs. low-risk groups per OS. Multivariable Cox regression analysis confirmed that the CMS was an independent prognostic factor. As expected, CMS exhibited prognostic significance in the stratified cohorts and different validation cohorts. Additionally, the prognostic meta-analysis revealed that CMS was superior to the previous signature. Samples in high- and low-risk groups exhibited significantly different tumor-infiltrating leukocytes and inflammatory activities. Importantly, we found that the CMS scores were closely related to multiple immunotherapy biomarkers.
Conclusion
We conducted the first and most comprehensive costimulatory molecule landscape analysis of patients with LUAD and built a clinically feasible CMS for prognosis and immunotherapy response prediction, which will be helpful for further optimize immunotherapies for cancer.
Background
Over the last few years, lung cancer has become the most common malignant tumor and is a grave danger to global human health, with an annual incidence increasing at a rate of 7.5%.Citation1 Approximately four out of five lung cancers are classified as non-small cell lung cancer (NSCLC). As the major histological subtype of NSCLC, lung adenocarcinoma (LUAD) accounts for over 1 million worldwide deaths annually.Citation2 Despite the amplification of traditional approaches which – in combination with targeted therapy – have reduced mortality, the five-year OS (OS) rate of LUAD remains about 15%.Citation3 The introduction of immunotherapy, especially immune checkpoint inhibitors (ICIs) targeting programmed cell death protein 1 (PD-1) and programmed cell death 1 ligand 1 (PD-L1), has revolutionized lung cancer treatment.Citation4,Citation5 More recently, pembrolizumab monotherapy was approved to replace chemotherapy as the frontline treatment for patients with PD-L1 positive metastatic NSCLC.Citation6 Although treatment for lung cancer has been improved with the development of ICI-based immunotherapies, only a small proportion of patients with lung cancer can benefit from this schedule. Therefore, we must be able to predict the best candidates for immunotherapy and develop other novel immune checkpoint targets.
The success of ICIs has emerged from a deep understanding of the functions of the immune system and immunosuppressive conditions that are generated in the tumor microenvironment (TME).Citation7,Citation8 In the TME, T cells help distinguish cancer cells from healthy cells and initiate subsequent attacks. Before the attack, the naïve T cells need two signals to be active. The first signal is generated once a specific antigen is recognized by the T cell receptor (TCR). The second signal is a nonspecific costimulatory signal.Citation9 Based on the fact that the naïve T cells cannot be activated in without costimulatory signals,Citation10 cancer cells prevent the recognition of these signals by changing the costimulatory molecule signals and expressions in the TME.Citation11 Hence, ICIs prevent tumor cells from delivering incorrect messages to T cells, thereby selectively restoring a tumor-induced immune deficiency in the TME.Citation12 In addition to the best described immune checkpoint pathways (PD-L1/PD-1, CD86/CTLA4) that belong to the B7-CD28 family,Citation13,Citation14 other co-stimulation pathways mainly arise from the tumor necrosis factor (TNF) family.Citation15
Currently, 13 molecules are classified as B7-CD28 family members, including eight molecules (CD80, CD86, PD-L1, PD-L2, ICOSLG, B7-H3, B7x, and HHLA2) that belong to the B7 family and five molecules (CD28, CTLA4, ICOS, PD-1, and TMIGD2) that belong to the CD28 family.Citation13 The TNF family consists of the TNF ligand superfamily (TNFSF) and the TNF receptor superfamily (TNFRSF) with 48 molecules.Citation16 Nineteen legends were defined as TNFSF, and other 29 receptors considered members of the TNFRSF (). These costimulatory molecules – consisting of members of the B7-CD28 and TNF families – constitute potential molecular targets for the development of novel ICIs and may make excellent additions to existing immunotherapeutic strategies.Citation17,Citation18 However, the expression patterns and clinical significance of the majority of these members remain unknown. There is a need for full-scale investigations of these molecules in patients with LUAD.
Table 1. Univariate Cox analysis of costimulatory molecule genes in TCGA Cohort.
We used LUAD gene expression data from The Cancer Genome Atlas (TCGA) to systematically explore the expression patterns and prognoses of these costimulatory molecules. Then, through a series of statistical methods, we built a costimulatory molecule-based signature (CMS) with significantly different prognoses. The CMS was well-validated in nine different cohorts from Gene Expression Omnibus (GEO) datasets and an independent cohort using clinical samples. Also, according to a prognostic meta-analysis, we determined that CMS was superior to the previous costimulatory molecule-related model. We also found that the CMS was characterized by distinct inflammatory profiles and specific immune infiltrating lymphocytes. What’s more, the CMS was able to predict the immunotherapy response in patients with LUAD. Therefore, our work describes the systemic landscape of costimulatory molecules based on B7-CD28 and TNF families and highlights the potential underlying clinical applications for the CMS, thereby supporting the development of rationales to guide prognosis management and immunotherapy in patients with LUAD.
Materials and methods
mRNA expression datasets and clinical information
A total of nine public datasets, including 1472 cases with corresponding mRNA expression data and clinical data, were gathered in this study. The training set consisted of data from 502 patients with genetic information (Illumina HiSeq 2000, log2 transformed RSEM normalized read count) and matching OS data from TCGA that were downloaded from the Cancer Genomics Browser of University of California Santa Cruz (UCSC) (https://genomecancer. ucsc.edu).Citation19 Eight other public datasets with mRNA microarray data were collected from GEO datasets with processed series matrix files (http://www.ncbi.nlm.nih.gov/geo), including GSE11969 (n = 91, log10 ratio (Cy5/Cy3) normalized read count),Citation20 GSE13213 (n = 117, log10 ratio (Cy5/Cy3) normalized read count),Citation21 GSE19188 (n = 40, log2 transformed RMA normalized read count),Citation22 GSE30219 (n = 83, log2 transformed RMA normalized read count),Citation23 GSE31210 (n = 226, log2 transformed RMA normalized read count),Citation24 GSE37745 (n = 106, log2 transformed RMA normalized read count),Citation25 GSE41271 (n = 180, log2 transformed RMA normalized read count),Citation26 and GSE50081 (n = 127, log2 transformed RMA normalized read count).Citation27 Moreover, for the genes with one more probe, mean expression values were recognized as the expression data. The clinical characteristics of these patients from multiple institutions are summarized in .
Table 2. Clinical characteristics of the enrolled patients.
RNA extraction and quantitative real-time reverse transcription–PCR
We used 77 surgically resected LUAD tissues, collected from The First Affiliated Hospital of Zhengzhou University between August 2013 and January 2015, as the independent cohort. Then total RNA was extracted from LUAD tissues using the RNAiso Plus reagent (Takara, #9109) according to the manufacturer’s instructions. The first strand of complementary DNA was synthesized from total RNA using the Prime Script™ RT reagent kit (Takara, #RR047A). Quantitative real-time PCR was performed with SYBR Premix Ex Taq II (Takara, #RR820A), and data were analyzed in the Agilent Mx3005P. With the endogenous control for normalization of GAPDH, the expression data of all the selected genes were log2 transformed before signature validation. All the primer sequences in this research are displayed in . All patients were received and signed the informed consents. The samples used in the study were approved by the Institutional Review Boards of the First Affiliated Hospital of Zhengzhou University.
Functional enrichment analysis
After deleting the genes with low expression values (more than half of all genes analyzed had 0 expression), functional enrichment analysis based on CMS related genes were conducted through the Gene Ontology (GO) and Kyoto Encyclopedia of Genes and Genomes (KEGG) in DAVID 6.8 (http://david.abcc.ncifcrf.gov).
Estimated the profiling of immune cell infiltration
The FPKM of mRNAseq data of LUAD from TCGA was used for estimating the fractions of 22 immune cell types in the TME by CIBERSORT.Citation28 The data was not standardized and genes with mean expression 0 were filtered out before submitting to CIBERSORT. The profiling of multiple immune cell types was performed through the leucocyte gene signature matrix, termed LM22, for the CIBERSORT software (http://cibersort.stanford.edu/). LM22 consists of 547 genes that can distinguish 22 immune cells, including different subtypes of B cell types, T cell types, natural killer cells (NKs), plasma cells, and myeloid cell types.
Biomarkers for predicting immunotherapy response
The potential immunotherapy response prediction performance of CMS was estimated with the following biomarkers: tumor mutation burden (TMB), neoantigen, PD-L1 protein expression, and Tumor Immune Dysfunction and Exclusion (TIDE) score. The TMB and neoantigen data of LUAD patients in the TCGA dataset were separated from The Cancer Immunome Atlas (TCIA) (https://tcia.at/home).Citation29 The protein data of PD-L1 expression was realized through the reverse-phase protein array (RPPA) analysis, which was retrieved from cbioPortal (http://www.cbioportal.org). TIDE has been proven to outperform known immunotherapy biomarkers in predicting immunotherapy response in patients with melanoma and lung cancer, especially those treated with ICIs.Citation30 TIDE scores, T cell dysfunction scores, and T cell exclusion scores were download from the TIDE web (http://tide.dfci.harvard.edu) after following the instructions on the website to uploaded input data. All the expression details of these biomarkers used in this research are summarized in .
Signature identification and statistical analysis
A univariate Cox proportional hazards regression analysis and stepwise Cox proportional hazards regression model were used to construct the signature. Then, the CMS was constructed using five selected genes (CD40LG, TNFRSF6B, TNFSF13, TNFRSF13C, and TNFRSF19) with a linear combination of their expression values. These inputs were weighted with the regression coefficients from the stepwise Cox regression analyses. The expression details of the five selected genes and the corresponding risk scores in different public cohorts are displayed in . All the patients in different cohorts were divided into high- and low-risk groups based on the optimal cutoff point, which was determined by the “surv_cutpoint” function of the “survminer” R package. The prognostic significance of the CMS between the high- and low-risk groups in different sets and subgroups were calculated with Kaplan-Meier curves and a 2-tailed log-rank test. The Mann-Whitney U-test was applied to analyze the between-group differences for immune cell fractions and immunotherapy biomarkers. Univariate and multivariate Cox regression analyses were conducted to clarify the independent prognostic factors. P < .05 was considered statistically significant for all statistical methods. STATA software (version 12.0) was used to perform the prognostic meta-analysis of CMS and B7-CD 28 signature. The two overall hazard ratio (HR) values were calculated using the random-effects model. R software version 3.5.1 (https://www.r-project.org) was used for other data analyses.
Results
The panorama and prognostic significance of costimulatory molecule genes in LUAD
A total of 60 costimulatory molecule genes were separated from the TCGA LUAD data, which consisted of 13 well-defined B7-CD28 family costimulatory molecules,Citation13 and 47 TNF family costimulatory molecules (Table 1).Citation16 The relationships of these molecules are shown in . Correlation analysis based on TCGA dataset revealed that most of the costimulatory molecules were highly relevant to others. Then, 502 LUAD patients with 60 costimulatory molecule expression data and matched complement OS information from the TCGA data were used to evaluate the prognostic significance of these candidate genes. Univariate cox proportional hazards regression analysis was conducted, and the results showed that 23 genes were significantly associated with OS (P < .05, ). Among the significant genes, four genes (CD276, LTBR, TNFRSF1A and TNFRSF6B) were confirmed as risky factors with HRs (HR)>1, and 19 genes (CD27, CD28, CD40LG, CD80, CTLA4, EDA2R, ICOS, ICOSLG, LTA, LTB, TNFRSF10C, TNFRSF13B, TNFRSF13C, TNFRSF14, TNFRSF17, TNFRSF19, TNFSF12, TNFSF13 and TNFSF8) were confirmed as protective factors with HR<1.
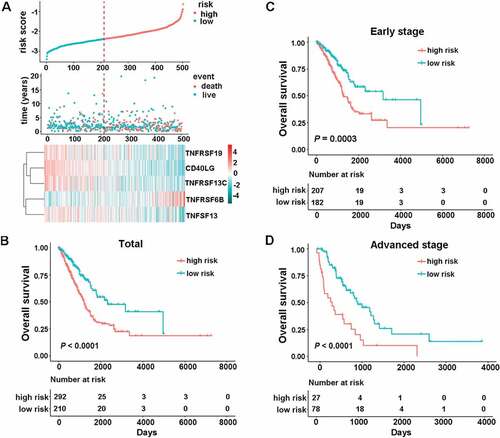
Figure 1. Identification of the CMS in the TCGA dataset. (a) the distribution of risk score, survival status, and the five-gene expression panel. Kaplan-Meier curves were conducted to estimate overall survival for the high- and low-risk groups based on the risk score; (b) total patients with LUAD (c) patients with early-stage (stage I and II) LUAD. (d) patients with advanced-stage (stage III and Ⅳ) LUAD.
Identification of CMS for prognostication
With the tremendous success in the clinical use of ICIs targeting costimulatory factors for lung cancer, we sought to establish CMS for prognostication. A stepwise Cox proportional hazards regression model was then used to filter out the redundant candidate genes and construct a prognostic model. Using the prognostic information of the 502 cases and the corresponding expression details of the 23 significant candidate genes, the stepwise method finally filtered out the combination of the 5 genes. We then developed a risk score formula for patients with LUAD based on the gene’s expression levels to predict patient survival: risk score = (−0.1075× CD40LG) + (0.1418× TNFRSF6B) + (−0.1603× TNFSF13) + (−0.1069× TNFRSF13C) + (−0.0803× TNFRSF19). The expression panel of the five genes, the distribution of risk scores, and survival status of each patient are shown in ). Next, we classified all the patients in the TCGA cohort into high-risk (n = 292) and low-risk groups (n = 210) based on the optimal cutoff point (cutoff value = −2.3834). We found that patients in the high-risk group showed significantly worse OS (), HR 2.0435, 95% confidence interval (CI) 1.4811–2.8195, P < .0001). When we further applied the signature into different clinical stages, the results indicated that the formula still worked well. Specifically, we observed significant OS time between the high- and low-risk groups both for early-stage (stage I and II) (), HR 1.9961, 95% CI 1.3641–2.9210, P = .0003) and advanced stage disease (stage III and Ⅳ) (), HR 2.7529, 95% CI 1.6335–4.6394, P < .0001).
To further explore whether the signature-based risk score was an independent factor in patients with LUAD, univariate, and multivariate Cox regression analyses in the TCGA database were conducted. The results of the multivariate Cox regression model confirmed that the risk score was a significant factor (HR = 1.7952, 95%CI 1.2254–2.6298, P = .0027) independent of age, sex, smoking history, clinical stage, and mutation (MUT) status ().
Table 3. Univariable and multivariable Cox regression analysis of the costimulatory molecule-based signature and survival in TCGA dataset.
Evaluation of the performance of CMS in different clinical subgroups
Sex, age, smoking history, and MUT status were factors that influenced the TME, especially the expression of immune checkpoints. Consequently, patients from TCGA were then divided into different subgroups based on these parameters: sex (male or female), age [older (age ≥ 60) or younger (age<60)], smoking (smoker or nonsmoker), and MUT status [EGFR wide-type (WT), EGFR MUT, KRAS WT, KRAS MUT, or EGFR/KRAS WT]. All the patients in different subgroups were stratified into high- and low- risk groups based on the risk score with the same formula. The results showed that all the high-risk groups had significantly different OS compared to the paired low-risk groups ( and , P < .05).
Figure 2. The association between CMS and overall survival in nine different validation cohorts. Kaplan-Meier curves were created to estimate overall survival for in high- and low-risk groups based on the risk score. (a) GSE11969 (range from −0.0685 to 0.2331); (b) GSE13213 (range from −0.7562 to 0.5577); (c) GSE19188 (range from −0.2603 to 0.3283); (d) GSE30219 (range from −2.5093 to −1.5032); (e) GSE31210 (range from −2.9149 to −1.5841); (f) GSE37745 (range from −2.5732 to −1.6179); (g) GSE41271 (range from −1.8310 to −0.0865); (h) GSE50081 (range from −2.4230 to −1.4792); (i) an independent cohort with qPCR data.
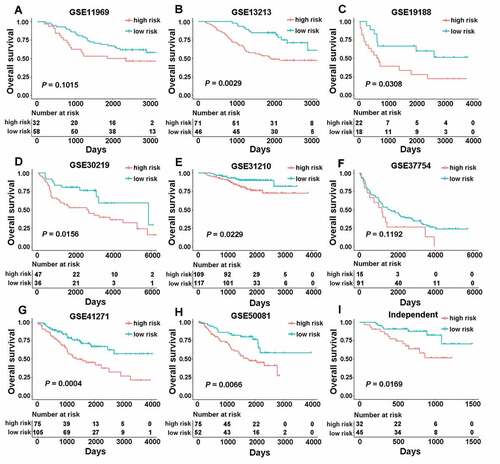
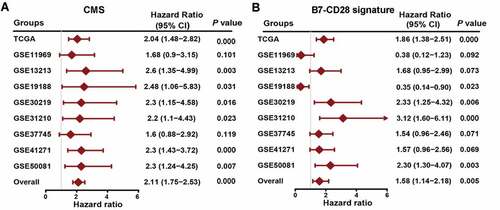
Figure 3. Compare CMS with previous costimulatory molecules signature. (a) a meta‐analysis was performed using the prognostic results of CMS in nine public datasets. (b) a meta‐analysis was performed using the prognostic results of the B7-CD28 signature in nine public datasets.
Validation of the CMS in nine independent cohorts
To identify whether the CMS derived from the TCGA cohort was robust, we first evaluated its performance in eight independent public validation cohorts. These consisted of the remaining GSE11969, GSE13213, GSE19188, GSE30219, GSE31210, GSE37745, GSE41271, and GSE50081 datasets. The CMS stratified all patients from different public cohorts into the high- and low-risk groups using the same formula [risk score = (−0.1075× CD40LG) + (0.1418× TNFRSF6B) + (−0.1603× TNFSF13) + (−0.1069× TNFRSF13C) + (−0.0803× TNFRSF19)] with the optimal cutoff points. As shown in , significant differences between the high- and low-risk groups were found in most of the GEO datasets, including GSE13213 (cutoff value = −0.2261, HR 2.5990, 95% CI 1.3539–4.9890, P = .0029), GSE19188 (cutoff value = −0.0061, HR 2.4817, 95% CI 1.0571–5.8262, P = .0308), GSE30219 (cutoff value = −2.2083, HR 2.2955, 95% CI 1.1495–4.5839, P = .0156), GSE31210 (cutoff value = −2.5365, HR 2.2037, 95% CI 1.0960–4.4308, P = .0229), GSE41271 (cutoff value = −1.0183, HR 2.3023, 95% CI 1.4267–3.7153, P = .0004) and GSE50081 (cutoff value = −2.1254, HR 2.2958, 95% CI 1.2393–4.2530, P = .0066). Meanwhile, in the GSE11969 (cutoff value = 0.0607) and GSE37745 (cutoff value = −2.1263) datasets, the signature showed a borderline difference between the high- and low-risk groups with P values of 0.1015 and 0.1192, respectively ( and f)). The different performance of CMS in different datasets may be caused by the different race or the high spatial heterogeneity of the immune microenvironment.
To further measure whether the signature could be used in clinical practice, we validated the signature in an independent cohort that contained 77 frozen tissue samples with qRT-PCR data. By using the same model [risk score = (−0.1075× CD40LG) + (0.1418× TNFRSF6B) + (−0.1603× TNFSF13) + (−0.1069× TNFRSF13C) + (−0.0803× TNFRSF19)] and the optimal cutoff point (cutoff value = −0.1300), patients were classified into high- (n = 32) and low-risk groups (n = 45). As expected, a significant difference in mortality was found between these two groups (), HR 2.9189, 95% CI 1.1622–7.3309, P = .0169).
Compare the CMS with the previous model
Prior to the creation of our signature, Shanbo Zheng et al. constructed a signature for LUAD based on the costimulatory molecules from the B7-CD28 family (B7-CD28 signature) with a risk score of 0.3313× CD276 – 0.1559× CD28.Citation31 We then comprehensively assessed the prognostic significance of our CMS and the B7-CD28 signature by examining public datasets and conducting prognostic meta-analyses based on the nine groups (n = 1472) of the two different signature groups. As shown in ), our CMS performed very well in the different cohorts, producing HRs larger than 1. On the contrary, the B7-CD28 signature was not that stable in different cohorts and some of the HRs were smaller than 1 ()). More importantly, the meta-analysis combined HR of our CMS was far larger than that of the B7-CD28 signature. These findings indicate that our signature was superior to the previous model.
CMS related biological processes and pathways
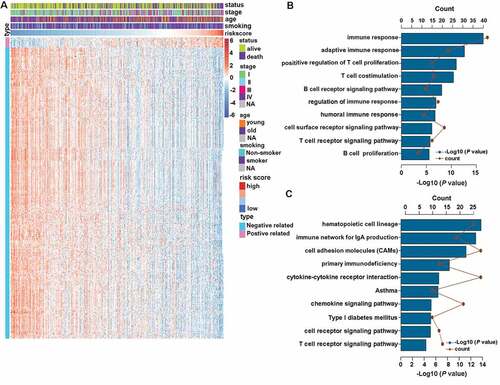
The consistent prognostic performance of the CMS was confirmed in 10 different cohorts. This prompted us to investigate the biological features of patients with different risk scores. We first filtered out 2771 low-expression genes (genes where half or more than half of the values were 0) and then extracted the genes that strongly correlated with risk score (Pearson |R| > 0.45, P < .0001) from the remaining 17759 genes in TCGA dataset. Collectively, 14 positively related genes and 399 negatively related genes were screened out ()). Then, these selected genes were chosen for GO and KEGG analyses through use of the online DAVID tool (https://david.ncifcrf.gov). The results revealed that signature-related genes were more involved in the biological process of the immune response, especially B cell and T cell-related immune response ()). KEGG analysis further confirmed that these genes were closely related to immune-specific pathways ()).
Figure 4. CMS-related biological pathways. (a) the most related genes of TNF family-based signature in patients with LUAD (Pearson |R| > 0.45, P < .0001). (b and c) GO and KEGG analyses of the related genes.
CMS-related immune cell infiltration and inflammatory activities
To further increase our understating of the CMS-related immune landscape, we first explored the relationship between CMS and immune cell infiltration. The estimated fractions of different immune cells in the TME of LUAD were calculated by CIBERSORT, in combination with the LM22. The results demonstrated that the panorama of immune cells between high- and low-risk patients were dramatically different ()). In particular, high-risk patients showed a significantly higher proportion of activated NK cells, activated dendritic cells (DCs), neutrophils, macrophages M0, resting DCs, and regulator T cells (Tregs) ( and c)). On the contrary, low-risk patients featured a high proportion of memory B cells, resting CD4 memory T cells, and gamma delta T cells ( and c)).
Figure 5. CMS-related immune cell infiltration and inflammatory activities. (a) the relative proportion of immune cell expression in high- and low-risk patients. (b and c) differentially expression immune cells in high- and low-risk patients. (d) the details of seven inflammatory metagenes and risk score. (e) correlogram of risk score, and inflammatory metagenes. *, **, ***, and **** represent P < .05, P < .01, P < .001 and P < .0001, respectively.
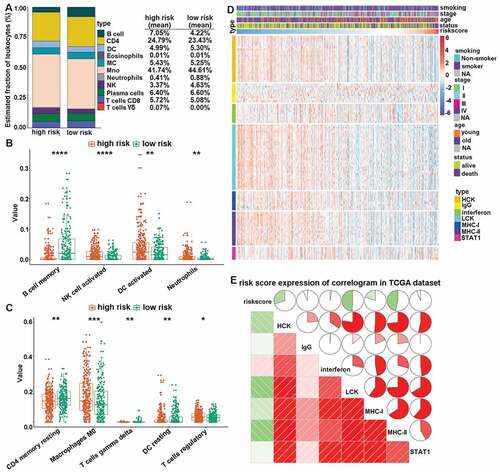
Next, to increase our understanding of CMS-related inflammatory activities, we assessed the relationship between CMS and seven clusters of metagenes. These consisted of 104 genes and represented different inflammation and immune response.Citation32 The expression details of the collected genes and risk scores were displayed in ). Then, to explore the correlation between CMS and the entire metagenes of every cluster, the expression of corresponding gene clusters was calculated by Gene Sets Variation Analysis (GSVA).Citation33 Finally, the correlations were portrayed according to Pearson r-values between risk scores and metagenes ()). The results revealed that CMS was negatively associated with HCK, LCK, MHC-I, and MHC-II. This indicated that patients with high CMS scores were characterized by an immune-suppressive state.
Association of CMS and immunotherapy response in patients with LUAD
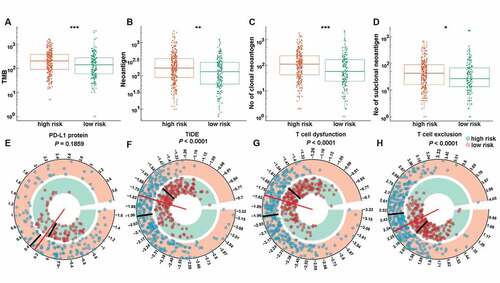
Presently, immunotherapy is considered a first-line treatment for patients with LUAD. Costimulatory molecules are major candidates for immunotherapy. Therefore, we further assessed the association of CMS and immunotherapy response through analyzing the correlation of CMS and widely recognized immunotherapy biomarkers.Citation30 Totally, we enrolled eight indices, including TMB, the number of neoantigens, the number of clonal neoantigens, the number of subclonal neoantigens, the protein level of PD-L1, the TIDE score, the T cell dysfunction score, and the T cell exclusion score, to get a comprehensive evaluation. The results, as depicted in , illustrated that high-risk patients were distinguished by a high level of TMB, neoantigens, protein level of the PD-L1 and T cell exclusion scores, and low level of the TIDE and T cell dysfunction scores. These results indicate that CMS-based high-risk patients may benefit from immunotherapy, especially ICIs.
Figure 6. The expression pattern of immunotherapy response makers in high- and low-risk groups. The distribution of TMB (a), number of neoantigens (b), number of clonal neoantigens (c), number of subclonal neoantigens (d), protein level of PD-L1 (e), TIDE score (f), T cell dysfunction score (g) and T cell exclusion score (h) in high- and low-risk groups. *, **, ***, and **** represent P < .05, P < .01, P < .001 and P < .0001, respectively.
Discussion
There is plenty of evidence pointing out that the immunosuppressive TME exhausts T cells and renders them anergic. This subsequently enables tumor cells to evade host immune-mediated elimination.Citation34 Costimulatory molecules, especially the immune checkpoints, expressed on cancer cells or tumor-infiltrating lymphocytes play vital roles in regulating the anti-tumor immune response. Further, the blocking antibody targeting PD-L1/PD-1 has directly prolonged survival in patients with metastatic cancer.Citation35,Citation36 Presently, the costimulatory molecules mainly consist of two major families: the B7-CD28 family and the TNF family.Citation37 In this study, we simultaneously detected the expression pattern and clinical significance of 60 costimulatory molecules in patients with LUAD. Based on the significant genes, we developed a novel survival prediction model (CMS) based on the expression of five costimulatory molecular features in the TCGA dataset. The CMS score was found as an independent risk factor for patients with LUAD. Furthermore, the CMS was well validated in eight different public GEO datasets and 77 cases from frozen tissues with qRT-PCR data. Interestingly, through prognostic meta-analysis, we proved that our CMS had better prognostic value than the previous costimulatory molecule-related signature. We also explored the immune panorama – including immune cell distribution and inflammatory activities – in CMS high- and low-risk patients. Additionally, we found that the CMS score was positively related to different immunotherapy biomarkers. To our knowledge, this is the first and most comprehensive study to date to describe the prognostic and immunotherapy response prediction value of a CMS in patients with LUAD.
To get the whole picture of costimulatory molecule expression in patients with LUAD, we collected the 13 members from the B7-CD28 family and the 47 members from the TNF family into our analysis.Citation13,Citation16 After the univariate Cox proportional hazards regression analysis and stepwise Cox proportional hazards regression model, we found that all five selected genes (CD40LG, TNFRSF6B, TNFSF13, TNFRSF13C, and TNFRSF19) belonged to the TNF family. This indicated that costimulatory signals and pathways in the TNF family had a more important prognostic value than those in the B7-CD28 family in patients with LUAD. CD40LG – also known as CD40L, TNFSF5, or CD154 – is a membrane-bound protein belonging to the TNFSF family. CD40LG has been a therapy target in cancer treatment because of its ability to trigger Th1-type immune responses.Citation38 The expression and prognostic states of the CD40LG-CD40 axis was previously reported in lung cancer.Citation39 TNFRSF6B, a soluble decoy receptor, is also known as Decoy receptor 3 (DcR3), belongs to the TNFRSF family.Citation40 TNFRSF6B inhibits apoptosis and promotes angiogenesis through binding with FASL, LIGHT, and TL1A.Citation41,Citation42 Moreover, studies found that DcR3 is a potential immunotherapy target for cancer treatment.Citation43 TNFSF13, also known as APRIL and CD256, is a proliferation-inducing ligand that plays an important role in B cell development.Citation44 The clinical significance of TNFSF13 in several cancers was previously revealed and included NSCLC,Citation45 breast cancer,Citation46 B-cell chronic lymphocytic leukemia,Citation47 and other tumor types. TNFRSF13C (BAFFR or CD268), a receptor of BAFF, is a crucial regulatory factor in B cell proliferation, development, and maturation.Citation48 Hong Qin et al. reported that a novel anti-BAFFR antibody may be a promising strategy for drug-resistant B-cell malignancies.Citation49 TNFRSF19, also known as TROY or TAJ, is a member of the TNFRSF family and demonstrates complex and pleiotropic functions in different cellular contexts.Citation50 Present evidence displayed that TNFRSF19 acted as a tumor suppressor in patients with lung cancer.Citation51 Although the expression details of these five members in various cancer types have been described, the combination and functions of these molecules still warrants further exploration.
To verify the robustness of CMS, we reproduce the model in nine different cohorts, and the significance of CMS was finally confirmed by prognosis meta-analysis. It is worth mentioning that the number of validation cohorts in our research was larger than that of any other studies in the LUAD population. This made our signature more reliable and clinically feasible. Before our study, a signature based on the expression of costimulatory molecules from the B7-CD28 family was constructed.Citation31 Through meta-analysis, we obtained two crucial conclusions: the CMS signature had prognostic significance across these public datasets, although some of the P-values were not statistically significant and our CMS model demonstrated an advantage over the reported B7-CD28 model. These conclusions are consistent with our finding that the TNF family has a more important prognostic value for patients with LUAD.
Through analysis, the most related genes of CMS, the potential mechanisms of CMS in LUAD was proved to be closely associated with the immune-related process. Hence, the details of CMS-specific immune profiles were further analyzed. We found that there were higher proportions of DCs, NKs, and Tregs in CMS high-risk patients TME. Simultaneously, inflammatory metagene analysis revealed that CMS score was negatively related to monocyte/myeloid lineage- and T cell-specific functions (HCK and LCK). What’s more, CMS score was also found negatively related to the antigen-presenting process of T cells (MHC-I and MHC-II) in LUAD. Thus, CMS high-risk patients appear to exhibit a high immune cell infiltration microenvironment while in an immune-suppressive state.
Interestingly, this research highlighted the potential role of CMS in predicting the response to immunotherapy in patients with LUAD. Because the immune checkpoint targets (PD-L1 and PD-1) are costimulatory molecules, CMS may have the ability to predict the response to ICIs-based immunotherapy. Due to the lack of details regarding mRNA expression in cases with immunotherapy, we had to evaluate the relationship indirectly. We collected TMB, the number of neoantigens, the protein level of PD-L1, and the TIDE scores. TMB is one of the classic biomarkers for immunotherapy response, and neoantigen burden is always increased by TMB. This will be useful for T cell recognition.Citation52,Citation53 The PD-L1 expression level was another well-known biomarker for ICIs in lung cancer.Citation54 The TIDE score is a newly-developed method for immunotherapy response prediction, and considered a more accurate biomarker than TMB or PD-L1 expression.Citation30 Collectively, high-risk patients exhibited high TMB and PD-L1 expression. From a mechanical standpoint, this resonated with the results of the immune profile analysis. By comparing the CMS scores with these different verified biomarkers, we preliminarily speculate that CMS high-risk patients may be suitable for immunotherapy. These findings give us additional confidence that the CMS scores may act as a novel predictive biomarker for immunotherapy response.
There are some limitations to this study that warrant consideration. Firstly, although we tried our best to include as many independent datasets as possible for validation, this study was retrospective. Secondly, the CMS-specific immune landscape was realized through bioinformatic methods with RNA-seq data. This analysis may have been influenced by noise. Thirdly, because the mRNA expression data from patients with immunotherapy was not available, the prediction ability of CMS for immunotherapy response was estimated indirectly. Future prospective studies could affirm the complete prediction ability and a molecular picture of the CMS signature.
Conclusions
Here, we have performed a first costimulatory molecule landscape analysis in patients with LUAD. We built a reliable, clinically feasible prognostic signature named CMS and identified the potential underlying immune-related mechanisms of this signature. Importantly, the CMS was tightly related to well validated immunotherapy biomarkers. Thus, the CMS could be a clinically useful tool for prognostic management and predicting immunotherapy response in patients with LUAD. Future validation of the predictive capability of this formula will be helpful for patients seeking counseling and individualized treatment.
List of abbreviations
Availability of data and materials
All the GEO cohorts were downloaded for GEO datasets database with processed series matrix files. Specifically, GSE11969 (https://ftp.ncbi.nlm.nih.gov/geo/series/GSE11nnn/GSE11969/matrix/), GSE13213 (https://ftp.ncbi.nlm.nih.gov/geo/series/GSE13nnn/GSE13213/matrix/), GSE19188 (https://ftp.ncbi.nlm.nih.gov/geo/series/GSE19nnn/GSE19188/matrix/), GSE30219 (https://ftp.ncbi.nlm.nih.gov/geo/series/GSE30nnn/GSE30219/matrix/), GSE31210 (https://ftp.ncbi.nlm.nih.gov/geo/series/GSE31nnn/GSE31210/matrix/), GSE37745 (https://ftp.ncbi.nlm.nih.gov/geo/series/GSE37nnn/GSE37745/matrix/), GSE41271 (https://ftp.ncbi.nlm.nih.gov/geo/series/GSE41nnn/GSE41271/matrix/), and GSE50081 (https://ftp.ncbi.nlm.nih.gov/geo/series/GSE50nnn/GSE50081/matrix/). The other data used and/or analyzed during the current study are available from the corresponding author on reasonable request.
Disclosure of Potential Conflicts of Interest
The authors declare that they have no competing interests.
Supplemental Material
Download ()Acknowledgments
All authors would like to thank the specimen donors and research groups for TCGA, GSE11969, GSE13213, GSE19188, GSE30219, GSE31210, GSE37745, GSE41271, and GSE50081 that provided data for this collection.
Supplementary material
Supplemental data for this article can be accessed on the publisher’s website.
Additional information
Funding
References
- Jemal A, Bray F, Center MM, Ferlay J, Ward E, Forman D. Global cancer statistics. CA Cancer J Clin. 2011;61:69–12.
- Bray F, Ferlay J, Soerjomataram I, Siegel RL, Torre LA, Jemal A. Global cancer statistics 2018: GLOBOCAN estimates of incidence and mortality worldwide for 36 cancers in 185 countries. CA Cancer J Clin. 2018;68:394–424.
- Chen Z, Fillmore CM, Hammerman PS, Kim CF, Wong -K-K. Non-small-cell lung cancers: a heterogeneous set of diseases. Nat Rev Cancer. 2014;14(8):535–546. doi:10.1038/nrc3775.
- Herbst RS, Baas P, Kim DW, Felip E, Felip E, Pérez-Gracia JL, Han JY, Molina J, Kim JH, Arvis CD, Ahn MJ. Pembrolizumab versus docetaxel for previously treated, PD-L1-positive, advanced non-small-cell lung cancer (KEYNOTE-010): a randomised controlled trial. Lancet (London, England). 2016;387:1540–1550. doi:10.1016/S0140-6736(15)01281-7.
- Borghaei H, Paz-Ares L, Horn L, Vokes EE, Felip E, Holgado E, Barlesi F, Kohlhaufl M. Nivolumab versus docetaxel in advanced nonsquamous non-small-cell lung Cancer. N Engl J Med. 2015;373:1627–1639. doi:10.1056/NEJMoa1507643.
- Reck M, Rodriguez-Abreu D, Robinson AG, Hui R, Csőszi T, Fülöp A, Gottfried M, Peled N, Tafreshi A, Cuffe S, et al. Pembrolizumab versus chemotherapy for PD-L1–positive non–small-cell lung cancer. N Engl J Med. 2016;375(19):1823–1833. doi:10.1056/NEJMoa1606774.
- Nurieva R, Thomas S, Nguyen T, Martin-Orozco N, Wang Y, Kaja M-K, Yu X-Z, Dong C. T-cell tolerance or function is determined by combinatorial costimulatory signals. Embo J. 2006;25(11):2623–2633. doi:10.1038/sj.emboj.7601146.
- Singh S, Hassan D, Aldawsari HM, Molugulu N, Shukla R, Kesharwani P. Immune checkpoint inhibitors: a promising anticancer therapy. Drug Discov Today. 2020;25(1):223–229. doi:10.1016/j.drudis.2019.11.003.
- Bluestone JA. New perspectives of CD28-B7-mediated T cell costimulation. Immunity. 1995;2:555–559. doi:10.1016/1074-7613(95)90000-4.
- Goronzy JJ, Weyand CM. T-cell co-stimulatory pathways in autoimmunity. Arthritis Res Ther. 2008;10(Suppl 1):S3. doi:10.1186/ar2414.
- Sanmamed MF, Chen L. A paradigm shift in cancer immunotherapy: from enhancement to normalization. Cell. 2019;176:677. doi:10.1016/j.cell.2019.01.008.
- Fife BT, Bluestone JA. Control of peripheral T-cell tolerance and autoimmunity via the CTLA-4 and PD-1 pathways. Immunol Rev. 2008;224:166–182. doi:10.1111/j.1600-065X.2008.00662.x.
- Janakiram M, Chinai JM, Zhao A, Sparano JA, Zang X. HHLA2 and TMIGD2: new immunotherapeutic targets of the B7 and CD28 families. Oncoimmunology. 2015;4:e1026534.
- Zhang C, Zhang Z, Li F, Shen Z, Qiao Y, Li L, Liu S, Song M, Zhao X, Ren F, et al. Large-scale analysis reveals the specific clinical and immune features of B7-H3 in glioma. Oncoimmunology. 2018;7(11):e1461304. doi:10.1080/2162402X.2018.1461304.
- Ward-Kavanagh LK, Lin WW, Sedy JR, Ware C. The TNF receptor superfamily in co-stimulating and co-inhibitory responses. Immunity. 2016;44(5):1005–1019. doi:10.1016/j.immuni.2016.04.019.
- Dostert C, Grusdat M, Letellier E, Brenner D. The TNF family of ligands and receptors: communication modules in the immune system and beyond. Physiol Rev. 2019;99(1):115–160. doi:10.1152/physrev.00045.2017.
- Croft M, Benedict CA, Ware CF. Clinical targeting of the TNF and TNFR superfamilies. Nat Rev Drug Discov. 2013;12(2):147–168. doi:10.1038/nrd3930.
- Schildberg FA, Klein SR, Freeman GJ, Sharpe A. Coinhibitory pathways in the B7-CD28 ligand-receptor family. Immunity. 2016;44(5):955–972. doi:10.1016/j.immuni.2016.05.002.
- Liu J, Lichtenberg T, Hoadley KA, et al. An Integrated TCGA pan-cancer clinical data resource to drive high-quality survival outcome analytics. Cell. 2018;173:400–16.e11.
- Takeuchi T, Tomida S, Yatabe Y, Kosaka T, Osada H, Yanagisawa K, Mitsudomi T, Takahashi T. Expression profile-defined classification of lung adenocarcinoma shows close relationship with underlying major genetic changes and clinicopathologic behaviors. J clin oncol. 2006;24:1679–1688. doi:10.1200/JCO.2005.03.8224.
- Tomida S, Takeuchi T, Shimada Y, Arima C, Matsuo K, Mitsudomi T, Yatabe Y, Takahashi T. Relapse-related molecular signature in lung adenocarcinomas identifies patients with dismal prognosis. J clin oncol. 2009;27(17):2793–2799. doi:10.1200/JCO.2008.19.7053.
- Hou J, Aerts J, den Hamer B, van IJcken W, den Bakker M, Riegman P, van der Leest C, van der Spek P, Foekens JA, Hoogsteden HC, et al. Gene expression-based classification of non-small cell lung carcinomas and survival prediction. PloS One. 2010;5(4):e10312. doi:10.1371/journal.pone.0010312.
- Rousseaux S, Debernardi A, Jacquiau B, Vitte A-L, Vesin A, Nagy-Mignotte H, Moro-Sibilot D, Brichon P-Y, Lantuejoul S, Hainaut P, et al. Ectopic activation of germline and placental genes identifies aggressive metastasis-prone lung cancers. Sci Transl Med. 2013;5(186):186ra66. doi:10.1126/scitranslmed.3005723.
- Okayama H, Kohno T, Ishii Y, Shimada Y, Shiraishi K, Iwakawa R, Furuta K, Tsuta K, Shibata T, Yamamoto S, et al. Identification of genes upregulated in ALK-positive and EGFR/KRAS/ALK-negative lung adenocarcinomas. Cancer Res. 2012;72(1):100–111. doi:10.1158/0008-5472.CAN-11-1403.
- Botling J, Edlund K, Lohr M, Hellwig B, Holmberg L, Lambe M, Berglund A, Ekman S, Bergqvist M, Ponten F, et al. Biomarker discovery in non-small cell lung cancer: integrating gene expression profiling, meta-analysis, and tissue microarray validation. Clin Cancer Res. 2013;19(1):194–204. doi:10.1158/1078-0432.CCR-12-1139.
- Sato M, Larsen JE, Lee W, Sun H, Shames DS, Dalvi MP, Ramirez RD, Tang H, DiMaio JM, Gao B, et al. Human lung epithelial cells progressed to malignancy through specific oncogenic manipulations. Mol Cancer Res. 2013;11(6):638–650. doi:10.1158/1541-7786.MCR-12-0634-T.
- Der SD, Sykes J, Pintilie M, Zhu C-Q, Strumpf D, Liu N, Jurisica I, Shepherd FA, Tsao M-S. Validation of a histology-independent prognostic gene signature for early-stage, non-small-cell lung cancer including stage IA patients. J Thoracic Oncol. 2014;9(1):59–64. doi:10.1097/JTO.0000000000000042.
- Newman AM, Liu CL, Green MR, Mayer C, Efremova M, Rieder D, Hackl H, Trajanoski Z. Robust enumeration of cell subsets from tissue expression profiles. Nat Methods. 2012;72:100–111. doi:10.1038/nmeth.3337.
- Charoentong P, Finotello F, Angelova M, et al. Pan-cancer immunogenomic analyses reveal genotype-immunophenotype relationships and predictors of response to checkpoint blockade. Cell Rep. 2017;18:248–262.
- Jiang P, Gu S, Pan D, Fu J, Sahu A, Hu X, Li Z, Traugh N, Bu X, Li B, et al. Signatures of T cell dysfunction and exclusion predict cancer immunotherapy response. Nat Med. 2018;24(10):1550–1558. doi:10.1038/s41591-018-0136-1.
- Zheng S, Luo X, Dong C, Zheng D, Xie J, Zhuge L, Sun Y, Chen H. A B7-CD28 family based signature demonstrates significantly different prognoses and tumor immune landscapes in lung adenocarcinoma. Int J Cancer. 2018;143(10):2592–2601. doi:10.1002/ijc.31764.
- Rody A, Holtrich U, Pusztai L, Liedtke C, Gaetje R, Ruckhaeberle E, Solbach C, Hanker L, Ahr A, Metzler D, et al. T-cell metagene predicts a favorable prognosis in estrogen receptor-negative and HER2-positive breast cancers. Breast Cancer Res. 2009;11(2):R15. doi:10.1186/bcr2234.
- Hanzelmann S, Castelo R, Guinney J. GSVA: gene set variation analysis for microarray and RNA-seq data. BMC Bioinform. 2013;14(1):7. doi:10.1186/1471-2105-14-7.
- Hanahan D, Weinberg RA. Hallmarks of cancer: the next generation. Cell. 2011;144(5):646–674. doi:10.1016/j.cell.2011.02.013.
- Turley SJ, Cremasco V, Astarita JL. Immunological hallmarks of stromal cells in the tumour microenvironment. Nat Rev Immunol. 2015;15(11):669–682. doi:10.1038/nri3902.
- Topalian SL, Taube JM, Pardoll DM. Neoadjuvant checkpoint blockade for cancer immunotherapy. Science (New York, NY). 2020;367(6477):eaax0182.
- Tang J, Jiang W, Liu D, Luo J, Wu X, Pan Z, Ding P, Li Y. The comprehensive molecular landscape of the immunologic co-stimulator B7 and TNFR ligand receptor families in colorectal cancer: immunotherapeutic implications with microsatellite instability. Oncoimmunology. 2018;7(10):e1488566. doi:10.1080/2162402X.2018.1488566.
- Xu W, Li Y, Yuan WW, Yin Y, Song -W-W, Wang Y, Huang -Q-Q, Zhao W-H, Wu J-Q. Membrane-Bound CD40L promotes senescence and initiates senescence-associated secretory phenotype via NF-kappaB activation in lung adenocarcinoma. Cell Physiol Biochem. 2018;48(4):1793–1803. doi:10.1159/000492352.
- Mu CY, Qin PX, Qu QX, Chen C, Huang JA. Soluble CD40 in plasma and malignant pleural effusion with non-small cell lung cancer: A potential marker of prognosis. Chronic Dis Transl Med. 2015;1:36–41. doi:10.1016/j.cdtm.2015.02.010.
- Lin S, Wu B, Lin Y, Wang M, Zhu Y, Jiang J, Zhang L, Lin J. Expression and clinical significance of decoy receptor 3 in acute-on-chronic liver failure. Biomed Res Int. 2019;2019:9145736. doi:10.1155/2019/9145736.
- Lin WW, Hsieh SL, Herbst RS, Baas P, Kim D-W, Felip E, Pérez-Gracia JL, Han J-Y, Molina J, Kim J-H. Decoy receptor 3: a pleiotropic immunomodulator and biomarker for inflammatory diseases, autoimmune diseases and cancer. Biochem Pharmacol. 2011;81:838–847. doi:10.1016/j.bcp.2011.01.011.
- Yu KY, Kwon B, Ni J, Zhai Y, Ebner R, Kwon BS. A newly identified member of tumor necrosis factor receptor superfamily (TR6) suppresses LIGHT-mediated apoptosis. J Biol Chem. 1999;274:13733–13736.
- Hsieh S-L, Lin -W-W. Decoy receptor 3: an endogenous immunomodulator in cancer growth and inflammatory reactions. J Biomed Sci. 2017;24(1):39. doi:10.1186/s12929-017-0347-7.
- Bossen C, Schneider P. BAFF, APRIL and their receptors: structure, function and signaling. Semin Immunol. 2006;18(5):263–275. doi:10.1016/j.smim.2006.04.006.
- Sun B, Wang H, Wang X, Huang H, Ding W, Jing R, Shi G, Zhu L. A proliferation-inducing ligand: a new biomarker for non-small cell lung cancer. Exp Lung Res. 2009;35(6):486–500. doi:10.1080/01902140902759274.
- Pelekanou V, Kampa M, Kafousi M, Darivianaki K, Sanidas E, Tsiftsis DD, Stathopoulos EN, Tsapis A, Castanas E. Expression of TNF-superfamily members BAFF and APRIL in breast cancer: immunohistochemical study in 52 invasive ductal breast carcinomas. BMC Cancer. 2008;8(1):76. doi:10.1186/1471-2407-8-76.
- Bojarska-Junak A, Hus I, Chocholska S, Wąsik-Szczepanek E, Sieklucka M, Dmoszyńska A, Roliński J. BAFF and APRIL expression in B-cell chronic lymphocytic leukemia: correlation with biological and clinical features. Leuk Res. 2009;33(10):1319–1327. doi:10.1016/j.leukres.2009.03.030.
- Gross JA, Dillon SR, Mudri S, Johnston J, Littau A, Roque R, Rixon M, Schou O, Foley KP, Haugen H, et al. TACI-Ig neutralizes molecules critical for B cell development and autoimmune disease. Impaired B Cell Maturation in Mice Lacking BLyS Immunity. 2001;15:289–302.
- Qin H, Wei G, Sakamaki I, Dong Z, Cheng WA, Smith DL, Wen F, Sun H, Kim K, Cha S, et al. Novel BAFF-receptor antibody to natively folded recombinant protein eliminates drug-resistant human B-cell malignancies in vivo. Clin Cancer Res. 2018;24(5):1114–1123. doi:10.1158/1078-0432.CCR-17-1193.
- Eby MT, Jasmin A, Kumar A, Sharma K, Chaudhary PM. TAJ, a novel member of the tumor necrosis factor receptor family, activates the c-Jun N-terminal kinase pathway and mediates caspase-independent cell death. J Biol Chem. 2000;275(20):15336–15342. doi:10.1074/jbc.275.20.15336.
- Shao L, Zuo X, Yang Y, Zhang Y, Yang N, Shen B, Wang J, Wang X, Li R, Jin G, et al. The inherited variations of a p53-responsive enhancer in 13q12.12. Confer Lung Cancer Risk by Attenuating TNFRSF19 Expression Genome Biology. 2019;20:103.
- Rizvi NA, Hellmann MD, Snyder A, Kvistborg P, Makarov V, Havel JJ, Lee W, Yuan J, Wong P, Ho TS, et al. Cancer immunology. Mutational landscape determines sensitivity to PD-1 blockade in non-small cell lung cancer. Science (New York, NY). 2015;348(6230):124–128. doi:10.1126/science.aaa1348.
- Gong Z, Jia Q, Chen J, Diao X, Gao J, Wang X, Zhu B. Impaired cytolytic activity and loss of clonal neoantigens in elderly patients with lung adenocarcinoma. J Thoracic Oncol. 2019;14(5):857–866. doi:10.1016/j.jtho.2019.01.024.
- Herbst RS, Soria J-C, Kowanetz M, Fine GD, Hamid O, Gordon MS, Sosman JA, McDermott DF, Powderly JD, Gettinger SN, et al. Predictive correlates of response to the anti-PD-L1 antibody MPDL3280A in cancer patients. Nature. 2014;515(7528):563–567. doi:10.1038/nature14011.