
ABSTRACT
Cancer-Testis antigens (CTA) are named after the tissues where they are mainly expressed: in germinal and in cancer cells, a process that mimics many gametogenesis features. Mapping accurately the CTA gene expression signature in myelodysplastic syndromes (MDS) and chronic myelomonocytic leukemia (CMML) is a prerequisite for downstream immune target-discovery projects. In this study, we take advantage of the use of azacitidine to treat high-risk MDS and CMML to draw the CTAs landscape, before and after treatment, using an ad hoc targeted RNA sequencing (RNA-seq) design for this group of low transcript genes. In 19 patients, 196 CTAs were detected at baseline. Azacitidine did not change the number of CTAs expressed, but it significantly increased or decreased expression in nine and five CTAs, respectively. TFDP3 and DDX53, emerged as the main candidates for immunotherapeutic targeting, as they showed three main features: i) a significant derepression on day +28 of cycle one in those patients who achieved complete remission with hypomethylating treatment (FC = 6, p = .008; FC = 2.1, p = .008, respectively), ii) similar dynamics at the protein level to what was observed at the RNA layer, and iii) to elicit significant specific cytotoxic immune responses detected by TFDP3 and DDX53 HLA-A*0201 tetramers. Our study addresses the unmet landscape of CTAs expression in MDS and CMML and revealed a previously unrecognized TFDP3 and DDX53 reactivation, detectable in plasma and able to elicit a specific immune response after one cycle of azacitidine.
Background
Myelodysplastic syndromes (MDS) and chronic myelomonocytic leukemia (CMML) are clonal hematopoietic disorders that compromise the function and number of the blood cells, showing a high rate of progression to acute myeloid leukemia (AML).Citation1 Recent therapeutic and survival advances in lymphoid malignancies have not been paralleled in the myeloid setting, where there is an urgent need for novel and personalized targets.Citation2
Cancer testis antigen (CTA) genes, under normal conditions, are expressed mainly in germ cells, in particular in the testicle, and their expression is highly silenced in normal tissue. Because the testis is an immunologically privileged site, tolerance is not established against CTAs.Citation3 CTAs have been described reactivated in a multitude of cancers and, in addition, their expression appears associated with more aggressive forms of the disease.Citation4–7 Until now, the CTAs expression landscape in MDS and CMML has been drawn in a fragmented fashion, with qPCR experiment measuring a discreet set of candidates chosen, mainly, due to findings in solid cancer.Citation8 Mapping accurately the CTA gene expression signature in MDS and CMML is a prerequisite for downstream target-discovery projects. Global attempts, by means of tag-based sequencing approaches or whole RNA-seq, show either high background level or scarce sensitivity for low transcripts.Citation9,Citation10 Using high throughput technology to sequence selected transcriptome areas has allowed researchers to identify and characterize transcripts whose rare or transient expression is not properly annotated with previous approaches.Citation9,Citation11,Citation12
Fenaux et al., in 2009, first depicted how a drug improved survival in patients with high-risk MDS and CMML. The drug was azacitidine, a chemical analog of cytidine, which exerts its effect through redressing of a dominant pathogenic mechanism in these disorders, hypermethylation.Citation13 Several studies have shown CTAs derepression with the use of demethylating agents; thus, the current use of azacitidine in MDS and CMML represents an unique opportunity to analyze in vivo this phenomenon for potential therapeutic combinatorial strategies.Citation14,Citation15
Motivated by these observations, the main goals of this study were: i) to screen by means of an ad hoc targeted RNA-seq assay for the expression of a comprehensive list of 210 CTAs, before and after treatment with azacitidine, in a cohort of treatment-naïve MDS and CMML patients; ii) to identify those CTAs whose derepression after azacitidine correlates with a better response; iii) to confirm that increase at the proteomic level with an easy to use immunoassay; and iv) to assess a specific cytotoxic immune response against those CTAs with a relevant derepression.
Patients and methods
Patients and samples
Peripheral blood (PB) samples were obtained from 19 patients at diagnosis and on day +28 after the first hypomethylating cycle with azacitidine, between 2015 and 2018. Diagnoses were made according to 2008 and 2017 World Health Organization classification.Citation16,Citation17 In each case, informed consent was obtained in accordance with protocols approved by University Hospital Morales Meseguer Institutional Review Board (C.P. – C.I. EST: 47/15) and with the Declaration of Helsinki. The patients were treated according to the MDS and CMML guidelines of the Spanish group of MDS (GESMD).Citation18 The response criteria were those established by the International Working Group in 2006.Citation19
Azacitidine was administered at a dose of 75 mg/m2 subcutaneously day 1 to 5 and days 8 and 9 (5 + 2 schedule). The cycles were planned each 28 days. For patients without reduced baseline counts prior to first cycle therapy, the next cycle was delayed until counts recovery for a maximum of 14 days or a 50% of the previous dose was scheduled otherwise.
Targeted RNA sequencing (T-RNA-seq)
It was carried out on the Ion Proton ™ platform from Life Technologies on RNA extracted from whole nucleated cells from PB samples on day 0 and +28 of cycle one of azacitidine. In nine patients it was possible to study an additional sample on day +28 of cycle two of azacitidine. The analysis of the quality of the sequences, as well as the mapping and alignment of the readings, was carried out using the Ion Torrent Browser Suite software package. Homo sapiens genome assembly GRCh37 (hg19) was used as a reference genome. On average, we achieved 3.888.308 mapped reads per sample. Libraries were generated using the Ion AmpliSeq ™ RNA Library Kit. Our design included 210 CTAs (supplemental Table 1). Granulomonocytic, lymphoid, and CD34+ myeloid compartments were quantified on the PB samples used for day 0 and +28 targeted RNA-seq, using CD11b-FITC, CD13-PE, CD45-PerCP, and CD34-APC performed on a FACSCanto II (Becton-Dickinson).
DNA targeted sequencing
We designed a TruSeq Custom Amplicon panel (Illumina, Inc. San Diego, CA, USA) including 18 genes recurrently mutated in MDS and CMML. For some genes, known mutation hotspots were targeted; for those with widely dispersed mutations the entire coding sequence was analyzed (supplemental Table 2). The average amplicon size was 151 base pairs and ~99% of the regions were covered on both strands. Paired-end sequencing (2 × 150 bp) was performed with MiSeq v2.2 chemistry, and a mean depth of 997 reads/base within the regions of interest was obtained. The resulting reads were imported into the CLC Genomics Workbench v10 (CLCbio, Arhus, Denmark). The targeted amplicon sequencing workflow was followed for alignment, variant calling, and annotation of filtered mutations.
Immunoblotting assay
Plasma samples from patients were collected by PB centrifugation on day 0 and +28 of cycle one of azacitidine. Dilutions (1/20) were separated using 8–12% sodium dodecyl sulfate polyacrylamide gel electrophoresis (SDS-PAGE). The proteins were transferred to a PVDF membrane using a semi-dry transfer apparatus. Finally, Western blot analysis was conducted by incubating the membrane with the primary antibodies listed in supplemental Table 3 overnight at 4°C. Densitometry analysis was carried out with Image J (https://imagej.nih.gov/ij/). For normalization, Ponceau staining was used.
Enzyme-linked immunosorbent assay (ELISA)
Quantitation of human TFDP3 and DDX53 in patients’ plasma at diagnosis and through treatment was performed using Human transcription factor Dp family, member 3 ELISA Kit and Human Probable ATP-dependent RNA helicase DDX53 ELISA Kit, respectively (MyBiosource, San Diego, USA) following the manufacture’s protocols.
Synthesis of TFDP3/DDX53 HLA-A*0201 tetramers
Regarding TFDP3 and DDX53 proteins, the highest MHC-I-binding affinity peptides were chosen using the IEDB consensus methods.Citation20 HLA-A*02:01, TFDP3-LMWMGMTFGL (LMW295-304), and DDX53-YLMPGFIHL (YLM276-284) peptides were combined to make monomers. HLA-A*0201 containing a biotinylation site and β2-microglobulin were overexpressed in Escherichia coli and purified by fast protein liquid chromatography as previously reported. Purified monomers were biotinylated by BirA ligase and complexed with phycoeritrin (PE)/, yielding TFDP3 and DDX53/HLA-A*0201 tetramers.
Detection and quantification of TFDP3 and DDX53 specific CD8 + T cells
Freshly isolated PB nucleated cells from two HLA-A*0201positive and two HLA-A*0201 negative cases (HLA- A*2426 and HLA-A*0111) were analyzed longitudinally by a 6 colors flow cytometry design. Cells were labeled with anti-CD8-PERCP55, anti-CD4-APC, anti-, anti-CD45-PacificBlue, CD57-FITC, CD3-AmCyan (BD Bioscience), and PE-conjugated tetramers (LMW295-304 or YLM276-284). Cells were analyzed using a FACS Canto II flow cytometer with Paint-A-GatePRO (BD Biosciences, Immunocytometry Systems, San Jose, Ca).
Whole RNA-sequencing (W-RNA-seq)
As a secondary aim of this study, we performed whole RNA-seq on a HiSeq4000 sequencer (Illumina, San Diego, CA, USA) in RNA extracted from PB samples on day 0 and +28 of cycle one of azacitidine from 11 out of 19 patients included in the T-RNA-seq experiments. Trimmed reads were mapped to reference genome hg19 with TopHat, and Cufflinks was used for transcript assembly. Expression profile was calculated for each sample and transcript/gene as fragment per kilobase of transcript per million (FPKM) mapped reads achieving a mean of 106 million reads per sample. Libraries were generated using TruSeq Stranded mRNA Library Prep Kit (Illumina, San Diego, CA, USA).
Statistical analysis
Differential expression between groups was carried out using limma package in R platform. In order to minimize false positives, p values were adjusted by Benjamini–Hochberg multiple comparisons procedure.Citation21 Additional analysis were performed with the Statistical Package for Social Science (SPSS version 21.0, USA) using Student t-test, Mann-Whitney U test, and chi-square test as appropriate. Significance was determined at a two-sided alpha level of 0.05, except for p values in multiple comparisons, for which Bonferroni correction was applied.
Results
Baseline characteristics of the patients
We performed T-RNA-seq on PB samples from 14 MDS and 5 CMML patients on day 0 and on day +28 of cycle one of azacitidine. A detailed description of the clinical and laboratory characteristics is found in supplemental Table 4. The median age at diagnosis was 70 years old in MDS and 74 in CMML. Patients were classified, according to WHO 2017, as CMML-1 (n = 2), CMML-2 (n = 3), MDS with multilineage dysplasia (MLD) (n = 6), MDS with excess of blasts (EB) type 1 (n = 4) and MDS-EB type 2 (n = 4). We used the IPSS-R and CPSS predictive models to assess MDS (Intermediate, n = 4; High, n = 8; and Very High, n = 2) and CMML (Intermediate-1, n = 2 and Intermediate-2, n = 3) patients´ risk, respectively. MDS patients received, on average, 12 cycles of azacitidine, with a dose reduction in three cases and a median follow-up of 16 months. In the CMML group, a mean of 19 azacitidine cycles were administered with a dose reduction in two cases, and a median follow-up of 27 months. The bone marrow and cytogenetic reevaluation of the disease was carried out after the sixth cycle, resulting in five MDS patient with a complete response (CR), four MDS, and five CMML with a partial response (PR), and 2 MDS with a stable disease (SD). In three MDS patients, a disease progression was suspected and confirmed before the scheduled reassessment. We determined, by flow cytometry, the myeloid, monocytic, CD34+ myeloid and lymphoid subsets on the PB samples used for targeted RNA-seq on days 0 and +28 of the first azacytidine cycle. The median percentage represented by the granulomonocytic compartment (81%) was composed of a median of 69% granulocytes, 11% monocytes, and 0,9% myeloid CD34+ cells.
CTAs expression profile at diagnosis in MDS and CMML patients
Although CTAs expression was initially described as restricted to testis tissue, consecutive studies showed that these genes exhibit heterogeneous gene expression profiles, allowing their classification into testis-restricted, testis/brain-restricted, testis-selective that show additional expression in somatic tissues, and not found in testis but expressed in somatic tissues. In addition, it was also revealed that they were often expressed in different types of cancers.Citation7
Studying our T-RNA-seq data in the MDS and CMML cohort, patients were defined by a higher number of CTAs expressed at diagnosis than age-matched controls. A total of 195 CTAs out of the 210 included in T-RNA-seq design, presented expression detected at baseline with, at least, a median of 1 count per million reads (CPM) >1 (Supplemental table 5). In controls, our high throughput low transcript RNA-sequencing detected the expression of 164 CTAs. Supplemental Table 6 shows those CTAs detected in patients but not in controls.
We next classified those CTAs genes detected at diagnosis in T-RNA-seq into Hoffman’s four groups. As only 97 of our 195 detected CTAs were included in their work, those were the CTAs assigned: belonging 22 CTAs to the testis restricted group (21 in X and 1 non-X chromosome), 6 CTAs were classified as testis/brain-restricted (4-X and 2 non-X), 63 CTAs in the testis-selective group (20-X and 43 non-X) and 6 CTAs were classified as not found in testis group (supplemental Figure 1).
When assessing differences between MDS and CMML patients, both entities showed a similar pattern expressing 186 and 187 CTAs at diagnosis, respectively. Nineteen CTAs were differentially expressed reaching statistical significance. Out of the 19, 14 were overexpressed in CMML cases. Strikingly, 8 of these 14 belonged to the MAGE family CTAs (supplemental Table 7).
Azacitidine induces changes at mRNA level in CTAs in MDS and CMML patients
On day+28 of azacytidine, T-RNA-seq was able to detect a similar number of CTAs: 196. One hundred and ninety-one were the same CTAs detected at baseline with five CTAs re-expressed de novo (NOL4, PRM2, RBM46, SPANXN4, and XAGE1C) and four CTAs not detected at this second time point (SPO11, SSX1, THEG, and XAGE3). One hundred and five CTAs raised their expression and eighty-six decreased it.
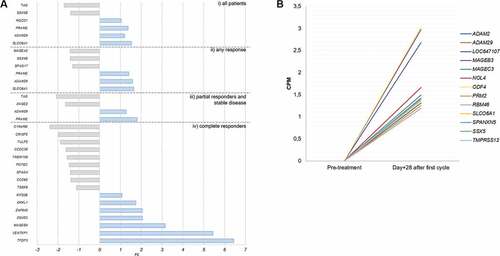
With the aim to determine clinically significant changes in the CTAs expression pattern in our cohort on day +28 after azacitidine, we clustered the patients according to their response to treatment: i) complete responders (CR), partial responders (PR), any type of response (CR+PR) and non-responders (NR), following the criteria established by IW-MD.Citation19 Again, the number of CTAs detected was high pre- and post-azacitidine, both in the responders (171 and 173, respectively) and within the non-responder cohort (175 and 174, respectively). These results promoted us to focus our search for significant differences on the change of expression rather than the raw number of CTAs detected. shows those CTAs which met both a p < .05 and a fold change (FC)> or <1 when contrasting day +28 and day 0 expression of the first azacitidine cycle. Non-responder patients are not represented in the figure as there was no CTA variation which met the established criteria for significance.
Figure 1. CTAs with a statically significant change in expression or reexpressed after one cycle of azacitidine. A) CTAs expressed at baseline that show a significant change after the first cycle of azacitidine, grouped by patients response. B) CTAs that do not detected at diagnosis (CPM <1) but which experience the novo expression in patients who reached CR. The inclusion criteria are those described in the text. i) all patients, ii) in the group with any type of response, iii) in the group of patients with partial response and iv) the group of patients who achieved a complete response.
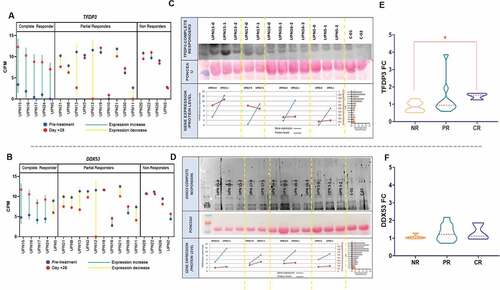
In a quantitative and qualitative approach, both the number of CTAs with a statistically significant increment and the magnitude of that increase were higher on day +28 in the 5 MDS patients who achieved a CR in their reevaluation after the sixth cycle. Specifically, the CTAs that showed the greatest upward modification in these CR patients were: TFDP3, DDX53, and MAGEB4 (). TFDP3 and DDX53 behavior in every CR patient was defined by a low-level expression at diagnosis, followed by a significant increase 28 days after azacitidine (, B). Other potential candidates with significantly re-expression in responders vs. nonresponder were: PRAME, TMPRSS12, and DNAJB8. VENTPX1 was discarded as a suitable candidate for proteomic validation as it is described as a pseudogene.
Figure 2. TFDP3 and DDX53T-RNA derepression in CR patients after one cycle of azacitidine and proteomic validation. Radar charts displaying TFDP3 (a) and DDX53 (b) CPM for each of the T-RNA-seq patients grouped by response. The blue line depicts the expression before treatment and the red line on day +28 of the first azacitidine cycle. (c,d) Upper panel showing western Blot experiment on plasma in 4 out of 5 CR showing dinamics in TFDP3 and DDX53 proteins levels through the course of treatment with azacitidine. For UPN15 and UPN5 plasma was available from pretreatment, cycle 1 + 28 and cycle2 + 28 timepoints; for UPN16 plasma was available from pretreatment, cycle 1 + 28, cycle2 + 28 and cycle3 + 28 timepoints; for UPN17plasma was available from pretreatment and cycle 1 + 28 timepoints. Middle panel: ponceau staining was used for normalization. Bottom panel: pretreatment and cycle 1 + 28 linear representation of protein and gene expression level for UPN15, UPN17, UPN16 and UPN5. (e,f) Violin plots illustrating TFDP3 and DDX53 fold change, by means of ELISA, between cycle 1 + 28 and pretreatment sample in 20 patients including 14 T-RNA-seq cases.
ADAM29 was found to be significantly re-expressed de novo in CR cases, in addition to an increase (FC = 1.28; p = .03) on day +28 in PR patients. Similarly, SLCO6A1 (FC = 1,6; p = .002) was found to be significantly re-expressed in CR patients, in addition to an increase (FC = 1.28; p = .03) on day +28 in patients with any response vs. no responders. Azacitidine CR patients group showed the higher number of CTAs reexpressed on day + 28 ().
TFDP3 and DDX53 plasmatic protein validation and dynamics
We next sought to confirm that the raise in expression of our chosen candidates after azacitidine correlated with an increment at the proteomic level. First, Western blot analysis revealed a correlation between TFDP3 and DDX53 gene expression and the plasmatic protein level change in the CR patients (, D). Conversely, no correlation was found in the Western blot analysis in the case of ADAM29, SLCO6A1, MAGEB4, PRAME, TMPRSS12, and DNAJB8 (data not shown).
Second, as we had been able to detect the proteins in patients’ plasma, we decided to explore whether those findings could be assessed with an easy to use assay, susceptible to be adopted in the clinical routine. Thus, a TFDP3 and DDX53 ELISA allowed us to study a cohort of 20 patients. Fourteen T-RNA-seq patients plus six new patients (1 CMML-CR, 2 MDS-NR, and 3 MDS-PR) were included (supplemental Table 8). PB plasma samples on day 0 (sample 1) and on day +28 (sample 2) of the first cycle were measured. We grouped the patients according to their response to azacitidine: i) CR vs rest, ii) CR vs NR, iii) CR vs PR, iv) CR+PR vs NR. Regarding TFDP3, an increase in its plasmatic levels on day +28 vs. pre-treatment was statistically higher in CR patients in comparisons i) and ii) (1.4 FC vs. 1.1 FC, p = .035 1.4 FC vs. 0.8 FC, p = .03, respectively).Though DDX53 FCs were higher after azacitidine in all groups, in particular in CR patients (1.3 FC), no statistical significance was reached (,F and supplemental Table 9).
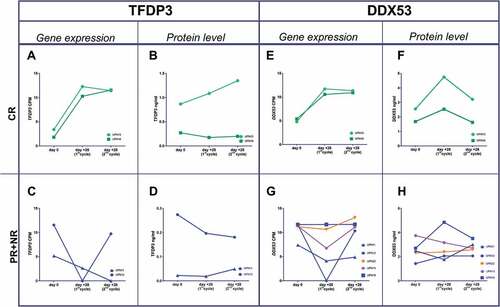
Ideally, the correct timing for using an anti-CTA vaccine in combination with an hypomethylating agent in MDS would be when azacitidine achieves the target derepression peak at the protein level, with the potential for eliciting the strongest immune response. Thus, we sought to assess the longitudinal behavior of TFDP3 and DDX53 after cycle 1 and 2 of azacitidine. In CR cases, both TFDP3 and DDX53 showed the most significant increase in gene expression and protein levels after the first cycle (A,B,E,F); in contrast, PR and NR patients lacked that peak on day +28 (,D,G,H).
Figure 3. Gene expression and protein level dynamics through the first and second azacitidine cycles. Gene expresión as CPMs from T-RNA-seq assay and protein levels as ng/ml from plasma ELISA. a,b) TFDP3 in two CR patients. e,f) DDX53 in two CR patients. c,d) TFDP3 in two PR patient. g,h) in three PR patients (blue line), one nonresponder patient (orange line) and an stable disease patient (purple line).
Azacitidine elicits cytotoxic responses against TFDP3 and DDX53 in MDS patients treated with azacitidine
In the light of our previous results, we decided to confirm that an ex vivo TFDP3-LMWMGMTFGL (LMW295-304) and DDX53-YLMPGFIHL(YLM276-284) CD8 + T cells specific response was detectable in MDS patients. In addition, we quantified that specific response in a longitudinal way with specific tetramers in two HLA-A*0201 patients and two non- HLA-A*0201 patients as controls ( and supplemental Table 10).
Figure 4. Detection and monitoring of TFDP3 and DDX53-specific CD8 + T cells using Class I MHC Tetramers. (a) Dot-plot of TFDP3 (purple) DDX53 (red) assessing the percentages of specific TFDP3 and DDX53 CD8 + T-cell within the CD8+ compartment during the course of treatment in patient who achieved a CR after the six cycle of azacitidine. B. Dot-plot of TFDP3 (purple) DDX53 (red) assessing the percentages of specific TFDP3 and DDX53 CD8 + T-cell within the CD8+ compartment during the course of treatment in patient who achieved a PR after the six cycle of azacitidine. C&D. Specificity of the HLA0201 tetramer was tested by staining PBMCs from two HLA0201 healthy donors at baseline and 2 non-HLA0201 MDS patients (HLA A*24 and HLA A*01) at baseline and after one cycle of azacitidine.
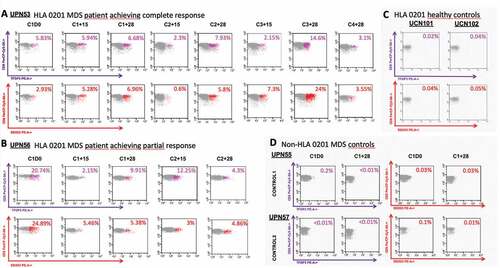
TFDP3 and DDX53-specific CD8 + T cells were detected in our two HLA-A*0201 high-risk MDS patients at diagnosis: UPN53 showed a 5.83% and a 2.93% of total CD3+/CD8+ cells, and UPN56 a 20,74% and a 24,89%, respectively. Conversely, that population was not detected or extremely reduced in the two non- HLA-A*0201 high-risk MDS patients, used as controls: UPN55 showed a 1.3% and a 0.6% of total CD3+/CD8+ cells, and UPN57 a < 0.01% and a 0.2%, respectively.
Serial analysis during hypomethylating treatment of the two HLA-A*0201 MDS cases showed differences in the quantitative and qualitative dynamics of the CD8 + T cells antigen-specific response. In UPN53, a CR patient after six cycles of azacitidine, both specific responses increased from baseline, reaching a peak for both CTAs on C3 + 28, with a proportional reduction on day +15 (nadir) of each cycle. UPN56, a PR patient after six cycles of azacitidine, showed the highest CD8 + T cells TFDP3 and DDX53-specific response at baseline.
To examine the memory phenotype of the TFDP3 and DDX53-specific CD8 + T-cell responses, we costained with CD57. This analysis showed an increased in the CD57+ subpopulation within the CD8+ tetramers-specific response with repeated cycles, showing an accumulation of memory lymphocytes which exceeded the CD57-counterpart on C2 + 28 for both TFDP3 and DDX53 in UPN53. In UPN56, the percentage of CD57+ within the CD8+ tetramers-specific response reached its peak earlier, on day C1 + 15 for DDX53 and on day C1 + 28 for TFDP3 (supplemental Figure 2 and supplemental Table 10).
Cohort somatic recurrent mutations
We performed targeted amplicon sequencing using a panel of 18 genes known to be recurrently mutated in CMML in 16 samples with available DNA (11 MDS and 5 CMML). A total of 30 non-synonymous somatic variants were identified including typical CMML and MDS associated mutations and frequencies: TET2 (total number of mutations = 8, 22.2% cases mutated), ASXL1 (n = 5, 18.5%) SRSF2 (n = 3, 11.1%), RUNX1 (n = 3, 11.1%), TP53(n = 3, 11.1%), NRAS, and IDH1 (n = 2, 7.4%) y SETBP1, JAK2, EZH2, and ZRSR2 (n = 1, 3.7%). No significant differences in clinical responses to azacitidine or in the expression level of TFDP3 and DDX53 on day 0 and on day +28 were found between TET2 mutated and no mutated cases (p > 0,05). No differences were found when comparing TP53 mutated and wild cases. Interestingly, a statistical trend for a higher increase of TFDP3 and DDX53 expression after the first cycle was noted when comparing abnormal versus normal karyotype cases (supplemental Table 11). The limited number of other genes’ mutated cases precluded us for further comparisons.
T-RNA-seq vs W-RNA-seq
In 11 patients, T-RNA and W-RNA-seq were performed in order to compare both approaches. Samples at diagnosis and on day +28 were sequenced. A total of 203 CTA genes could commonly be annotated in both experiments. T-RNA-seq technique was able to detect expression in 181 from 203 CTAs, either on day 0 and/or day +28. In contrast, the global RNA-seq experiment was only able to detect expression levels in 53 CTAs in the same samples. In 16 CTAs, expression was not detected by any technique.
Due to amplicon design issues, we could not include NY-ESO1 in the targeted panel. Data extracted from de W-RNA-seq assay did not show any increase of expression detected on day +28 of azacitidine (0.03 vs.0.03 CPM for CR; 0.1 vs. 0.02 for PR and 0.02 vs. 0.03 for NR patients). However, both at baseline and on day +28, the number of transcripts detected was extremely low.
Discussion
In this study, we take advantage of the use of hypomethylators to treat high-risk MDS and CMML to draw the CTAs landscape, before and after azacitidine, using targeted RNA sequencing directed to this group of low expression transcripts. We have defined the expression pattern of CTAs in MDS and CMML at diagnosis and highlighted the significant increase of expression of two of them, TFDP3 and DDX53 in those patients with a better response to azacitidine. In addition, we confirmed that increase at protein level, the presence of a specific T cytotoxic response against them, and described it through the course of the treatment.
Cancer-Testis antigens are named after the tissues where they are mainly expressed: in germinal and in cancer cells, a process that mimics many gametogenesis features.Citation22 Thus, any gene that exhibits an mRNA expression restricted to the testis and neoplastic cells was termed as a CTA gene. With the advent of more sensitive gene expression techniques, a certain degree of expression was noted in healthy adult tissues; thus, a new and less stringent definition was coined for CTAs (genes with a dominant testicular expression) and a subclassification developed: testis restricted, testis/brain-restricted, testis-selective, and not found in testis.Citation23 With over 200 CTAs annotated and many more candidates identified, it has become increasingly challenging to identify immunogenic or functionally relevant CTAs suitable for cancer vaccine development and/or biomarkers. In our experiment, considering a threshold for a detected expression as an average of CPM ≥ 1, we found that, out of 210 CTAs included in the design, 195 and 196 were expressed at baseline in MDS and CMML, respectively. Twenty-eight days after administering a first dose of azacitidine, we found a statistically significant increase or decrease in nine and five genes, respectively. It has already been suggested previously that, for some CTAs, the degree of methylation may not be its main regulatory mechanism. In fact, some CTAs show an even more restricted expression pattern, tumor type-specific, suggesting that they require the presence of tumor-characteristic transcription factors in addition to demethylation of the promoters to drive expression.Citation24,Citation25 Hybrid, global and targeted, individual cell assays may be of help to elucidate the true weight of methylation in each CTA expression dynamics.Citation26 In addition, having whole transcriptome RNA-seq data in 11 T-RNA-seq cases allowed us to compare, as a secondary aim of the work, this technology with our targeted panel of CTAs. In 81% of genes not expressed in the global RNA-seq experiment, we found a relevant expression when using the directed approach, confirming the latter as the most suitable next generation sequencing (NGS) technique for low transcripts detection.
TFDP3 and DDX53, both CTAs associated to the X chromosome, emerged as the main candidates for immunotherapeutic targeting, as they showed, according to our results, three requirements: i) significant derepression in those patients who achieved CR with hypomethylating treatment, ii) similar dynamics at the protein level to what was observed at the RNA level, and iii) to elicit significant specific cytotoxic immune responses. Previous studies have demonstrated how TFDP3 is expressed in germ tissue and in certain tumors, including brain, esophagus, breast, and melanoma.Citation27–29 In addition, its role in the cell has also been partially defined, behaving as an inhibitor of E2F1, a regulator, in turn, of the mechanisms of apoptosis and cell proliferation, dependent on TP53.Citation30 The CTA DDX53, also called CAGE, has been attributed the role of promoting tumor angiogenesis in the embryonic period and also during oncogenesis. The expression of this gene has been described in gastric and endometrial cancer and its absence has been reported in leukemia cell lines.Citation31 This gene encodes a protein with a DEAD box domain, which suggests that it has RNA helicase activity. Experiments in which recombinant DDX53 was added to the culture medium of endothelial cells showed an increase in their capacity of invasion. The protein is located mainly in the nucleus, but recent data indicate that it can be secreted into the extracellular space.Citation32 We have confirmed in this work its presence in plasma samples. In addition, DDX53 is considered a gene absolutely restricted to germline or tumor tissue, which makes it even more promising in terms of its immunogenic potential. The final aim of our line of research would be to target those azacitidine-derepressed CTAs with immunotherapy. Ideally, the correct timing for combination would be when azacitidine derepression peak is manifested at the protein level, with the potential for eliciting the strongest immune response. In our work, the increase of TFDP3 and DDX53 in plasma was reached after only one cycle of azacytidine in CR patients. This finding would mean a significant advantage for therapeutic purposes as they suggest that the correct timing for combination with an anti-CTA vaccine would be early during the azacitidine treatment.
Interest on CTAs relies, in the therapeutic setting, on their capacity to trigger a significant immune response. To be significant in the clinical setting, it is likely that frequencies of antigen-specific T-cells need to reach over 1% of circulating CD8 T-cells.Citation33 Very recently Griffiths et al. showed that an HLA unrestricted NY-ESO-1 vaccine was able to induce an antigen specific immune response in MDS cases.Citation34 The robust immune responses against DDX53 and TFDP3 showed by two patients with high-risk MDS provides a building block for considering further steps in the development of CTAs-based vaccination. In addition, the longitudinal study allowed us to delineate that specific cytotoxic response dynamics: with a repetitive variation through the first cycles: reaching its maximum on day +28 and its minimum on day +15. One could speculate that, as the weakest immune response are found at each cytopenic nadir, the reduction of myeloid MDS cells in PB determines less CTA protein circulating and less capacity to provoke the cytotoxic response. The physiological specific response to derepressed TFDP3 and DDX53 reached its peak after three cycles in the CR patient and after one cycle for TFDP3 in the PR patient. In the latter no increase in the specific response was observed for TFDP3 from baseline. Our CR patient whose specific CD8 + T cell tetramer response was assessed, follows the same longitudinal pattern described in the longitudinal T-RNA-seq CR patients TFDP3 and DDX53 gene expression: very low levels at baseline and a significant increase after one cycle. Besides, costaining with CD57 allowed us to described how TFDP3 and DDX53-specific memory CD8+/CD57+ cells accumulated through cycles of azacitidine suggesting an exhaustion of this physiological response. Regarding a potential priming of this response, current clinical trials involving the use of vaccines directed against CTAs have evolved substantially in their design compared to a decade ago, both in the discovery and synthesis of peptides and in the formulation of vaccines. The use of customized peptides, bacterial vectors, or combined treatment, both with mTOR inhibitors and demethylating agents, is now available.Citation35 In addition, the generation of dendritic cells ex vivo and their loading with CTAs has successfully improved the anti-cancer immunity in patients.Citation36 However, the prominent positioning of the immunotherapy in the treatment of cancer in the last decade has been prompted by the genetic engineering of T lymphocytes. Regarding CTAs, T lymphocytes modified against specific epitopes of NY-ESO-1 have been shown to improve clinical responses and overall survival in patients with refractory melanoma and synovial sarcoma.Citation37,Citation38 At present, a clinical trial has been launched, recruiting patients with AML and MDS to be treated with modified T lymphocytes against PRAME and NY-ESO-1. (NCT02494167 H-36346).
Three are the main limitations of our study. First, the T-RNA-seq design did not allow us to include NY-ESO-1 in the panel. NY-ESO-1, PRAME, and the MAGE family are those CTAs against which cytotoxic T cells mediated immune responses have been documented in hematological malignancies.Citation4,Citation15 We did not find a significance change in NY-ESO-1 levels after one cycle of azacitidine using data from our 11 patients with a longitudinal whole RNA-seq analysis. However, as we have shown in this study, the scarce sensitivity of this NGS technique for low transcripts together with the lower number of patients preclude us of reaching robust conclusions about NY-ESO-1 dynamics. Second, the number of patients followed with T-RNA-seq longitudinally (n = 19) and those whose HLA typing made them suitable for the tetramer specific assay (n = 2) are only enough to postulate TFDP3 and DDX53 fold change levels after one cycle of azacitidine as response biomarkers and to confirm the existence of a relevant specific response, but not for establishing definitively the specific CD8 + T-cell dynamics. The inclusion of high-grade disease (where azacitidine is approved) and CMML cases explains, in part, that the unfractionated PB samples used for CTAs targeted RNA-seq were composed mainly by the granulomonocytic compartment (81%), but we acknowledge the potential bias of the RNA amount from the lymphoid subset as a limitation of our work.
Conclusions
In summary, the prospective nature of patient recruitment and clinical events annotation, and the use of an ad hoc high-throughput RNA-Seq experiment allowed us to reach translational outcome-driven associations within a comprehensive CTA list. Our study addressed the unmet landscape of CTAs expression in MDS and CMML and revealed a previously unrecognized increase of TFDP3 and DDX53 mRNA and protein levels following one azacitidine cycle in MDS and CMML. An increase that elicited a specific cytotoxic response against MDS cells which TFDP3 and DDX53 peptides, pointing us toward a new combinatorial immunotherapeutic approach to explore in these patients.
Disclosure of Potential Conflicts of Interest
No potential conflicts of interest were disclosed.
Author contributions
Contribution: A.M.H.L., T.Z.CH., M.Z., N.NV., R.C., A.I.A, and R.T. performed experiments; A.M.H.L., J.P., I.C., and A.J. analyzed results; A.M.H.L and A.J. designed the research and wrote the paper; E.J.S., V.B., B.M., ML.A., and V.V. provided clinical data and samples; A.M.H.L., T.H.CL., M.Z., J.P., E.J.S., V.B., B.M., ML.A., N.NV., R.C., I.C., A.I.A., R.T., M.M., V.V., and A.J. gathered data, edited, and approved the final manuscript.
Availability of data and materials
The RNA-seq datasets supporting the conclusions of this article are accessible through accession number GSE102312. For further information on original data, contact the Corresponding Author.
Competing interests
The authors declare that they have no competing interests.
Ethics approval
Informed consent was obtained in accordance with protocols approved by University Hospital Morales Meseguer Institutional Review Board (C.P. - C.I. EST: 47/15) and with the Declaration of Helsinki.
Abbreviations
CPM counts per million reads
CR complete response
CR+PR any type of response; CTA: Cancer-Testis antigens
ELISA Enzyme-linked immunosorbent assay
FC fold change
FPKM fragment per kilobase of transcript per million
GESMD Spanish group of MDS
MDS Myelodysplastic syndromes
MDS-EB MDS with excess of blasts
MLD MDS with multilineage dysplasia
NGS next generation sequencing
NR non-responders
PB Peripheral blood
PR partial response
RNA-seq RNA sequencing
SD stable disease
SDS-PAGE sodium dodecyl sulfate polyacrylamide gel electrophoresis
SPSS Statistical Package for Social Science
T-RNA-seq Targeted RNA sequencing
W-RNA-seq Whole RNA-sequencing
Supplemental Material
Download ()Supplementary materials
Supplemental data for this article can be accessed on the publisher's website.
Additional information
Funding
References
- Arber DA, Orazi A, Hasserjian R, Thiele J, Borowitz MJ, Le Beau MM, Bloomfield CD, Cazzola M, Vardiman JW. The 2016 revision to the World Health Organization classification of myeloid neoplasms and acute leukemia. Blood. 2016 May;127(20):2391–9. doi:10.1182/blood-2016-03-643544.
- Platzbecker U. Treatment of MDS. Blood. 2019 Mar;133(10):1096–1107. doi:10.1182/blood-2018-10-844696.
- Bart J, Groen HJM, van der Graaf WTA, Hollema H, Hendrikse NH, Vaalburg W, Sleijfer DT, de Vries EG. An oncological view on the blood-testis barrier. Lancet Oncol. 2002 Jun;3(6):357–363. doi:10.1016/S1470-2045(02)00776-3.
- Nishikawa H, Maeda Y, Ishida T, Gnjatic S, Sato E, Mori F, Sugiyama D, Ito A, Fukumori Y, Utsunomiya A, et al. Cancer/testis antigens are novel targets of immunotherapy for adult T-cell leukemia/lymphoma. Blood. 2012 Mar;119(13):3097–3104. doi:10.1182/blood-2011-09-379982.
- Rezvani K, Yong ASM, Tawab A, Jafarpour B, Eniafe R, Mielke S, Savani BN, Keyvanfar K, Li Y, Kurlander R, et al. Ex vivo characterization of polyclonal memory CD8+ T-cell responses to PRAME-specific peptides in patients with acute lymphoblastic leukemia and acute and chronic myeloid leukemia. Blood. 2009 Mar;113(10):2245–2255. doi:10.1182/blood-2008-03-144071.
- Goodyear O, Piper K, Khan N, Starczynski J, Mahendra P, Pratt G, Moss P. CD8+T cells specific for cancer germline gene antigens are found in many patients with multiple myeloma, and their frequency correlates with disease burden. Blood. 2005 Dec;106(13):4217–4224. doi:10.1182/blood-2005-02-0563.
- Wang C, Gu Y, Zhang K, Xie K, Zhu M, Dai N, Jiang Y, Guo X, Liu M, Dai J, et al. Systematic identification of genes with a cancer-testis expression pattern in 19 cancer types. Nat Commun. 2016 Jan;7(1):10499. doi:10.1038/ncomms10499.
- Jungbluth AA, Chen Y-T, Stockert E, Busam KJ, Kolb D, Iversen K, Coplan K, Williamson B, Altorki N, Old LJ, et al. Immunohistochemical analysis of NY-ESO-1 antigen expression in normal and malignant human tissues. Int J Cancer. 2001 Jun;92(6):856–860. doi:10.1002/ijc.1282.
- Mercer TR, Clark MB, Crawford J, Brunck ME, Gerhardt DJ, Taft RJ, Nielsen LK, Dinger ME, Mattick JS. Targeted sequencing for gene discovery and quantification using RNA CaptureSeq. Nat Protoc. 2014 May;9(5):989–1009. doi:10.1038/nprot.2014.058.
- Wang Z, Gerstein M, Snyder M. RNA-Seq: a revolutionary tool for transcriptomics. Nat Rev Genet. 2009 Jan;10(1):57–63. NIH Public Access. doi:10.1038/nrg2484.
- Mercer TR, Gerhardt DJ, Dinger ME, Crawford J, Trapnell C, Jeddeloh JA, Mattick JS, Rinn JL. Targeted RNA sequencing reveals the deep complexity of the human transcriptome. Nat Biotechnol. 2012 Jan;30(1):99–104. Nature Publishing Group. doi:10.1038/nbt.2024.
- Hart T, Komori H, LaMere S, Podshivalova K, Salomon DR. Finding the active genes in deep RNA-seq gene expression studies. BMC Genomics. 2013 Nov;14(1):778. doi:10.1186/1471-2164-14-778.
- Fenaux P, Mufti GJ, Hellstrom-Lindberg E, Santini V, Finelli C, Giagounidis A, Schoch R, Gattermann N, Sanz G, List A, et al. Efficacy of azacitidine compared with that of conventional care regimens in the treatment of higher-risk myelodysplastic syndromes: a randomised, open-label, phase III study. Lancet Oncol. 2009 Mar;10(3):223–232. doi:10.1016/S1470-2045(09)70003-8.
- Almstedt M, Blagitko-Dorfs N, Duque-Afonso J, Karbach J, Pfeifer D, Jäger E, Lübbert M. The DNA demethylating agent 5-aza-2′-deoxycytidine induces expression of NY-ESO-1 and other cancer/testis antigens in myeloid leukemia cells. Leuk Res. 2010 Jul;34(7):899–905. doi:10.1016/j.leukres.2010.02.004.
- Goodyear O, Agathanggelou A, Novitzky-Basso I, Siddique S, McSkeane T, Ryan G, Vyas P, Cavenagh J, Stankovic T, Moss P, et al. Induction of a CD8+ T-cell response to the MAGE cancer testis antigen by combined treatment with azacitidine and sodium valproate in patients with acute myeloid leukemia and myelodysplasia. Blood. 2010 Sep;116(11):1908–1918. doi:10.1182/blood-2009-11-249474.
- Vardiman JW, Thiele J, Arber DA, Brunning RD, Borowitz MJ, Porwit A, Harris NL, Le Beau MM, Hellström-Lindberg E, Tefferi A, et al. The 2008 revision of the World Health Organization (WHO) classification of myeloid neoplasms and acute leukemia: rationale and important changes. Blood. 2009 Jul;114(5), 937–951.
- Arber DA, Orazi A, Hasserjian R, Thiele J, Borowitz MJ, Le Beau MM, Bloomfield CD, Cazzola M, Vardiman JW. The 2016 revision to the World Health Organization classification of myeloid neoplasms and acute leukemia. Blood. 2016 May;127(20), 2391–2405.
- GESMD. Guías españolas de diagnóstico y tratamiento de los síndromes mielodisplásicos y la leucemia mielomonocítica crónica Grupo Español de Síndromes Mielodisplásicos (GESMD). Haematologica. 2012;97(Suppl. 5).
- Cheson BD, Greenberg PL, Bennett JM, Lowenberg B, Wijermans PW, Nimer SD, Pinto A, Beran M, de Witte TM, Stone RM, et al. Clinical application and proposal for modification of the International Working Group (IWG) response criteria in myelodysplasia. Blood. 2006 Jul;108(2):419–425. doi:10.1182/blood-2005-10-4149.
- Moutaftsi M, Peters B, Pasquetto V, Tscharke DC, Sidney J, Bui -H-H, Grey H, Sette A. A consensus epitope prediction approach identifies the breadth of murine T(CD8+)-cell responses to vaccinia virus. Nat Biotechnol. 2006 Jul;24(7):817–819. doi:10.1038/nbt1215.
- Benjamini Y, Hochberg Y. Controlling the False Discovery Rate: A Practical and Powerful Approach to Multiple Testing. Journal of the Royal Statistical Society: Series B (Methodological). 1995;57(1):289–300. WileyRoyal Statistical Society. doi:10.1111/j.2517-6161.1995.tb02031.x.
- Simpson AJG, Caballero OL, Jungbluth A, Chen YT, Old LJ. Cancer/testis antigens, gametogenesis and cancer. Nat Rev Cancer. 2005;5(8):615–625. doi:10.1038/nrc1669.
- Hofmann O, Caballero OL, Stevenson BJ, Chen Y-T, Cohen T, Chua R, Maher CA, Panji S, Schaefer U, Kruger A, et al. Genome-wide analysis of cancer/testis gene expression. Proc Natl Acad Sci. 2008 Dec;105(51), 20422–20427.
- Loriot A, Boon T, De Smet C. Five new human cancer-germline genes identified among 12 genes expressed in spermatogonia. Int J Cancer. 2003 Jun;105(3):371–376. doi:10.1002/ijc.11104.
- Grunwald C, Koslowski M, Arsiray T, Dhaene K, Praet M, Victor A, Morresi-Hauf A, Lindner M, Passlick B, Lehr H-A, et al. Expression of multiple epigenetically regulated cancer/germline genes in nonsmall cell lung cancer. Int J Cancer. 2006 May;118(10):2522–2528. doi:10.1002/ijc.21669.
- Gkountela S, Castro-Giner F, Szczerba BM, Vetter M, Landin J, Scherrer R, Krol I, Scheidmann MC, Beisel C, Stirnimann CU, et al. Circulating tumor cell clustering shapes DNA methylation to enable metastasis seeding. Cell. 2019;176(1–2):98–112.e14. doi:10.1016/j.cell.2018.11.046.
- Wang Y, Han KJ, Pang XW, Vaughan HA, Qu W, Dong XY, Peng J-R, Zhao H-T, Rui J-A, Leng X-S, et al. Large scale identification of human hepatocellular carcinoma-associated antigens by autoantibodies. J Immunol. 2002;169(2):1102–1109. doi:10.4049/jimmunol.169.2.1102.
- Ma Y, Xin Y, Li R, Wang Z, Yue Q, Xiao F, Hao X. TFDP3 was expressed in coordination with E2F1 to inhibit E2F1-mediated apoptosis in prostate cancer. Gene. 2014;537(2):253–259. doi:10.1016/j.gene.2013.12.051.
- Yin K, Liu Y, Chu M, Wang Y. TFDP3 regulates epithelial-mesenchymal transition in breast cancer. PLoS One. 2017;12(1):e0170573. doi:10.1371/journal.pone.0170573.
- Ingram L, Munro S, Coutts AS, La Thangue NB. E2F-1 regulation by an unusual DNA damage-responsive DP partner subunit. Cell Death Differ. 2011;18(1):122–132. doi:10.1038/cdd.2010.70.
- Cho B, Lim Y, Lee DY, Park SY, Lee H, Jeoung D Il, Yang H, Bang Y-J, Jeoung D-I. Identification and characterization of a novel cancer/testis antigen gene CAGE. Biochem Biophys Res Commun. 2002;292(3):715–726. doi:10.1006/bbrc.2002.6701.
- Kim Y, Park D, Kim H, Choi M, Lee H, Lee YS, Choe J, Kim YM, Jeoung D. MiR-200b and cancer/testis antigen cage form a feedback loop to regulate the invasion and tumorigenic and angiogenic responses of a cancer cell line to microtubule-Targeting drugs. J Biol Chem. 2013;288(51):36502–36518. doi:10.1074/jbc.M113.502047.
- Baumgaertner P, Rufer N, Devevre E, Derre L, Rimoldi D, Geldhof C, Voelter V, Liénard D, Romero P, Speiser DE, et al. Ex vivo detectable human CD8 T-cell responses to cancer-testis antigens. Cancer Res. 2006;66(4):1912–1918. doi:10.1158/0008-5472.CAN-05-3793.
- Griffiths EA, Srivastava P, Matsuzaki J, Brumberger Z, Wang ES, Kocent J, Miller A, Roloff GW, Wong HY, Paluch BE, et al. NY-ESO-1 vaccination in combination with decitabine induces antigen-specific T-lymphocyte responses in patients with myelodysplastic syndrome. Clin Cancer Res. 2018;24(5):1019–1029. NIH Public Access.
- Thomas R, Al-Khadairi G, Roelands J, Hendrickx W, Dermime S, Bedognetti D, Decock J. NY-ESO-1 based immunotherapy of cancer: current perspectives. Front Immunol. 2018;9. doi:10.3389/fimmu.2018.00947.
- Sabado RL, Bhardwaj N. Cancer immunotherapy: dendritic-cell vaccines on the move. Nature. 2015;519(7543):300–301. doi:10.1038/nature14211.
- Robbins PF, Morgan RA, Feldman SA, Yang JC, Sherry RM, Dudley ME, Wunderlich JR, Nahvi AV, Helman LJ, Mackall CL, et al. Tumor regression in patients with metastatic synovial cell sarcoma and melanoma using genetically engineered lymphocytes reactive with NY-ESO-1. J Clin Oncol. 2011;29(7):917–924. doi:10.1200/JCO.2010.32.2537.
- Robbins PF, Kassim SH, Tran TLN, Crystal JS, Morgan RA, Feldman SA, Yang JC, Dudley ME, Wunderlich JR, Sherry RM, et al. A pilot trial using lymphocytes genetically engineered with an NY-ESO-1-reactive T-cell receptor: long-term follow-up and correlates with response. Clin Cancer Res. 2015;21(5):1019–1027. doi:10.1158/1078-0432.CCR-14-2708.