
ABSTRACT
TNM stage is not enough to accurately predict the prognosis of patients with non-small cell lung cancer (NSCLC). This study aimed to establish the immunological score (IS) in lung adenocarcinoma (LUAD) and lung squamous cell carcinoma (LUSC), separately, and propose a new staging system in NSCLC. We used the multiplex fluorescent immunohistochemistry (mIHC) technology to detect 17 immune biomarkers of 304 patients with NSCLC. The LASSO-COX regression model was used to establish the ISNSCLC in the training cohorts. The ISNSCLC was then validated in the validation cohort. The constructed ISLUAD contained three immune features: CD4+CD73+core of tumor (CT), PD-L1+CT, and IDO+invasive margin (IM). ISLUSC also contained two immune features: CD8+CD39−CD73−CT, CD8+Tim-3+IM. In the training cohort, significant prognostic differences were found upon comparing low-ISNSCLC patients with high-ISNSCLC patients. For LUAD, the 5-y disease-free survival (DFS) rates were 54.7% vs. 8.1% and the 5-y overall survival (OS) rates were 82.4% vs. 36% (all P< .0001). For LUSC, the 5-y DFS rates were 74.0% vs. 14.7% and the 5-y OS rates were 78.2% vs. 17.6% (all P< .0001). Multivariate analyses indicated that ISNSCLC was an independent indicator for prognosis. Finally, we combined ISNSCLC with clinicopathological factors to establish a TN-I staging system and two nomogram models for clinical use. The TN-I stage had better prediction accuracy than TNM stage. The newly established ISLUAD and ISLUSC were completely different, and both were excellent indicators for the prognostic prediction. The TN-I stage could effectively improve prognostic accuracy and facilitate clinical application.
Abbreviations
NSCLC, non-small cell lung cancer; IS, immunological score; mIHC, multiplex fluorescent immunohistochemistry; LUAD, lung adenocarcinoma; LUSC, lung squamous cell carcinoma; CT, core of tumor; IM, invasive margin; DFS, disease-free survival; OS, overall survival; SITC, the Society for Immunotherapy of Cancer; FFPE, formalin-fixed paraffin-embedded; MWT, microwave treatment; DCA, decision curve analysis; ROC, receiver operating characteristic; AUC, area under the curve; EGFR, epidermal growth factor receptor.
Introduction
Non-small cell lung cancer (NSCLC) is one of the deadliest human malignant tumors and the leading cause of global death from cancers.Citation1,Citation2 The two predominant histological phenotypes of NSCLC are lung adenocarcinoma (LUAD; ~50%) and lung squamous cell carcinoma (LUSC; ~40%).Citation3,Citation4 Typically, LUADs arise from distal airways, whereas LUSCs are associated with the more proximal airways. LUSCs usually have a stronger correlation with smoking and inflammatory diseases compared with LUADs, Citation3,Citation4 and should be regarded as distinctly different diseases from the aspect of biopathology, therapeutic stratification, and therapeutic effect.Citation5
The current tumor-node-metastasis (TNM) staging system is the most acknowledged clinicopathological factor for prognostication and therapy determination of NSCLC. However, the survival outcomes of patients with an equal stage and similar treatment options vary widely.Citation6 In some advanced patients, the cancer can remain stable for a long time, and a small number of patients even have spontaneous regression of metastatic tumors. Conversely, even after undergoing R0 resection and without evidence of tumor residual or metastasis, about 25% of patients with stage I/II tumors experienced rapid tumor progression or death.Citation6 These phenomena suggest that the information provided by the NSCLC TNM staging system is insufficient for prognostication. Therefore, it is necessary to adopt new strategies for improved survival prediction and treatment stratification. A retrospective study established a three-class risk model based on clinicopathological factors (age, T stage, nodes, and grading) and its nomogram in resected LUSC, which had a good prognostic accuracy (0.67 for DFS), provided a practical tool for evaluating the prognosis of patients with LUSC.Citation7 Next, the researchers conducted an external multicenter validation which confirmed the wide applicability and reliability of this prognostic model, and found that adjuvant/neoadjuvant treatment seems to be more beneficial for intermediate/high-risk patients.Citation8 In addition, it has been recognized that tumor-infiltrating immune cells play a pivotal role in tumor progression depending on the density and location of various immune cell subpopulations.Citation9,Citation10 The heterogeneity of immune features may be the reason for the difference in the prognosis of patients within the same TNM stage. Immunological score (IS) indicates the abundance of immune infiltration on the basis of the total number of lymphocytes in the core of tumors (CT) and invasive tumor margin (IM). In colorectal cancer, IS was combined with the standard pathological TNM stage and was named as TNM-Immune, which was a more specific prognostic indicator.Citation11–Citation13 To further validate the performance of IS on patients with colorectal cancer and prompt its implementation into clinical practice, an international coalition has been established, proposed by the Society for Immunotherapy of Cancer (SITC).Citation13–Citation15 Numerous studies of the NSCLC tumor microenvironment have proved the important role of immune factors (such as CD8, CD3, CD4, mDC, and B cells, etc.) in predicting the prognosis of lung cancer;Citation16–Citation21 and the researchers did a lot of attempts to use those factors to establish the IS in NSCLC.Citation22–Citation24 With the emergence and development of multiplex immunohistochemical staining techniques, more comprehensive information about immune cell subgroups can be obtained. Therefore, in this study, we used the multiplex immunohistochemical techniques to try to construct a more refined and personalized new IS system in NSCLC. The least absolute shrinkage and selection operator method (LASSO) has become even more popular in selecting significant variables from high-dimensional markers. LASSO-COX proportional hazards (LASSO-COX) model is also broadly used in survival analysis when the data are complex and multidimensional.Citation25–Citation28
In this study, we used the LASSO-COX model to construct a novel IS system named ISNSCLC on the basis of 112 immune features, covering most of the immune cell subsets, for the prediction of postoperative recurrences and clinical outcomes of LUAD (ISLUAD) and LUSC (ISLUSC). We further combined the ISNSCLC with TNM to form a TN-immunological score (TN-I) staging system for better risk stratification of NSCLC. At last, we established two nomograms to increase the clinical utility of the ISNSCLC.
Materials and methods
Study population and tumor specimens
Data are collected from consecutive patients from Tianjin Medical University Cancer Institute and Hospital, Tianjin, China, with pathologically confirmed primary NSCLC diagnosed from February 2013 to December 2014. The median follow-up time is 52.5 months. Inclusion criteria were presence of invasive tumor components in the hematoxylin and eosin slides, availability of clinicopathological data, complete follow-up data, and no history of cancer treatment before the surgery. Before the surgery, all the patients had undergone chest CT examination, and pathological diagnosis of lung cancer was confirmed by biting biopsy test. Some patients underwent PET-CT examination for auxiliary examination. Most patients received lobectomy, some received pneumonectomy, wedge, and segmentectomy were less, and the specific numbers are listed in Supplementary Tables S3 and S4. According to the 2013 and 2014 NCCN Clinical Practice Guidelines in NSCLC, all patients underwent radical surgery with/without postoperative adjuvant treatment. Adjuvant therapy is mainly platinum-based chemotherapy, combined with radiotherapy or targeted therapy when necessary. Formalin-fixed paraffin-embedded (FFPE) blocks of 304 patients with resected stage I, II, and III NSCLC were collected. Stage IV patients were excluded because of their heterogeneity and poor representation. Among them, 204 patients were diagnosed with LUAD, and 100 patients were diagnosed with LUSC. In LUAD and LUSC, we randomly divide all patients into two cohorts, one cohort as the training cohort (LUAD N = 102, LUSC N = 50) and the other cohort as the validation cohort (LUAD N = 102, LUSC N = 50) (Supplementary Fig. S1). This retrospective study carried out according to the Helsinki Declaration and was approved by the Ethics Committee of Tianjin Medical University Cancer Institute and Hospital. Appropriate informed consent was received from all the patients.
Multiplex immunohistochemistry and multispectral imaging
According to previous studies, Citation9–Citation11,Citation13,Citation22,Citation23,Citation29–Citation34 we selected 17 markers and divided them into three PANELs for seven-color multiplex immunohistochemistry (mIHC) staining: CD8, Foxp3, CD4, CD69, CD39, and CD73 in PANEL-1; programmed death ligand-1 (PD-L1), CD68, CD163, CD11c, CD20, and indoleamine 2,3-dioxygenase (IDO) in PANEL-2; and CD8, CD66b, programmed death-1 (PD-1), lymphocyte activation gene 3 (Lag-3), T cells immunoglobulin domain and mucin domain protein-3 (Tim-3), and T cell Ig and ITIM domain (TIGIT) in PANEL-3 (Supplementary Fig. S2A-D). Detailed information is shown in Supplementary Table S1. The representative graphs of the high/low-level distributed positive cells in the CT/IM areas for each marker are shown in Supplementary Fig. S2A-D. The single-stained cell and multiple-stained cell densities were calculated, respectively, in the CT and IM areas of the NSCLC tissue. Common labeling combinations form a total of 112 immune features (Supplementary Table S2). Slides were stained with multiplex fluorescence by using the PerkinElmer Opal 7-Color technology Kit (NEL81001KT) containing seven fluorophores. Xylene was used for dewaxing, and ethanol was used for rehydration. Microwave treatment (MWT) was performed for antigen retrieval with EDTA Buffer (pH 9.0). At room temperature, the tissue was blocked using an antibody-blocking buffer for up to 10 min. The slides were then incubated overnight with primary antibodies in a 4°C refrigerator. Next day, incubation with secondary antibody (poly-HRP-Ms/Rb) for 10 min was performed at room temperature. TSA Visualization and signal amplification were performed by using Opal TSA Plus (1:100). Thereafter, the Ab-TSA complex was removed by heating through MWT with EDTA 9.0 buffer. Each multiplex staining was performed by repeating these staining steps in series, with MWT step at the end of each cycle. Finally, all 17 targets of interest were detected with a corresponding Opal fluorophore (Supplementary Table S1). At last, multiplex staining was finished with the cell nuclei staining with DAPI and the slides were covered by anti-fluorescence-quenching sealing agent and coverslips.
Slides were scanned and visualized using the PerkinElmer Mantra Quantitative Pathology Imaging System at 200× magnification with the same exposure times. Multispectral images unmixing was performed using PerkinElmer inForm Image Analysis software (version 2.4.0). In CT and IM areas, five random areas of tumor tissue without hemorrhage, necrosis, or detachment were selected and scanned. The cell density was determined by the average count of positive cells per mm2.
Cutoff score selection and ISNSCLC construction
X-tile (Yale University, version 3.6.1) was used to determine the optimum density cutoff of each single-stained or multiple-stained feature based on the patients’ DFS. Next, we used the log-rank test P-value of Kaplan–Meier analysis for DFS to identify 20 immune features with top 20 smallest P-values to construct the prognostic model in LUAD and LUSC.
In the training cohort, the most potent prognostic markers were selected from the 20 chosen immune features using the LASSO-COX regression model. Finally, a scoring system based on multi-immune features was constructed for survival predicting.Citation25–Citation28 LASSO-COX regression model analysis was performed using the package “glmnet” of R software (version 3.5.3).
Statistics
The COX regression model was utilized to perform the univariate and multivariate analyses. Chi-square tests were used to compare two groups of categorical variables. P< .05 indicated statistical significance. DFS and OS estimation in different groups were performed by the Kaplan–Meier method with the log-rank test. Nomograms were generated by the logistic regression coefficients. We put all the important clinicopathological factors into the multivariate logistic regression, which adopts a stepwise backward method with an inclusion criterion of P < .05 and an exclusion criterion of P > .1. The finally screened factors and TNM stages were used to construct the nomograms. To evaluate the performance characteristics and assess the clinical practicality of the nomograms, respective calibration plots, and decision curve analysis (DCA) were drawn. Time-dependent receiver operating characteristic (ROC) curves were drawn to show the accuracy of different prognostic markers. Nomograms, DCA, and calibration plots were generated using EmpowerStats (version 2.0, http://www.empowerstats.com). Heatmap was performed using the package “pheatmap” of R software. Other calculations were performed using SPSS Statistics (version 24.0, IBM) and R software (version 3.5.3).
Results
Patient characteristics and ISNSCLC construction
Total 304 patients were enrolled in this study. The clinicopathological characteristics of the LUAD/LUSC patients in the training/validation cohorts are listed in Supplementary Tables S3 and S4. In this study, the volume of the tumor was calculated by the formula: (π × length × width × height)/6. For LUAD, according to postoperative pathology reports, micropapillary and solid patterns were marked as poorly differentiated; acinar or papillary patterns were marked as moderately differentiated; lepidic patterns were regarded as well differentiated. For LUSC, the postoperative pathology report directly reports the differentiation status (well, moderately, and poorly differentiated). Supplementary Fig. S3 shows the heatmaps of all markers for each patient from the LUAD and the LUSC group.
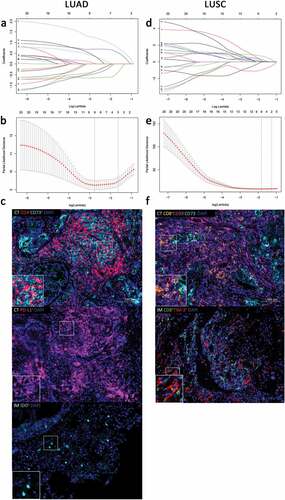
In the training cohort, X-tile was used to determine the optimum cutoffs (Supplementary Fig. S4). Supplementary Table S2 lists the cutoff values and the Kaplan–Meier analysis results for DFS of all the 112 immune features in the LUAD/LUSC cohorts. If the feature’s density was greater than its cutoff, the status of this feature was equivalent to 1; otherwise, the status was equivalent to 0. Based on the Kaplan–Meier analysis and its P-value, we chose 20 features with the top 20 smallest P-values in LUAD and LUSC for further model construction. Next, in the training groups, the LASSO-COX regression model was used to establish the prognostic scoring system named ISNSCLC based on the status of the 20 chosen features. We first screened some closely related prognostic indicators through LASSO-COX regression analysis, and obtained the corresponding regression coefficients of these indicators. Finally, through the calculation and deformation of the COX regression model, the ISNSCLC we defined is equal to the sum of the product of each marker value multiplied by their coefficients, which can effectively predict the prognostic risk. The ISNSCLC was designated as ISLUAD and ISLUSC for LUAD and LUSC, respectively. ISLUAD included three features: CD4+CD73+CT, PD-L1+CT, and IDO+IM. ISLUSC included another two features: CD8+CD39−CD73−CT, CD8+TIM-3+IM (). Supplementary Fig. S5 shows the COX regression risk scores of the raw data for the indicators included in the ISLUAD/ISLUSC. It also shows the distribution of these indicators among patients and their relationship to prognosis. The risk score plots suggested that, in LUAD, CD4+CD73+CT was a favorable prognostic factor, whereas PD-L1+CT and IDO+IM were negative factors. In LUSC, CD8+CD39−CD73−CT was a protective factor, whereas CD8+TIM-3+IM was a negative factor for the prognosis. Two formulas were also constructed to obtain the score for each patient on the basis of the expression levels of the above-selected features, where ISLUAD = – (1.372 × CD4+CD73+CT status) + (1.499 × PD-L1+CT status) + (1.014 × IDO+IM status) and ISLUSC = – (1.641 × CD8+CD39−CD73−CT status) + (1.319 × CD8+TIM-3+IM status). Based on X-tile, we chose 0 as the ISNSCLC cutoff in both the LUAD and LUSC cohorts to classify the patients into a high-ISNSCLC or a low-ISNSCLC group (Supplementary Fig. S4).
Figure 1. Construction of the ISNSCLC by the LASSO model. LASSO coefficient profiles of 20 significant immune features with the top 20 smallest P-values in LUAD training cohort (a) and LUSC training cohort (d). For tuning parameter selection in the LASSO model, by 10-time cross-validation via 1-SE criteria, λ = 0.194 was chosen in LUAD training cohort (b), and λ = 0.283 was chosen in LUSC training cohort (e). Representative multiplex fluorescent immunohistochemistry images show the final features enrolled in ISLUAD (c) and in ISLUSC (f). Bar, 100 µm. IS, immunological score; NSCLC, non-small cell lung cancer; LUAD, lung adenocarcinoma; LUSC, lung squamous cell carcinoma; CT, the core of tumor; IM, invasive margin.
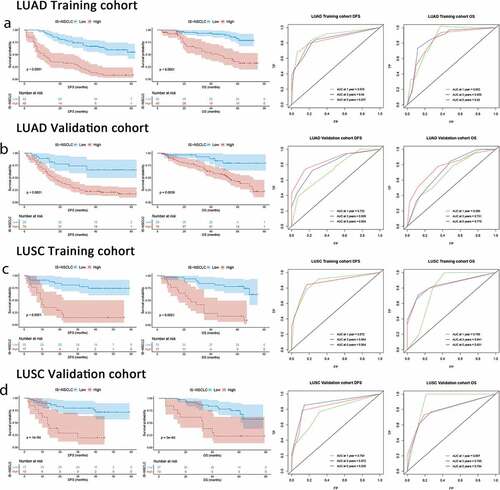
The distribution of the clinicopathological characteristics had no significant differences between the high-ISNSCLC and low-ISNSCLC groups in each cohort (Supplementary Tables S3 and S4). At different follow-up times, time-dependent ROC analyses were carried out to assess the prognostic accuracy of the ISNSCLC in the training/validation cohort, which showed large area under the curve (AUC) values (). Within the LUAD training cohort, upon comparing the low-ISLUAD patients with the high-ISLUAD patients, the 5-y DFS rates were 54.7% vs. 8.1%, and the 5-y OS rates were 82.4% vs. 36% (all P< .0001; )). Within the LUSC training cohort, upon comparing the low-ISLUSC patients with the high-ISLUSC patients, the 5-y DFS rates were 74.0% vs. 14.7%, and the 5-y OS rates were 78.2% vs. 17.6% (all P< .0001; )). We further applied the ISNSCLC scoring system to the LUAD/LUSC validation group, and the results were found consistent (,d)), which confirmed that the ISNSCLC has excellent prognostic power in various populations.
Figure 2. ISNSCLC performance in time-dependent ROC curves and Kaplan–Meier survival analyses in different cohorts. (a) LUAD training cohort. (b) LUAD validation cohort. (c) LUSC training cohort. (d) LUSC validation cohort. AUCs at 1, 3, and 5 y were used to assess prognostic accuracy. P-values were calculated by the log-rank test. DFS, disease-free survival; OS, overall survival; ROC, receiver operator characteristic; AUC, area under the curve.
Univariate, multivariate analysis, and stratified analysis of ISNSCLC
The univariate association of ISNSCLC and clinicopathological characteristics with DFS or OS in the training/validation cohort was tested (Supplementary Table S5). Significant variables were then analyzed by multivariate Cox proportional hazard regression models. After adjusting clinicopathological variables, the multivariate analysis suggested that the ISNSCLC was an independent negative prognostic indicator of DFS/OS in the LUAD/LUSC cohorts (). In addition, in some cohorts, T stage, N stage, TNM stage, and tumor volume are also independent prognostic factors; sometimes their HR are more accurate to discriminate between patients for survival (). This is consistent with the importance of these clinicopathological features in tumor prognosis.
Table 1. Multivariable Cox regression analyses of the ISNSCLC, clinicopathological characteristics, and survival.
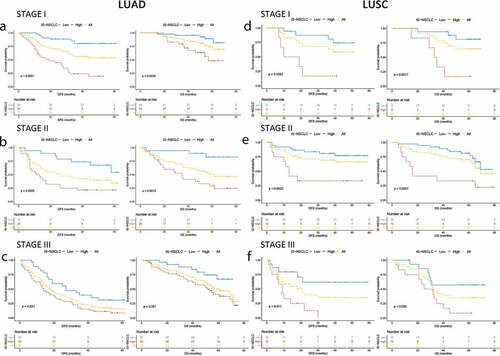
Stratified analyses were performed based on the TNM stage and other crucial clinicopathological risk factors in the LUAD/LUSC cohorts. In both LUAD and LUSC groups, regardless of stage I, II, or III, low-ISNSCLC patients always had a prolonged DFS/OS compared with that of the high-ISNSCLC patients (). When stratified with other clinicopathological risk factors in LUAD and LUSC, the ISNSCLC was still a significant prognostic marker for DFS or OS. It should be noted that the IS of patients with stage T3/T4 LUAD and patients with LUSC volume smaller than 10 cm3 did not always have prognostic significance. However, poor prognostic trends of the IS could be found in these groups, and the non-significance maybe a result of the small size of the sample. The subgroup Kaplan–Meier analyses are shown in Supplementary Figs. S6-9. The forest plots present the stratified COX regression analysis results (Supplementary Fig. S10).
Figure 3. Kaplan–Meier survival analysis stratified by the TNM stages. Kaplan–Meier survival analysis of DFS and OS for all the NSCLC patients according to the ISNSCLC stratified by the TNM stages. P-values were calculated by the log-rank test. (a) Stage I LUAD. (b) Stage I LUSC. (c) Stage II LUAD. (d) Stage II LUSC. (e) Stage III LUAD. (f) Stage III LUSC.
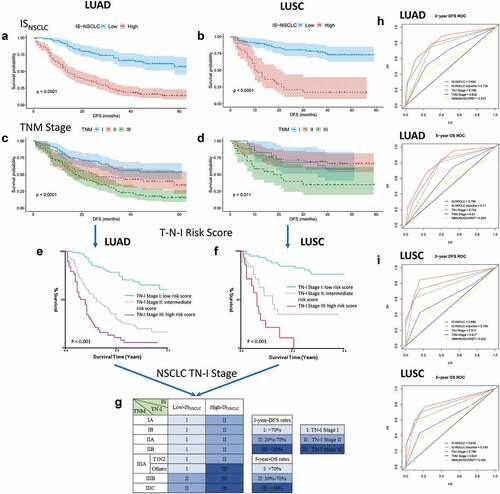
The ROC analysis showed that the prognostic accuracy of the ISNSCLC was relatively higher than that of the TNM stage, both in LUAD and LUSC (), revealing that the ISNSCLC exhibited a superior prognostic value compared with the TNM stage. We also calculated the IMMUNOSCORE® (IMMUNOSCORE® is a registered trademark owned by INSERM), which is obtained by the quantification of tumor-infiltrating CD3/CD8 in the CT/IM areas. Low to high densities of CD3/CD8 cells in these two areas equal IS 0 (I0) to IS 4 (I4).Citation13 We then performed Kaplan–Meier analyses on the IMMUNOSCORE® (Supplementary Fig. S11). Similar to previous studies,Citation13–15 patients with high scores tend to have better prognosis than patients with low scores, but sometimes the opposite result can occur. Both in LUAD and LUSC, the ROC analysis revealed that ISNSCLC exhibited a better prognostic value than that of the IMMUNOSCORE® ().
Figure 4. From TNM to TN-I. DFS curves of LUAD/LUSC patients according to ISNSCLC (a, b) and TNM stage (c, d). Patients were grouped into three groups (e, f) according to the combination of TNM stage (t, n) and ISNSCLC (i) (T-N-I risk score) by survival (3-y DFS, <20%, 20%-70%, and >70%; 5-y OS, <30%, 30%-70%, and >70%), resulting into a TN-immunological score (TN-I) staging table (g), adding significant prognostic impact to each TNM stage. ROC curves show the comparisons of the area under the curve of TN-I stage, ISNSCLC, and the ISNSCLC classifier (high vs. low) with TNM stage and the IS proposed by SITC in LUAD cohort (h) and LUSC cohort (I). SITC, the Society for Immunotherapy of Cancer.
TN-I staging and nomograms construction
To provide a better prognostic classification of NSCLC, we supplemented our ISNSCLC into TNM staging system. Low-ISNSCLC equaled immune stage I0, meaning the early immune stage, while high-ISNSCLC equaled immune stage I1, representing the advanced immune stage. As we did not have stage IV patients, we utilized multivariable COX regression analyses to obtain the risk score according to the T, N, I stage (T-N-I risk score). X-tile was used to find two optimal cutoff values to divide the risk score into three groups based on the DFS (Supplementary Fig. S12). Next, we used the risk score value to find the corresponding combinations of T, N, I, which were then divided into three prognostic groups, which were defined as the three stages of our new TN-I staging system. Although the cutoffs were 1.5/2.4 in LUAD while they were 1.0/2.4 in LUSC, the LUAD and LUSC cohorts obtained the same division of T, N, I combinations. The final TN-I staging system is shown in . Both in LUAD and LUSC, the ROC analysis revealed that the TN-I stage exhibited a higher prognostic accuracy than that of the TNM stage ().
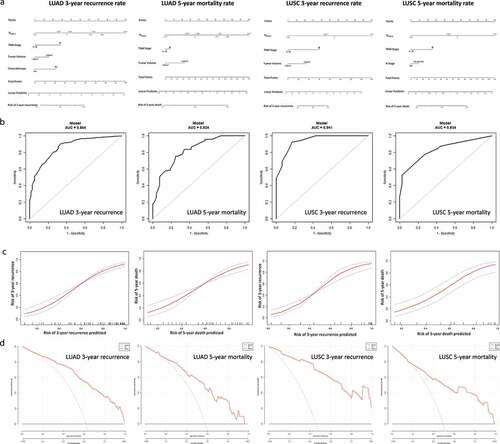
Finally, nomograms were constructed in both LUAD and LUSC as a quantitative method to predict the 3-y recurrence rate and the 5-y mortality rate for stage I–III LUAD/LUSC patients ()). The nomograms integrated the ISNSCLC and clinicopathological factors on the basis of the logistics regression model. We put all the important clinicopathological factors (age, gender, tumor volume, differentiation status, T stage, N stage, Smoking, Chemotherapy, TNM stage) and ISNSCLC into the multivariate logistic regression, which adopts a stepwise backward method with an inclusion criterion of P < .05 and an exclusion criterion of P > .1. The finally screened factors (shown in )) and TNM stage were used to construct the nomograms. The ROC curve analyses revealed that the nomograms had larger AUC value when compared with that of ISNSCLC or TNM stage alone ( and )). Calibration plots showed excellent agreement between the predicted and observed probabilities, indicating a superior performance of nomograms ()). DCA was conducted to assess the nomograms’ net clinical benefit ()).
Figure 5. Nomograms for predicting the 3-y recurrence and 5-y mortality rate after surgery in NSCLC patients. Nomograms (a) are showed at the top. Receiver operator characteristic curves (b) exhibit the prediction accuracy of each nomogram model. Model performance is shown by calibration plots (c) depicting the agreement between predicted and observed probabilities of each model. Decision curve analysis (d) shows the net clinical benefit of the nomograms.
Discussion
In our study, we constructed a new IS system named ISNSCLC consisting of two different models. One was designated as ISLUAD comprising three immune features for LUAD patients; the other was designated as ISLUSC comprising two immune features for LUSC patients. The ISNSCLC is a powerful prognostic tool independent of TNM staging, with high ISNSCLC indicating potential risky patients. TNM stage was established according to the anatomical information. Patients with the same TNM stages have a significantly different prognosis, indicating that this stage classifier provided inadequate prognostic information.Citation14,Citation15,Citation35 Many efforts had been made to establish the prognostic model combining TNM stage with the clinicopathological factors (such as the three-class risk model established in LUSC) and obtain good results.Citation7,Citation8 These models pay more attention to the characteristics of the tumor itself. On the contrary, the ISNSCLC is providing biological and immunological information and could function as a powerful supplement to the TNM stage. Compared with the IS of NSCLC proposed by previous studies, Citation13–Citation15 our ISNSCLC system discussed LUAD and LUSC separately, with complete consideration of the differences of immune characteristics between LUAD and LUSC. Besides, our model contained myeloid cells, checkpoints, and multi-labeled markers, and was established based on the LASSO-COX regression model, which significantly improved the accuracy of prediction.Citation25,Citation26,Citation28 Through classifying the patient into low-ISNSCLC or high-ISNSCLC group, the prognostic risk information is easily available. After stratified by the clinicopathological factors, ISNSCLC was still a good predictor of prognosis. Our data also suggested that the ISNSCLC seemed unsuitable for patients with stage T3/T4 LUAD and LUSC volume smaller than 10 cm3. However, considering the small number of patients in those groups, the results need further verification.
Multivariate analyses indicated that ISNSCLC was an independent indicator for prognosis in all cohorts. However, besides ISNSCLC, T stage, N stage, TNM stage, and tumor volume may also have important prognostic significance. Thus, we combined the ISNSCLC with these clinicopathologic factors in two ways to better predict the prognosis: the establishment of TN-I staging system and the construction of nomogram, which improved the clinical practicality of the ISNSCLC. TN-I staging system is a concise supplemental version of the TNM staging system, using IS staging consisting of “0” and “1” to suggest the degree of immunosuppression. Nomogram is a precise calculation to predict the possibility of 3-y recurrence and 5-y mortality. ROC analyses revealed that the prognostic efficacy of ISNSCLC, nomograms, and the TN-I staging system was better than that of the IMMUNOSCORE® and the TNM staging system. The ISNSCLC enhances the prognostic value of TNM stages and becomes a powerful supplement to TNM staging. Finally, based on the TN-I staging system, NSCLC patients in the same TNM stage could be classified into two distinct groups with different risks, which could help the decision-making in clinical practice. For patients with early TN-I stage, overtreatment should be avoided, where immunotherapies that function through enhancing existing immunity might have a better effect. For patients with advanced TN-I stage, we need to evaluate more effective and comprehensive approaches to enhance the effect of treatment and improve the prognosis based on the main immunosuppressive mechanism in this subtype of lung cancer. As immunotherapies such as PD-1/PD-L1 pathway blockades are playing a critical role in cancer therapy, Citation36 further investigations are needed to explore whether the TN-I stage can predict the prognosis and responses of patients receiving immunotherapy.
In this study, for LUAD, our formula had three variables: IDO+IM and PD-L1+CT were associated with poor outcomes, while CD4+CD73+CT was associated with favorable outcomes. IDO is an enzyme catalyzing the degradation of the amino acid tryptophan and is critical in immunosuppression. In microenvironment, the expression levels of IDO are diverse and are usually correlated with worse clinical outcomes.Citation37 In our study, IDO located in LUAD IM is mostly expressed on immune cells and was correlated with poor prognosis. The prognostic significance of PD-L1 remained controversial in NSCLC. Various researches revealed that PD-L1 expression levels could be relevant to various clinical outcomes, including good, poor, or no significance to prognosis.Citation38–Citation41 In our study, our findings suggested that PD-L1 had a negative prognostic impact on LUAD. Nevertheless, as most of our patients received chemotherapy rather than immune checkpoint blockade treatment, the effects of PD-L1 in patients receiving adjuvant immunotherapy need to be further studied. CD73 is an ectoenzyme generating adenosine. The clinical role of CD73 in tumors is not yet well understood. One prostate cancer study reported that in the tumor stroma, highly expressed CD73 was related to prolonged biochemical recurrence (BCR)-free survival. The mechanism might be that the stroma CD73 were playing an anti-tumor role by reducing NF-κB signaling in the tumor cell.Citation42 In this study, CD73 had a positive prognostic value and the favorable prognostic CD73 was mainly expressed in the stroma of LUAD CT, especially on CD4+ T cells. In contrast, CD73 in LUSC did not have prognostic significance.
The formula had two components for LUSC: CD8+CD39−CD73−CT was a favorable prognostic factor, while CD8+Tim-3+IM was negatively associated with tumor prognosis. CD39, also known as ecto-nucleoside triphosphate diphosphohydrolase (NTPDase 1), collaborates with CD73 in breaking down adenosine triphosphate (ATP) into adenosine.Citation32,Citation43 Recent literature revealed that CD39 and CD73 were new potential “immune checkpoint mediators” as the extracellular adenosine they generate could suppress the anti-tumor immune response.Citation32 In our research, we found that LUSC CT CD8+ T cells that did not express CD39 and CD73 were strongly associated with favorable outcomes, indicating that CD8+CD39−CD73−CT cells might have the most potent cytotoxicity. Meanwhile, IM CD8+ T cells expressing Tim-3 were associated with worse outcomes, indicating a tumor-promoting effect of CD8+Tim-3+IM cells. It was reported that Tim-3 is a promising checkpoint.Citation44 Several studies revealed that highly expressed Tim-3 on CD8+ T cells had a negative prognostic significance, which is consistent with our result in LUSC.Citation45,Citation46 Nevertheless, we found that CD8+ T cells played a double-faced role in LUSC.
To sum up, the strong prognosis-correlated immune features were entirely different between LUAD and LUSC. In LUAD, metabolism-associated factors like CD73, IDO, and checkpoint PD-L1 were playing more important roles. On the other hand, in LUSC, cytotoxic CD8 cells played a critical and double-faced role. Immune-related metabolism changes may play an important role in LUAD, but in the LUSC, the role of cellular immunity may be more outstanding. These findings partially harmonize with recent studies, Citation47–Citation49 and the results in this study maybe a result of the significant biological differences between LUSC and LUAD. LUSC has more tumor mutational burden and tumor-specific antigens, whereas LUAD has more targetable EGFR, ALK, or KRAS mutations.Citation5,Citation47,Citation48,Citation50 In addition, Rictor (an important subunit of the mTORC2 complex) has a higher rate of gene amplification in LUSC, which may promote tumor development and metastasis.Citation51 To our knowledge, this is the first study wherein LUAD and LUSC have been discussed separately in IS establishment, which is also the highlight of this study. Completely different results have been obtained; thus, respective IS models have been established. LUSC and LUAD have shown significant differences in genomic and histological heterogeneities; therefore, different results can be expected.Citation5 Our findings suggested that the prognostic significance of various immune components from different subtypes were differential or even opposite. It is consistent with several previous studies on the immune microenvironment in LUSC vs. LUAD patients.Citation24,Citation48,Citation50 This study also suggests that the use of anti-PD agents or IDO inhibitors in the treatment of LUAD may have a better result, whereas in LUSC, treatments that increase T cell infiltration, promote lymphocyte activation, or reverse T cell exhaustion (such as anti-Tim-3 agents, etc.) may be more efficacious. Therefore, in view of the differences in these immune characteristics, future clinical trials need to be designed separately for LUAD and LUSC.
There are also some limitations to this study. All the patients enrolled in this study are from China, which may not represent all the races. However, on a global scale, China has a very high morbidity and mortality rate of lung cancer.Citation1,Citation52 The investigation of ISNSCLC in Chinese patients could provide many valuable information for oncologists and patients around the world. Besides, our training and validation cohorts were collected from the same institution. External validation should be done in the future to validate the universality of this model. In addition, this study was retrospective. Therefore, further international multicenter prospective clinical trials need to be carried out to validate the results and conclusions of this study.
In conclusion, the newly established ISLUAD and ISLUSC were completely different, and both the scores were excellent indicators for the prediction of recurrence and survival. The TN-I stage and nomograms constructed based on the ISNSCLC could effectively improve the prognostic accuracy and facilitate the clinical application. With the help of the TN-I staging system, in the future, the prognosis prediction, clinical management, and individualized treatment decisions of lung cancer will be more precise and more reliable.
Authors’ contributions
Conception and design: XR; development of methodology: ZZ, FY, HZ, FW; acquisition of data (acquired and managed patients, provided facilities, etc.): ZZ, FY, YW; analysis and interpretation of data: ZZ, FY, YW; writing, review, and/or revision of the manuscript: ZZ, HZ, FW; administrative, technical, or material support: PZ, XZ; study supervision: XR, FW; all authors read and approved the final manuscript.
Conflicts of interest
The authors have declared no conflicts of interest.
Supplemental Material
Download ()Acknowledgments
The authors sincerely appreciate all the physicians and patients who participated in this study.
Supplementary material
Supplemental data for this article can be accessed on the publisher’s website.
Additional information
Funding
References
- Torre LA, Bray F, Siegel RL, Ferlay J, Lortet-Tieulent J, Jemal A. Global cancer statistics, 2012. CA Cancer J Clin. 2015;65(2). doi:10.3322/caac.21262.
- Herbst RS, Heymach JV, Lippman SM. Lung cancer. N Engl J Med. 2008;359(13):1367–12. doi:10.1056/NEJMra0802714.
- Davidson MR, Gazdar AF, Clarke BE. The pivotal role of pathology in the management of lung cancer. J Thorac Dis. 2013;5(Suppl 5):S463–78. doi:10.3978/j..2072-1439.2013.08.43.
- Langer CJ, Besse B, Gualberto A, Brambilla E, Soria JC. The evolving role of histology in the management of advanced non-small-cell lung cancer. J Clin Oncol Off J Am Soc Clin Oncol. 2010;28(36):5311–5320. doi:10.1200/jco.2010.28.8126.
- Chen Z, Fillmore CM, Hammerman PS, Kim CF, Wong -K-K. Non-small-cell lung cancers: a heterogeneous set of diseases. Nat Rev Cancer. 2014;14(8):535–546. doi:10.1038/nrc3775.
- Mlecnik B, Bindea G, Pagès F, Galon J. Tumor immunosurveillance in human cancers. Cancer Metastasis Rev. 2011;30(1). doi:10.1007/s10555-011-9270-7.
- Pilotto S, Sperduti I, Novello S, Peretti U, Milella M, Facciolo F, Vari S, Leuzzi G, Vavalà T, Marchetti A, et al. Risk stratification model for resected squamous-cell lung cancer patients according to clinical and pathological factors. J Thorac Oncol. 2015;10(9):1341–1348. doi:10.1097/jto.0000000000000628.
- Pilotto S, Sperduti I, Leuzzi G, Chiappetta M, Mucilli F, Ratto GB, Lococo F, Filosso PL, Spaggiari L, Novello S, et al. Prognostic model for resected squamous cell lung cancer: external multicenter validation and propensity score analysis exploring the impact of adjuvant and neoadjuvant treatment. J Thorac Oncol. 2018;13(4):568–575. doi:10.1016/j.jtho.2017.12.003.
- Fridman WH, Pagès F, Sautès-Fridman C, Galon J. The immune contexture in human tumours: impact on clinical outcome. Nat Rev Cancer. 2012;12(4):298–306. doi:10.1038/nrc3245.
- Galon J, Costes A, Sanchez-Cabo F, Kirilovsky A, Mlecnik B, Lagorce-Pagès C, Tosolini M, Camus M, Berger A, Wind P, et al. Type, density, and location of immune cells within human colorectal tumors predict clinical outcome. Science. 2006;313(5795):1960–1964. doi:10.1126/science.1129139.
- Angell H, Galon J. From the immune contexture to the Immunoscore: the role of prognostic and predictive immune markers in cancer. Curr Opin Immunol. 2013;25(2):261–267. doi:10.1016/j.coi.2013.03.004.
- Schreiber RD, Old LJ, Smyth MJ. Cancer immunoediting: integrating immunity’s roles in cancer suppression and promotion. Science. 2011;331(6024):1565–1570. doi:10.1126/science.1203486.
- Galon J, Mlecnik B, Bindea G, Angell HK, Berger A, Lagorce C, Lugli A, Zlobec I, Hartmann A, Bifulco C, et al. Towards the introduction of the ‘Immunoscore’ in the classification of malignant tumours. J Pathol. 2014;232(2):199–209. doi:10.1002/path.4287.
- Galon J, Pagès F, Marincola FM, Thurin M, Trinchieri G, Fox BA, Gajewski TF, Ascierto PA. The immune score as a new possible approach for the classification of cancer. J Transl Med. 2012;10(1):1. doi:10.1186/1479-5876-10-1.
- Galon J, Pagès F, Marincola FM, Angell HK, Thurin M, Lugli A, Zlobec I, Berger A, Bifulco C, Botti G, et al. Cancer classification using the Immunoscore: a worldwide task force. J Transl Med. 2012;10(1):205. doi:10.1186/1479-5876-10-205.
- Germain C, Gnjatic S, Tamzalit F, Knockaert S, Remark R, Goc J, Lepelley A, Becht E, Katsahian S, Bizouard G, et al. Presence of B cells in tertiary lymphoid structures is associated with a protective immunity in patients with lung cancer. Am J Respir Crit Care Med. 2014;189(7):832–844. doi:10.1164/rccm.201309-1611OC.
- Dieu-Nosjean MC, Giraldo NA, Kaplon H, Germain C, Fridman WH, Sautès-Fridman C. Tertiary lymphoid structures, drivers of the anti-tumor responses in human cancers. Immunol Rev. 2016;271(1):260–275. doi:10.1111/imr.12405.
- Schalper KA, Brown J, Carvajal-Hausdorf D, McLaughlin J, Velcheti V, Syrigos KN, Herbst RS, Rimm DL. Objective measurement and clinical significance of TILs in non-small cell lung cancer. J Natl Cancer Inst. 2015;107(3). doi:10.1093/jnci/dju435.
- Al-Shibli KI, Donnem T, Al-Saad S, Persson M, Bremnes RM, Busund LT. Prognostic effect of epithelial and stromal lymphocyte infiltration in non-small cell lung cancer. Clin Cancer Res. 2008;14(16):5220–5227. doi:10.1158/1078-0432.Ccr-08-0133.
- Mansuet-Lupo A, Alifano M, Pécuchet N, Biton J, Becht E, Goc J, Germain C, Ouakrim H, Régnard J, Cremer I, et al. Intratumoral immune cell densities are associated with lung adenocarcinoma gene alterations. Am J Respir Crit Care Med. 2016;194(11):1403–1412. doi:10.1164/rccm.201510-2031OC.
- Kim MY, Koh J, Kim S, Go H, Jeon YK, Chung DH. Clinicopathological analysis of PD-L1 and PD-L2 expression in pulmonary squamous cell carcinoma: comparison with tumor-infiltrating T cells and the status of oncogenic drivers. Lung Cancer (Amsterdam, Neth). 2015;88(1):24–33. doi:10.1016/j.lungcan.2015.01.016.
- Donnem T, Kilvaer TK, Andersen S, Richardsen E, Paulsen EE, Hald SM, Al-Saad S, Brustugun OT, Helland A, Lund-Iversen M, et al. Strategies for clinical implementation of TNM-Immunoscore in resected nonsmall-cell lung cancer. Ann Oncol. 2016;27(2):225–232. doi:10.1093/annonc/mdv560.
- Paulsen -E-E, Kilvaer TK, Khanehkenari MR, Al-Saad S, Hald SM, Andersen S, Richardsen E, Ness N, Busund L-T, Bremnes RM, et al. Assessing PDL-1 and PD-1 in non–small cell lung cancer: a novel immunoscore approach. Clin Lung Cancer. 2017;18(2):220–33.e8. doi:10.1016/j.cllc.2016.09.009.
- Paulsen -E-E, Kilvaer T, Khanehkenari MR, Maurseth RJ, Al-Saad S, Hald SM, Al-Shibli K, Andersen S, Richardsen E, Busund L-T, et al. CD45RO(+) memory t lymphocytes–a candidate marker for TNM-immunoscore in squamous non-small cell lung cancer. Neoplasia. 2015;17(11):839–848. doi:10.1016/j.neo.2015.11.004.
- Zhang J-X, Song W, Chen Z-H, Wei J-H, Liao Y-J, Lei J, Hu M, Chen G-Z, Liao B, Lu J, et al. Prognostic and predictive value of a microRNA signature in stage II colon cancer: a microRNA expression analysis. Lancet Oncol. 2013;14(13):1295–1306. doi:10.1016/S1470-2045(13)70491-1.
- Tibshirani R. The lasso method for variable selection in the Cox model. Stat Med. 1997;16(4):385–395. doi:10.1002/(SICI)1097-0258(19970228)16:4<385::AID-SIM380>3.0.CO;2-3.
- Tibshirani R. Regression shrinkage and selection via the lasso. J R Stat Soc Ser B (Methodol). 1996;58(1):267–288. doi:10.1111/j.2517-6161.1996.tb02080.x.
- Han Y, Ye X, Cheng J, Zhang S, Feng W, Han Z, Zhang J, Huang K. Integrative analysis based on survival associated co-expression gene modules for predicting Neuroblastoma patients’ survival time. Biol Direct. 2019;14(1):4. doi:10.1186/s13062-018-0229-2.
- Giese MA, Hind LE, Huttenlocher A. Neutrophil plasticity in the tumor microenvironment. Blood. 2019;133(20):2159–2167. doi:10.1182/blood-2018-11-844548.
- Rakaee M, Busund L-T, Paulsen -E-E, Richardsen E, Al-Saad S, Andersen S, Donnem T, Bremnes RM, Kilvaer TK. Prognostic effect of intratumoral neutrophils across histological subtypes of non-small cell lung cancer. Oncotarget. 2016;7(44):72184–72196. doi:10.18632/oncotarget.12360.
- Mita Y, Kimura MY, Hayashizaki K, Koyama-Nasu R, Ito T, Motohashi S, Okamoto Y, Nakayama T. Crucial role of CD69 in anti-tumor immunity through regulating the exhaustion of tumor-infiltrating T cells. Int Immunol. 2018;30(12):559–567. doi:10.1093/intimm/dxy050.
- Allard B, Longhi MS, Robson SC, Stagg J. The ectonucleotidases CD39 and CD73: novel checkpoint inhibitor targets. Immunol Rev. 2017;276(1):121–144. doi:10.1111/imr.12528.
- Burugu S, Dancsok AR, Nielsen TO. Emerging targets in cancer immunotherapy. Semin Cancer Biol. 2018;52(Pt 2):39–52. doi:10.1016/j.semcancer.2017.10.001.
- Anderson AC, Joller N, Kuchroo VK. Lag-3, Tim-3, and TIGIT: co-inhibitory receptors with specialized functions in immune regulation. Immunity. 2016;44(5):989–1004. doi:10.1016/j.immuni.2016.05.001.
- Yang L, Yang Y, Ma P, Zheng B, Liu W, Zhang Z, Ding N, Liu L, Mao Y, Lv N, et al. Spread through air spaces predicts a worse survival in patients with stage I adenocarcinomas >2 cm after radical lobectomy. J Thorac Dis. 2018;10(9):5308–5317. doi:10.21037/jtd.2018.09.22.
- Jia L, Zhang Q, Zhang R. PD-1/PD-L1 pathway blockade works as an effective and practical therapy for cancer immunotherapy. Cancer Biol Med. 2018;15(2):116–123. doi:10.20892/j..2095-3941.2017.0086.
- Chen W. IDO: more than an enzyme. Nat Immunol. 2011;12(9):809–811. doi:10.1038/ni.2088.
- Yu H, Boyle TA, Zhou C, Rimm DL, Hirsch FR. PD-L1 expression in lung cancer. J Thorac Oncol. 2016;11(7):964–975. doi:10.1016/j.jtho.2016.04.014.
- Zhang M, Li G, Wang Y, Wang Y, Zhao S, Haihong P, Zhao H, Wang Y. PD-L1 expression in lung cancer and its correlation with driver mutations: a meta-analysis. Sci Rep. 2017;7(1):10255. doi:10.1038/s41598-017-10925-7.
- Tang Y, Fang W, Zhang Y, Hong S, Kang S, Yan Y, Chen N, Zhan J, He X, Qin T, et al. The association between PD-L1 and EGFR status and the prognostic value of PD-L1 in advanced non-small cell lung cancer patients treated with EGFR-TKIs. Oncotarget. 2015;6(16):14209–14219. doi:10.18632/oncotarget.3694.
- Schmidt LH, Kümmel A, Görlich D, Mohr M, Bröckling S, Mikesch JH, Grünewald I, Marra A, Schultheis AM, Wardelmann E, et al. PD-1 and PD-L1 expression in NSCLC indicate a favorable prognosis in defined subgroups. PLoS ONE. 2015;10(8):e0136023. doi:10.1371/journal.pone.0136023.
- Leclerc BG, Charlebois R, Chouinard G, Allard B, Pommey S, Saad F, Stagg J. CD73 expression is an independent prognostic factor in prostate cancer. Clin Cancer Res. 2016;22(1):158–166. doi:10.1158/1078-0432.CCR-15-1181.
- Wang CM, Ploia C, Anselmi F, Sarukhan A, Viola A. Adenosine triphosphate acts as a paracrine signaling molecule to reduce the motility of T cells. Embo J. 2014;33(12):1354–1364. doi:10.15252/embj.201386666.
- Sakuishi K, Apetoh L, Sullivan JM, Blazar BR, Kuchroo VK, Anderson AC. Targeting Tim-3 and PD-1 pathways to reverse T cell exhaustion and restore anti-tumor immunity. J Exp Med. 2010;207(10):2187–2194. doi:10.1084/jem.20100643.
- Jia K, He Y, Dziadziuszko R, Zhao S, Zhang X, Deng J, Wang H, Hirsch FR, Zhou C, Yu H, et al. T cell immunoglobulin and mucin-domain containing-3 in non-small cell lung cancer. Transl Lung Cancer Res. 2019;8(6):895–906. doi:10.21037/tlcr.2019.11.17.
- Li H, Wu K, Tao K, Chen L, Zheng Q, Lu X, Liu J, Shi L, Liu C, Wang G, et al. Tim-3/galectin-9 signaling pathway mediates T-cell dysfunction and predicts poor prognosis in patients with hepatitis B virus-associated hepatocellular carcinoma. Hepatology. 2012;56(4):1342–1351. doi:10.1002/hep.25777.
- Rakaee M, Kilvaer TK, Dalen SM, Richardsen E, Paulsen -E-E, Hald SM, Al-Saad S, Andersen S, Donnem T, Bremnes RM, et al. Evaluation of tumor-infiltrating lymphocytes using routine H&E slides predicts patient survival in resected non-small cell lung cancer. Hum Pathol. 2018;79:188–198. doi:10.1016/j.humpath.2018.05.017.
- Meng X, Gao Y, Yang L, Jing H, Teng F, Huang Z, Xing L. Immune microenvironment differences between squamous and non-squamous non–small-cell lung cancer and their influence on the prognosis. Clin Lung Cancer. 2019;20(1):48–58. doi:10.1016/j.cllc.2018.09.012.
- Azuma K, Ota K, Kawahara A, Hattori S, Iwama E, Harada T, Matsumoto K, Takayama K, Takamori S, Kage M, et al. Association of PD-L1 overexpression with activating EGFR mutations in surgically resected nonsmall-cell lung cancer. Ann Oncol. 2014;25(10):1935–1940. doi:10.1093/annonc/mdu242.
- Faruki H, Mayhew GM, Serody JS, Hayes DN, Perou CM, Lai-Goldman M. Lung adenocarcinoma and squamous cell carcinoma gene expression subtypes demonstrate significant differences in tumor immune landscape. J Thorac Oncol. 2017;12(6):943–953. doi:10.1016/j.jtho.2017.03.010.
- Gkountakos A, Pilotto S, Mafficini A, Vicentini C, Simbolo M, Milella M, Tortora G, Scarpa A, Bria E, Corbo V, et al. Unmasking the impact of Rictor in cancer: novel insights of mTORC2 complex. Carcinogenesis. 2018;39(8):971–980. doi:10.1093/carcin/bgy086.
- Chen W, Zheng R, Zhang S, Zhao P, Li G, Wu L, He J. Report of incidence and mortality in China cancer registries, 2009. Chin J Cancer Res. 2013;25(1):10–21. doi:10.3978/j..1000-9604.2012.12.04.