
ABSTRACT
Despite a proportion of renal cancer patients can experiment marked and durable responses to immune-checkpoint inhibitors, the treatment efficacy is widely variable and identifying the patient who will benefit from immunotherapy remains an issue. We performed a prospective study to investigate if soluble forms of the immune-checkpoints PD-1 (sPD-1), PD-L1 (sPD-L1), pan-BTN3As, BTN3A1, and BTN2A1, could be candidate to predict the response to immune-checkpoint blockade therapy. We evaluated the plasma levels in a learning cohort of metastatic clear cell renal carcinoma (mccRCC) patients treated with the anti-PD-1 agent nivolumab by ad hoc developed ELISA’s. Using specific cut-offs determined through ROC curves, we showed that high baseline levels of sPD-1 (>2.11 ng/ml), sPD-L1 (>0.66 ng/ml), and sBTN3A1 (>6.84 ng/ml) were associated with a longer progression-free survival (PFS) to nivolumab treatment [median PFS, levels above thresholds: sPD-1, 20.7 months (p < .0001); sPD-L1, 19 months (p < .0001); sBTN3A1, 17.5 months (p = .002)]. High sPD-1 and sBTN3A1 levels were also associated with best overall response by RECIST and objective response of >20%. The results were confirmed in a validation cohort of 20 mccRCC patients. The analysis of plasma dynamic changes after nivolumab showed a statistically significant decrease of sPD-1 after 2 cycles (Day 28) in the long-responder patients. Our study revealed that the plasma levels of sPD-1, sPD-L1, and sBTN3A1 can predict response to nivolumab, discriminating responders from non-responders already at therapy baseline, with the advantages of non-invasive sample collection and real-time monitoring that allow to evaluate the dynamic changes during cancer evolution and treatment.
1. Introduction
Renal cell carcinoma (RCC) is a heterogeneous group of cancer subtypes with different morphological and genetic features, molecular pathogenesis, and clinical behavior. Clear cell renal carcinoma (ccRCC) accounts for approximately 75% of all renal cancersCitation1,Citation2 and represents a tumor where the new biological and immunological knowledge have changed the clinical landscape and natural history of the disease.Citation3,Citation4 Given the central role of angiogenesis in ccRCC, several agents targeting the vascular endothelial growth factor (VEGF) pathway have exploited this feature, leading the median overall survival (OS) to ~30 months in 2014 for metastatic ccRCC patients.Citation5–7 The next paradigm shift occurred with the introduction of immunoncology that, targeting the immune system/tumor microenvironment (TME), has recently become a promising frontier for the treatment of RCC, improving the individual’s competence to drive the immune system against cancer cells, with the opportunity of a further long-term survival.Citation8–10
The known responsiveness to the immunotherapies, such as interleukin 2 (IL-2) and interferon alpha (IFN-α), the observations of high levels of immune infiltrate in the TME, and the parallel occurrence of some spontaneous tumor regression of metastases after radical nephrectomy, suggested, already in the past, a natural antitumor immunity for metastatic RCC patients.Citation11
The recent new information relative to the complex role of TME is of increasing interest in this disease. It is known that tumors can create an immunosuppressive microenvironment by upregulating the inhibitory molecules expression, such as programmed cell death protein (PD-1) on tumor-infiltrating T cells, or its ligand PD-L1 on tumors cells, allowing for tumor ‘escape’ of cancer cells from the immune system.Citation12,Citation13 The blockade of the PD1/PD-L1 interactions with specific immune-checkpoints inhibitors, such as nivolumab, may prevent suppression of T-cells which remain active and can promote the immune killing of the tumor cells.Citation14
The CheckMate 025 was the first Phase 3 clinical trial including the anti-PD-1 antibody nivolumab. In comparison with everolimus, in mRCC patients who had prior failed after either one or two tyrosine kinase inhibitors (TKIs), nivolumab showed a significant improvement in median OS benefit, which led to regulatory approval in both the EU and the USA.Citation15,Citation16 Subsequently, several immune-oncology (IO) drug combination have proven better efficacy over sunitinib in the first-line setting, with a new revolution in the treatment of mccRCC. In the phase 3 CheckMate 214 trial evaluating nivolumab plus the anti-CTLA4 ipilimumab versus sunitinib in previously untreated mRCC patients, OS and objective response rates (ORR) were significantly higher in the treatment with nivolumab plus ipilimumab than with sunitinib among IMDC (International Metastatic RCC database Consortium) intermediate- and poor-risk patients.Citation17,Citation18 Ongoing clinical trials and others recently concluded continue to study the efficacy of novel drug combinations, with special reference to the anti-PD-L1 agent avelumab or the anti-PD-1 antibody pembrolizumab with the VEGFR-inhibitor axitinib.Citation19,Citation20
However, although a clinically relevant median response duration is reported, not all patients equally benefit from the currently available IO treatment, and the patient response rate is overall low.Citation17 Biological factors specific for certain individuals have a clear effect on this variation in response. Predicting which patient will benefit from immunotherapy still remain an issue, as well as an unmet need. Predictive biomarkers could help to identify patient’s subgroups for immune-checkpoint treatment, driving the therapeutic choice and preventing or overcoming the drug resistance.
Since nivolumab inhibits the PD-1/PD-L1 interaction, PD-L1 expression should be a valid predictive biomarker to anti-PD-(L)1 immunotherapies. In fact, it was hypothesized that PD-L1 expression by the tumor or immune cells is required for therapy response, as it happens in other tumors.Citation21
Many elements represent a barrier to the use of PD-L1 expression as potential biomarker for monitoring the nivolumab activity. The assessment of PD-L1 expression using immunohistochemistry (IHC) staining in formalin-fixed paraffin-embedded (FFPE) tissue samples shows several limitations inherent to the tissue sampling, IHC detection methods and used antibodies. Beyond the technical methods to define the positivity in the tumor tissue, the main limitation is that PD-L1 and PD-1 are dynamic checkpoints, like the immune system, and their expression in paraffin-embedded tumor tissue could not be representative of all metastatic disease, that changes during cancer evolution and treatment in individual patients.Citation22 Right the high temporal and spatial biological heterogeneity within the same tumor sample and in response to treatment adds further complexity and represents one of the leading barriers to the identification of a non-invasive biomarker for the prediction of response.Citation23 Thus, more dynamic biomarkers are required for patient selection. Since the soluble forms of PD-1 (sPD-1) and PD-L1 (sPD-L1) can be detected in the peripheral blood, and a positive correlation between sPD-1/sPD-L1 levels with clinical response was recently described in other type of tumors, the plasma sPD-(L)1 expression level could represent a predictive biomarker of immunotherapy response in mccRCC.
Additionally, it is well known that, although PD-1 and PD-L1 are the main targets of the drugs used in clinical practice, others immune-checkpoints are involved in a complex network of interactions between receptors and ligands present both on tumor cells and T cells, positively or negatively modulating the antitumor immune response.Citation24
Among several immune checkpoints, a family of transmembrane glycoproteins belonging to the immunoglobulin (Ig) superfamily, called butyrophilins (BTNs), has been recently shown to have an interesting immunomodulatory role.Citation25–27
Based on these evidence, we investigated the potential role of sPD-1, sPD-L1, and sBTNs (pan-sBTN3A, sBTN3A1, and sBTN2A1) levels as predictive biomarkers of response to nivolumab treatment in mccRCC patients ().
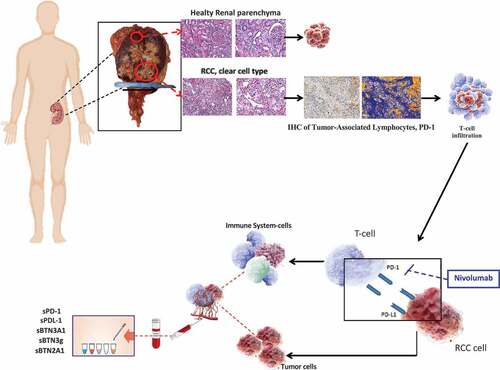
Figure 1. The assessment of PD-L1 expression using immunohistochemistry (IHC) staining in formalin-fixed paraffin-embedded (FFPE) tissue samples shows several limitations inherent to the tissue sampling, IHC detection methods and used antibodies. Circulating ICs could represent more dynamic biomarkers and be useful to predict the effect of the anti-PD-1 monoclonal antibody against RCC
2. Materials and methods
2.1. Study population
We performed a prospective study including a cohort of 56 patients with histologically confirmed diagnosis of ccRCC, 36 patients from University Hospital Policlinico “P. Giaccone” of Palermo (Italy) and a validation cohort of 20 patients from I.R.C.C.S. San Matteo University Hospital Foundation of Pavia (Italy).
Peripheral blood samples from ccRCC patients were prospectively obtained from March 2017 to January 2019.
The study population included patients with advanced disease candidate to the anti-PD-1 nivolumab as second line treatment, based on medical choice and current therapeutic options.
Blood samples were collected at baseline, before starting nivolumab treatment (T0), and after a 4-week period (T1, two cycles of nivolumab administration).
The clinical information collected included gender, age, histologic subtype, grading, clinical stage according to the TNM system of the American Joint Committee on Cancer (AJCC), Karnofsky performance status (PS), prognostic factors, type of surgery, site of metastases, tumor response [progression disease (PD), stable disease (SD), partial response (PR), complete response (CR)] assessed according to Response Evaluation Criteria In Solid Tumors (RECIST version 1.1.), and progression free survival (PFS) to nivolumab treatment.
The association of sIC with clinical outcomes was analyzed, including PFS, best overall response by RECIST (BOR), objective response of >20% (OR), IMDC Prognostic Risk Group and number of metastases.
A written informed consent was obtained from each recruited patient in the study (Protocol “G-Land 2017”) approved by ethical committee (Comitato Etico Palermo 1; approval number: 0103–2017) of the University-affiliated Hospital AOUP ‘P. Giaccone’ of Palermo. All clinical information were anonymously recorded and coded.
In the population of metastatic patients, treated with second-line nivolumab, the association between plasma ICs levels and nivolumab response and, subsequently, the plasma dynamic changes after immunotherapy treatment were investigated. The results were confirmed in the validation cohort of 20 mccRCC patients.
An exploratory analysis on patients with localized disease was included in the study. In this population, blood samples were collected before the kidney surgery (T0-l), and at tenth day after surgery (T1-l). The difference in plasma ICs levels between metastatic ccRCC patients and those with localized disease was investigated.
2.2. Sample collection and plasma isolation
The peripheral blood samples from patients were processed within 2 h of collection, by centrifugation at 2.200 g for 15 min at 4°C in presence of EDTA. The isolated supernatants (plasma fractions) were aliquoted in cryotubes and stored at −80°C until their use for subsequent analysis.
2.3. Determination of soluble PD-L1, PD-1, pan-BTN3A, BTN3A1 and BN2A1 concentrations in plasma
The plasma sPD-1, sPD-L1, and pan-sBTN3A, sBTN3A1, and sBTN2A1 levels have been measured using specific homemade ELISA assays not yet commercially available. Because some differences have been observed when using kits obtained from different sources, specific ELISA assays designed by DYNABIO S.A. (Parc de Luminy, Marseille France) according to our recommendations were used. These specifications included: (i) confirmation by tandem mass spectrometry of the antigen sequence; (ii) optimization of the assay by testing all combinations of available monoclonal antibodies in capture and detection, targeting maximal signal/background ratio, and sensitivity (combinations of two or more antibodies in coating and/or detection were also tested to improve performances); (iii) checking sample compatibility (serum vs plasma, interference of the matrix); and (iv) ensure that assay can be run at room temperature for easy handling and robustness.
All five ELISAs followed the same protocol: all steps were run at room temperature. Plates were coated overnight with the antibody selected for antigen, then washed. Remaining binding sites were blocked to minimize background. The next steps all ended with plate washing. For the PD-L1 assay, all steps were performed under shaking. Samples to be tested were incubated for 3 h. Then, the biotinylated antibody selected for detection was incubated for 30 min, followed by incubation for 15 min with the avidine-peroxidase conjugate. Finally, the substrate TMB was incubated for 15 min, the reaction stopped with H2SO4 and the O.D. read at 450 nm. Concentrations were established by comparison with a range obtained with known concentrations of the recombinant antigen.
The five ELISA tests used showed good linearity and a high specificity. The linearity for sPD-1 measurement in the test ranges from 0.05 to 5.00 ng/mL, for sPD-L1 from 0.02 to 2.00 ng/mL, for sPan-BTN3As from 0.10 to 8.00 ng/mL, for sBTN3A1 from 0.10 to 8.00 ng/mL, and for sBTN2A1 is from 0.06 to 2.00 ng/mL as presented in Supplementary Figure 1. Also, we tested the cross reactivity between these five recombinant proteins and, as expected, no signal was detected when the antibodies used did not correspond to the antigen.
Analysis comparing concentrations of the five markers measured in serum and plasma from the same blood collection showed that apparent concentrations in serum were at least three to five times less than in plasma (Supplementary Figure 2). This study showed that clotting determined the apparent loss of a large part of the assayed proteins. Because the mechanism of such loss is unknown, determination of protein concentrations in serum might be affected by factors other than the patient clinical status. Therefore, the use of serum samples could be misleading and should be avoided. For this reason, all samples assayed in this study were plasmas. We also observed in all five ELISAs an interference of the plasma matrix, which becomes negligible when plasma samples are diluted at least 1/5. In the present investigation, all plasma samples were at least diluted 1/5 before assay.
2.4. Statistical analysis
One-way analysis of variance (ANOVA) test were used to perform analyses of correlation between pre-treatment (T0) ICs plasmatic levels in metastatic ccRCC patients before nivolumab treatment.
Fisher’s exact test was used to evaluate the immunotherapy response based on the plasma PD-1, PD-L1, pan-BTN3As, BTN3A1, and BTN2A1 levels, respectively, and the correlation with the IMDC Prognostic Risk Group and number of metastatic sites. Wilcoxon test was used to evaluate paired samples. Pearson’s chi-square test was used for association of sIC with best overall response by RECIST (BOR) and objective response of >20% (OR).
The receiver operating characteristic (ROC) curves analysis were used to determine the optimal cut-off for each marker, in order to classify short-term versus long-term responders.
The analysis of PFS, defined as the time between blood sample collection and progression or death from any cause, was performed using the Kaplan-Meier method and log-rank test. Data were generated using the MedCalc software for Windows, version 18.2.1 (MedCalc Software, Ostend, Belgium). P values <.05 were considered statistically significant.
The optimal cut-off for sPD-1 was 2.11 ng/ml (AUC = 1.0, p value < .001), 0.66 ng/ml for sPD-L1 (AUC = 0.88, p value < .001), 6.84 ng/ml for sBTN3A1, (AUC = 0.815, p value < .001) and 12.73 ng/ml for sBTN3 global (AUC = 0.741, p value < .04); 6.01 ng/ml for sBTN2A1 (AUC = 0.556, p value 0.689).
3. Results
3.1. Patients characteristics
Fifty-six (56) ccRCC patients were included in the study. Twenty-one (21) were metastatic patients of the learning cohort, treated by second line nivolumab, while twenty (20) were patients belonging to an independent validation cohort of mccRCC patients in treatment with nivolumab to confirm the correlation levels between each sIC tested. Fifteen (15) were ccRCC patients with localized disease included in the exploratory analysis. The population clinical characteristics and pathological parameters are summarized in and .
Table 1. Clinical and pathological features of localized RCC patients
Table 2. Clinical and pathological features of metastatic RCC patients
3.2. Baseline Plasma ICs levels as predictive biomarkers of anti-PD-1 treatment outcome in metastatic ccRCC patients
Plasma ICs levels in blood samples from 21 metastatic renal cancer patients of the learning cohort, before nivolumab treatment (T0), were analyzed. The mean levels of sPD1 and sPD-L1 were 2.79 ng/ml (range 0.52–25.00) and 0.62 ng/ml (range 0.26–1.31), respectively.
The same analysis was made on the soluble butyrophilin-like receptors, such as sBTN3global, sBTN3A1, and sBTN2A1. The mean plasma levels were 12.65 ng/ml (range 3.32–28.18), 7.00 ng/ml (range 2.03–24.76), and 8.66 ng/ml (range 5.67–16.93), respectively.
To investigate the predictive role of plasma levels of ICs in the immunotherapy response, levels of sIC before nivolumab treatment (T0) were correlated with PFS and best overall response by RECIST.
We divided the population based on the PFS to nivolumab treatment. Two of 21 patients showed a PFS<6 months, 10/21 patients a PFS between 6 and 18 months, and 9/21 patients a PFS>18 months ()). Comparing the mean pre-treatment (T0) levels of plasma ICs of all patients with the long-responder group (>18 months), sPD1, sPD-L1, and sBTN3A1 were higher in long-responder patients: 13.25 ng/ml (range 1.22–25.0), 1.09 ng/ml (range 0.47–2.41), and 11.03 (9.32–24.76) for sPD-1, sPD-L1, and sBTN3A1, respectively (). These difference were statistically significant (p = .01; p = .02; p = .03) ().
Table 3. Median and range of pretreatment (T0) levels of plasmatic ICs in all mccRCC patients and in long-responders (>18 months) group
Figure 2. PFS (months) to nivolumab treatment in mccRCC patients (a); mean value of plasmatic ICs levels in all nivolumab patients versus long-responders patients (>18 months) (b, c–f)
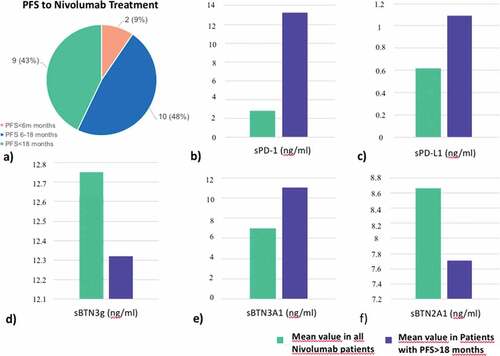
The mean plasma levels of sBTN3 global and sBTN2A1 in patients with PFS>18 months were 12.32 ng/ml (range 7.79–27.77) and 7.71 (range 4.91–10.00) ng/ml, respectively (), but the difference for these three ICs, if compared with all nivolumab patients, was not statistically significant (). For this reason, they were not included in the further survival analyses.
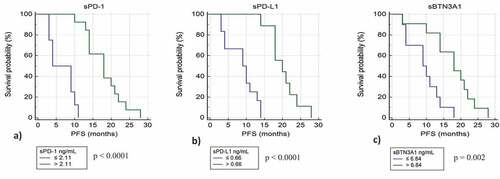
Using specific cut-offs determined by ROC curves, we classified for each immune-checkpoint tested the patients with low and high plasma levels. We plotted the PFS for these patients by Kaplan-Meier curves. For sPD-1, sPD-L1, and sBTN3A1 we observed strong significant differences in median PFS between patients with plasma concentrations above and under thresholds.
Patients with high levels of sPD-1 (>2.11 ng/ml) have a median PFS of 20.7 months compared to 6.9 months for patients with low levels of sPD-1 (p value <.0001) ()). Patients with high levels of sPD-L1 (>0.66 ng/ml) have a median PFS of 19 months compared to 9 months for patients with low levels of sPD-L1 (p value <.0001) ()), and patients with high levels of sBTN3A1 (>6.84 ng/ml) have a median PFS of 17.5 months compared to 8.4 months for patients with low levels of BTN3A1 (p value = .002) ()). The strongest difference in PFS was observed using sPD-1 as biomarker.
Figure 3. Kaplan-Meier analysis of progression free survival in patients from learning cohort with high and low plasma levels of sPD-1 (a), sPD-L1 (b), and sBTN3A1 (c)
The association of sIC with best overall response by RECIST (BOR) and objective response of >20% (OR) were also analyzed. High sPD-1 (>2.11 ng/ml) and sBTN3A1 (>6.84 ng/ml) levels were associated with BOR, but also with favorable OR (objective response of >20%) ().
Table 4. Association of sIC with best overall response by RECIST (BOR) and objective response of >20% (OR)
Investigating the correlation between baseline plasma ICs levels and the number of metastatic sites (≤2 or ≥3), the sPD-L1 and sBTN2A1 levels were significantly higher in the patients with ≥3 sites of disease (sPD-L1 p = .03; sBTN2A1 p = .003). As regards the localization of distant metastases (lung vs other sites), the sPD-L1 and sBTN2A1 levels were increased in patients with non-lung in comparison with only lung metastases (sPD-L1 p = .003; sBTN2A1 p = .01) Association between sPD-L1 levels and IMDC Prognostic Risk Group was also detected. Higher sPD-L1 levels were observed in the intermediate than favorable risk group (p = .003) ().
Table 5. Association between baseline plasma ICs levels and number of metastatic sites, localization of metastasis and IMDC Prognostic Risk Group
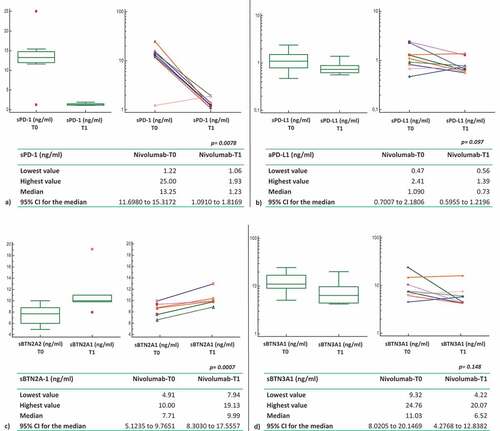
3.3. Comparison T0-T1 of ICs levels in the plasma of mccRCC long responders patients treated with nivolumab
In the population of patients with PFS>18 months, after a 4-weeks period (T1) with nivolumab treatment (2 cycles of nivolumab administration), plasma levels of sPD1 and sPD-L1 were lower than baseline, with a mean of 1.23 ng/ml (range 1.06–1.93) for sPD-1 and 0.73 ng/ml (range 0.56–1.39) for sPD-L1. Unlike sPD-1 and sPD-L1, plasma levels of sBTN2A1 were higher at the 4-weeks period (T1; 9.99 ng/ml; range 7.94–19.13) than baseline (T0; mean 7.71 ng/ml; range 4.91–10.0). While the Wilcoxon test for paired samples showed a statistically significant difference between T0 and T1 for both sPD1 and sBTN2A1 (sPD1: T0 vs T1 p = .0078; sBTN2A1 T0 vs T1 p = .0007), probably the small number of analyzed samples did not allow us to demonstrate a statistically significant difference in T0-T1 sPD-L1 levels (p = .097).
Changes in plasma levels are showed also for sBTN3A1 and sBTN3 global, but these difference T0-T1 did not reach statistical significance ().
Figure 4. Comparison T0-T1 of ICs levels in the plasma of mccRCC long responders patients treated with nivolumab
3.4. Exploratory analysis: comparison of plasma ICs levels in metastatic versus localized ccRCC patients
Plasma ICs levels in samples from 15 localized renal cancer patients were analyzed before surgery and the correlation with the metastatic cohort was investigated. Concentrations of sPD-1 and sPD-L1 were statistically higher in the plasma of metastatic compared to localized RCC patients. Mean sPD-1 in localized group was 1.54 ng/ml (range 0.55–3.91) vs mean sPD-1 in metastatic group 2.79 ng/ml (range 0.52–25.00). Mean sPD-L1 in localized group was 0.49 ng/ml (range 0.25–0.69) vs mean sPD-L1 in metastatic group 0.62 ng/ml (range 0.26–2.41) (sPD-1 p = .003; sPD-L1 p = .03) ().
Figure 5. ICs in RCC patients: localized vs metastatic disease at baseline (pretreatment)
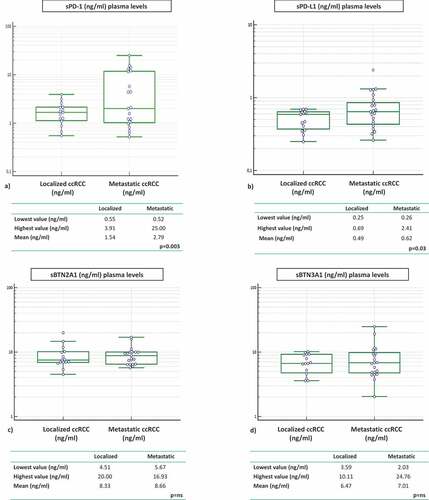
The same observation was made with the soluble butyrophilin-like receptors sBTN2A1 and sBTN3A1. Mean values were higher in the group of metastatic compared to the group of localized patients, but the difference between the two groups is not statistically significant (BTN2A1: 8.33 vs 8.66 ng/ml; BTN3A1: 6.47 vs 7.01 ng/ml) ().
3.5. Validation in a prospectively collected patient cohort
We used 20 independent blood samples from mccRCC patients in order to confirm the predictive value of tested markers. In this cohort, the optimal cut-off was 1.31 ng/ml (AUC = 1.0, p value < .001) for sPD-1, 0.73 ng/ml for sPD-L1 (AUC = 0.944, p value < .001), 3.8 ng/ml for sBTN3A1 (AUC = 0.806, p value < .03), 5.11 ng/ml for sBTN3 global (AUC = 0.833, p value < .01), and 9.12 ng/ml for sBTN2A1 (AUC = 0.708, p value 0.23).
Next, we applied on the validation cohort the threshold levels previously determined in learning cohort by the ROC curves. As expected, we found a significative correlation between PFS to anti-PD-1 treatment and high basal expression levels in plasma for sPD-1, sPD-L1, and sBTN3A1. These results confirmed our previous observation made in the learning cohort and allowed to discriminate short versus long-responders to nivolumab therapy in the validation cohort. Patients with high levels of sPD-1 (>2.11 ng/ml) had a median PFS of 16.6 months compared to 9.7 months for patients with low levels of sPD-1 (p value = .002); patients with high levels of sPD-L1 (>0.66 ng/ml) had a median PFS of 15.7 months compared to 8.6 months for patients with low levels of sPD-L1 (p value <.003). Concerning patients with high levels of sBTN3A1 (>6.84 ng/ml), they had a median PFS of 16.9 months compared to 7.8 months for patients with low levels of BTN3A1 (p value < .001).
4. Discussion
Despite a proportion of mRCC patients can experiment marked and durable responses to immune-checkpoints inhibitors (ICIs), the treatment efficacy is variable, and a considerable number of patients is resistant to PD-1/PD-L1 inhibition. Thus, in order to maximize the patient benefit, combination therapies (ipilimumab plus nivolumab and combinations of ICI with VEGFR TKIs) to improve response rates have been studied in first-line treatment, and predictive biomarkers to select those patients that are most likely to have a good response are steadily under investigation.
It is expected that PD-L1 should be expressed for enhancing the anti-PD-L1/PD-1 treatment efficacy, but the results of correlation between IHC assays for PD-L1 expression on tumor tissue and ICI response are heterogeneous and contradictory. The reasons could be manifold: the expression of immune-checkpoints is a dynamic process and the PD-L1 evaluation on tumor tissue at a single time-point can be suboptimal, not only for several limitations related to tissue sampling and IHC detection methods, but also due to discordant expression between the primary tumor and metastatic sites, heterogeneous within the itself tumor and influenced by temporal and spatial variability of the cancer evolution and treatment.
Accordingly, the PD-L1 status is an imperfect predictive biomarker and identifying patients who will likely benefit from immunotherapy remains, to date, poorly predictable in daily clinical practice. Therefore, there is a great and intensive work to develop reproducible and dynamic biomarkers for therapeutic decisions in the clinic.
Previous reports showed that soluble PD-L1 levels in the blood of various malignancies is elevated.Citation28–33 Increasing evidence now shows that sPD-L1 expression might be a prognostic factor in different type of solid cancers but with heterogeneous results. Patients with high blood sPD-L1 levels seem to have a poorer prognosis and reduced survival than those with low levels in melanoma and nonsmall-cell lung cancer (NSCLC). Conversely, in gastric cancer, high levels were associated with a favorable prognosis. These contradictory results do not allow clear conclusions regarding prognostic relevance of sPD-L1.Citation32,Citation34–38
Also in renal cell carcinoma the prognostic role of soluble immune checkpoint-related proteins has not been still clearly elucidated. Frigola et al. showed for the first time that elevated preoperative serum level of soluble PD-L1 were associated with an increased risk of death in ccRCC patients.Citation28 In a subsequent study, the authors identified some ICs (sTIM3, sLAG3, sBTLA, and sPD-L2) associated with recurrence risk and clinical outcomes of ccRCC patients, while, conversely, sPD-L1 and sPD-1 not seem to have a prognostic value in the same cohort of patients.Citation39 Finally, in another study, it was reported that serum level of sPD-L1 were highest in patients with elevated tumor grade, regional lymph nodes and distant metastases, and, surprisingly, in patients with lower tumor size than T4 tumors.Citation40
In our cohort, for the first time compared to previous studies, the concentrations of soluble ICs were analyzed in the plasma of the patients, because we presume that test performed on plasma are more reliable than in serum. The comparison between metastatic and localized ccRCC patients showed higher median values of all plasma ICs levels in the metastatic cohort, with results statistically significant for sPD-1 and sPD-L1. sPD-L1 concentrations were also correlated with the tumor burden, evaluated according to the number of metastatic sites, and the IMDC Prognostic Risk Groups While the role of sPD-1 is yet to be elucidated, the results related to sPD-L1 might be explained by the recent knowledges on soluble form of PD-L1 molecules, derived from an alternative splicing of PD-L1 mRNA or from a proteolytic cleavage of membrane-bound PD-L1, and proposed as a potential mechanism used by tumor cells to escape from T-lymphocytes-mediated immune surveillance.Citation41
The findings of higher sPD-L1 levels in the intermediate-risk subgroup than favorable, and in patients with non-lung metastases, confirms previous literature data on poorer outcome of bone or liver metastases than lung metastasesCitation3 and highlights the potential prognostic impact of sPD-L1.
Although it is interesting to investigate the prognostic role of circulating ICs, the current need is to develop potential blood-based biomarkers predictive of antitumor effect of immune-checkpoint blockade therapy in advanced patients.
With this goal, we performed the first prospective study in renal cancer patients to investigate if soluble form of ICs could be candidate to predict the response to immunotherapy.
In our study high baseline levels of sPD-1, sPD-L1, and sBTN3A1 were associated with a longer PFS to nivolumab treatment. High sPD-1 and sBTN3A1 levels were also associated with best overall response by RECIST and objective response of >20%. The strongest predictive biomarker is resulted to be sPD-1.
Despite literature data on the predictive significance of sPD-1 are still lacking, a possible explanation is suggested by its potential proimmunologic role. Previous studies proposed that the soluble form of PD-1 binds the PD-L1 on cancer cells membrane, preventing the interaction with its PD-1 natural ligand, thus limiting the coinhibitory signal on T lymphocytes and consequently enhancing antitumor response.Citation41 The biological reason why elevated plasma sPD-1 is associated with better response to nivolumab could be explained by these observations. Thus, patients with high levels of sPD-1 may benefit from synergic effect of proimmunologic sPD-1 and anti-PD-1 antibody nivolumab.
In this context, the clear and statistically significant decrease of sPD-1 detected after two cycles of nivolumab (Day 28) in the long-responder patients can be elucidated. In these patients, changes in sPD-1 plasma levels suggest an efficient PD-1 targeting by nivolumab treatment. Conversely, compared to baseline, at the same time-point (Day 28) sPD-1 levels were significantly increased in patients with PD as best response. Monitoring sPD-1 kinetics at day 28 may be helpful to the clinician to identify nonresponders mRCC patients before the first radiological evaluation.
As regards sPD-L1, as mentioned before, this molecule is mainly released by tumor cells. As well as tumor PD-L1 expression has been the most commonly explored biomarker for predicting response to anti-PD-1 antibodies, similarly its soluble form could have the same meaning. In mRCC, an increased response rate or improved PFS was seen in patients with PD-L1+ tumors in some trials, including the phase II trial of nivolumab,Citation16 the KEYNOTE-427 with pembrolizumab monotherapy,Citation42 and the CheckMate 214Citation43 with the combination of nivolumab-ipilimumab. Our findings on sPD-L1 differ from previous published studies in other tumor types which, despite the patient numbers too small to draw any significant conclusions, showed that elevate baseline expression of sPD-L1 in NSCLC and melanoma patients treated with anti-PD-1 therapy may be predictive of treatment failure.
However, one further consideration is related to the peculiarities of the RCC where, more than in the lung cancer and melanoma, the results on predictive value of PD-L1 expression have been very heterogeneous and not fully understood.
Finally, our study reveals that baseline soluble concentrations of another immune-checkpoint, BTN3A1, were higher in long responders patients and associated with best overall response and objective response rate to nivolumab treatment. BTN3A1 is a protein belonging to the butyrophilin 3A subfamily, recently implicated in cancer immune surveillance. The BTN3A isoforms is overexpressed in several tumors and involved in the antitumor function of Vγ9Vδ2 cytolytic T-cells.Citation27 The findings in this study confirm its involvement in the anti-tumor immune response and a potential role as target of novel antitumoral treatments.
In conclusion, in this study we showed that the plasma levels of soluble PD-1, PD-L1 and BTN3A1 can predict response to nivolumab in metastatic clear cell renal carcinoma, discriminating responders from non-responders already at therapy baseline, with the advantages of non-invasive sample collection and real-time monitoring that allow to to assess the dynamic changes during cancer evolution and treatment. Future studies in a larger patient cohort should be encouraged to confirm these preliminary results.
Disclosure of potential conflicts of interest
The authors report no conflict of interest.
Supplemental Material
Download ()Supplementary material
Supplemental data for this article can be accessed on the publisher’s website.
References
- Inamura K. Renal Cell Tumors: understanding Their Molecular Pathological Epidemiology and the 2016 WHO Classification. Int J Mol Sci. 2017;18(10):2195. doi:10.3390/ijms18102195.
- Hsieh JJ, Le V, Cao D, Cheng EH, Creighton CJ. Genomic classifications of renal cell carcinoma: a critical step towards the future application of personalized kidney cancer care with pan-omics precision. J Pathol. 2018;244(5):525–11. doi:10.1002/path.5022.
- Dutcher JP. Update on the biology and management of renal cell carcinoma. J Invest Med. 2019;67(1):1–10. doi:10.1136/jim-2018-000918.
- Incorvaia L, Bronte G, Bazan V, Badalamenti G, Rizzo S, Pantuso G, Natoli C, Russo A. Beyond evidence-based data: scientific rationale and tumor behavior to drive sequential and personalized therapeutic strategies for the treatment of metastatic renal cell carcinoma. Oncotarget. 2016;7(16):21259–21271. doi:10.18632/oncotarget.7267.
- Atkins MB, Tannir NM. Current and emerging therapies for first-line treatment of metastatic clear cell renal cell carcinoma. Cancer Treat Rev. 2018;70:127–137. doi:10.1016/j.ctrv.2018.07.009.
- Posadas EM, Limvorasak S, Figlin RA. Targeted therapies for renal cell carcinoma. Nat Rev Nephrol. 2017;13(8):496–511. doi:10.1038/nrneph.2017.82.
- Alonso-Gordoa T, García-Bermejo ML, Grande E, Garrido P, Carrato A, Molina-Cerrillo J. Targeting tyrosine kinases in renal cell carcinoma: “New Bullets Against Old Guys”. Int J Mol Sci. 2019;20(8):1901. doi:10.3390/ijms20081901.
- Heidegger I, Pircher A, Pichler R. Targeting the tumor microenvironment in renal cell cancer biology and therapy. Front Oncol. 2019;9. doi:10.3389/fonc.2019.00490.
- George S, Rini BI, Hammers HJ. Emerging role of combination immunotherapy in the first-line treatment of advanced renal cell carcinoma. JAMA Oncol. 2019;5(3):411. doi:10.1001/jamaoncol.2018.4604.
- Roviello G, Corona SP, Nesi G, Mini E. Results from a meta-analysis of immune checkpoint inhibitors in first-line renal cancer patients: does PD-L1 matter? Ther Adv Med Oncol. 2019;11:175883591986190. doi:10.1177/1758835919861905.
- Braren V, Taylor JN, Pace W. Regression of metastatic renal carcinoma following nephrectomy. Urology. 1974;3(6):777–778. doi:10.1016/s0090-4295(74)80225-6.
- Pardoll DM. The blockade of immune checkpoints in cancer immunotherapy. Nat Rev Cancer. 2012;12(4):252–264. doi:10.1038/nrc3239.
- Pitt JM, Marabelle A, Eggermont A, Soria JC, Kroemer G, Zitvogel L. Targeting the tumor microenvironment: removing obstruction to anticancer immune responses and immunotherapy. Ann Oncol. 2016;27(8):1482–1492. doi:10.1093/annonc/mdw168.
- Badalamenti G, Fanale D, Incorvaia L, Barraco N, Listì A, Maragliano R, et al. Role of tumor-infiltrating lymphocytes in patients with solid tumors: can a drop dig a stone? Cell Immunol. 2018;103753. doi:10.1016/j.cellimm.2018.01.013.
- Motzer RJ, Escudier B, McDermott DF, George S, Hammers HJ, Srinivas S, Tykodi SS, Sosman JA, Procopio G, Plimack ER. Nivolumab versus everolimus in advanced renal-cell carcinoma. N Engl J Med. 2015;373(19):1803–1813. doi:10.1056/NEJMoa1510665.
- Motzer RJ, Rini BI, McDermott DF, Redman BG, Kuzel TM, Harrison MR, Vaishampayan UN, Drabkin HA, George S, Logan TF, et al. Nivolumab for metastatic renal cell carcinoma: results of a randomized phase II trial. J Clin Oncol. 2015;33(13):1430–1437. doi:10.1200/jco.2014.59.0703.
- Motzer RJ, Tannir NM, McDermott DF, Arén Frontera O, Melichar B, Choueiri TK, Plimack ER, Barthélémy P, Porta C, George S, et al. Nivolumab plus ipilimumab versus sunitinib in advanced renal-cell carcinoma. N Engl J Med. 2018;378(14):1277–1290. doi:10.1056/NEJMoa1712126.
- McDermott DF, Choueiri TK, Motzer RJ, Aren OR, George S, Powles T, Donskov F, Harrison MR, Rodriguez Cid JRR, Ishii Y, et al. CheckMate 214 post-hoc analyses of nivolumab plus ipilimumab or sunitinib in IMDC intermediate/poor-risk patients with previously untreated advanced renal cell carcinoma with sarcomatoid features. J Clin Oncol. 2019;37(15_suppl):4513. doi:10.1200/JCO.2019.37.15_suppl.4513.
- Choueiri TK, Motzer RJ, Rini BI, Haanen J, Campbell MT, Venugopal B, Kollmannsberger C, Gravis-Mescam G, Uemura M, Lee JL, et al. Updated efficacy results from the JAVELIN Renal 101 trial: first-line avelumab plus axitinib versus sunitinib in patients with advanced renal cell carcinoma. Ann Oncol. 2020;31(8):1030–1039. doi:10.1016/j.annonc.2020.04.010.
- Rini BI, Plimack ER, Stus V, Gafanov R, Hawkins R, Nosov D, Pouliot F, Alekseev B, Soulières D, Melichar B, et al. Pembrolizumab plus axitinib versus sunitinib for advanced renal-cell carcinoma. N Engl J Med. 2019;380(12):1116–1127. doi:10.1056/NEJMoa1816714.
- Incorvaia L, Fanale D, Badalamenti G, Barraco N, Bono M, Corsini LR, Galvano A, Gristina V, Listì A, Vieni S, et al. Programmed death ligand 1 (PD-L1) as a predictive biomarker for pembrolizumab therapy in patients with advanced non-small-cell lung cancer (NSCLC). Adv Ther. 2019;36(10):2600–2617. doi:10.1007/s12325-019-01057-7.
- Cottrell TR, Taube JM. PD-L1 and emerging biomarkers in immune checkpoint blockade therapy. Cancer J. 2018;24(1):41–46. doi:10.1097/ppo.0000000000000301.
- Fisher R, Pusztai L, Swanton C. Cancer heterogeneity: implications for targeted therapeutics. Br J Cancer. 2013;108(3):479–485. doi:10.1038/bjc.2012.581.
- Melero I, Berman DM, Aznar MA, Korman AJ, Gracia JLP, Haanen J. Evolving synergistic combinations of targeted immunotherapies to combat cancer. Nat Rev Cancer. 2015;15(8):457–472. doi:10.1038/nrc3973.
- Benyamine A, Le Roy A, Mamessier E, Gertner-Dardenne J, Castanier C, Orlanducci F, Pouyet L, Goubard A, Collette Y, Vey N, et al. BTN3A molecules considerably improve Vγ9Vδ2T cells-based immunotherapy in acute myeloid leukemia. OncoImmunology. 2016;5(10):e1146843. doi:10.1080/2162402x.2016.1146843.
- Benyamine A, Loncle C, Foucher E, Blazquez J-L, Castanier C, Chrétien A-S, Modesti M, Secq V, Chouaib S, Gironella M, et al. BTN3A is a prognosis marker and a promising target for Vγ9Vδ2 T cells based-immunotherapy in pancreatic ductal adenocarcinoma (PDAC). OncoImmunology. 2017;7(1):e1372080. doi:10.1080/2162402x.2017.1372080.
- Bian B, Fanale D, Dusetti N, Roque J, Pastor S, Chretien A-S, Incorvaia L, Russo A, Olive D, Iovanna J, et al. Prognostic significance of circulating PD-1, PD-L1, pan-BTN3As, BTN3A1 and BTLA in patients with pancreatic adenocarcinoma. OncoImmunology. 2019;8(4):e1561120. doi:10.1080/2162402x.2018.1561120.
- Frigola X, Inman BA, Lohse CM, Krco CJ, Cheville JC, Thompson RH, Leibovich B, Blute ML, Dong H, Kwon ED, et al. Identification of a soluble form of B7-H1 that retains immunosuppressive activity and is associated with aggressive renal cell carcinoma. Clin Cancer Res. 2011;17(7):1915–1923. doi:10.1158/1078-0432.ccr-10-0250.
- Rossille D, Gressier M, Damotte D, Maucort-Boulch D, Pangault C, Semana G, Le Gouill S, Haioun C, Tarte K, Lamy T, et al. High level of soluble programmed cell death ligand 1 in blood impacts overall survival in aggressive diffuse large B-Cell lymphoma: results from a French multicenter clinical trial. Leukemia. 2014;28(12):2367–2375. doi:10.1038/leu.2014.137.
- Wang L, Wang H, Chen H, Wang W-D, Chen X-Q, Geng Q-R, Xia Z-J, Lu Y. Serum levels of soluble programmed death ligand 1 predict treatment response and progression free survival in multiple myeloma. Oncotarget. 2015;6(38):41228–41236. doi:10.18632/oncotarget.5682.
- Finkelmeier F, Canli Ö, Tal A, Pleli T, Trojan J, Schmidt M, Kronenberger B, Zeuzem S, Piiper A, Greten FR. High levels of the soluble programmed death-ligand (sPD-L1) identify hepatocellular carcinoma patients with a poor prognosis. Eur J Cancer. 2016;59:152–159. doi:10.1016/j.ejca.2016.03.002.
- Takahashi N, Iwasa S, Sasaki Y, Shoji H, Honma Y, Takashima A, Okita NT, Kato K, Hamaguchi T, Yamada Y, et al. Serum levels of soluble programmed cell death ligand 1 as a prognostic factor on the first-line treatment of metastatic or recurrent gastric cancer. J Cancer Res Clin Oncol. 2016;142(8):1727–1738. doi:10.1007/s00432-016-2184-6.
- Okuma Y, Hosomi Y, Nakahara Y, Watanabe K, Sagawa Y, Homma S. High plasma levels of soluble programmed cell death ligand 1 are prognostic for reduced survival in advanced lung cancer. Lung Cancer. 2017;104:1–6. doi:10.1016/j.lungcan.2016.11.023.
- Shigemori T, Toiyama Y, Okugawa Y, Yamamoto A, Yin C, Narumi A, Ichikawa T, Ide S, Shimura T, Fujikawa H, et al. Soluble PD-L1 expression in circulation as a predictive marker for recurrence and prognosis in gastric cancer: direct comparison of the clinical burden between tissue and serum PD-L1 expression. Ann Surg Oncol. 2018;26(3):876–883. doi:10.1245/s10434-018-07112-x.
- Han X, Gu Y-K, Li S-L, Chen H, Chen M-S, Cai -Q-Q, Deng H-X, Zuo M-X, Huang J-H. Pre-treatment serum levels of soluble programmed cell death-ligand 1 predict prognosis in patients with hepatitis B-related hepatocellular carcinoma. J Cancer Res Clin Oncol. 2018;145(2):303–312. doi:10.1007/s00432-018-2758-6.
- Ha H, Nam A-R, Bang J-H, Park J-E, Kim T-Y, Lee K-H, Han S-W, Im S-A, Kim T-Y, Bang Y-J. Soluble programmed death-ligand 1 (sPDL1) and neutrophil-to-lymphocyte ratio (NLR) predicts survival in advanced biliary tract cancer patients treated with palliative chemotherapy. Oncotarget. 2016;7(47):76604–76612. doi:10.18632/oncotarget.12810.
- Zhou J, Mahoney KM, Giobbie-Hurder A, Zhao F, Lee S, Liao X, Rodig S, Li J, Wu X, Butterfield LH, et al. Soluble PD-L1 as a biomarker in malignant melanoma treated with checkpoint blockade. Cancer Immunol Res. 2017;5(6):480–492. doi:10.1158/2326-6066.cir-16-0329.
- Incorvaia L, Badalamenti G, Rinaldi G, Iovanna JL, Olive D, Swayden M, Terruso L, Vincenzi B, Fulfaro F, Bazan V, et al. Can the plasma PD-1 levels predict the presence and efficiency of tumor-infiltrating lymphocytes in patients with metastatic melanoma? Ther Adv Med Oncol. 2019;11:175883591984887. doi:10.1177/1758835919848872.
- Wang Q, Zhang J, Tu H, Liang D, Chang DW, Ye Y, Wu X. Soluble immune checkpoint-related proteins as predictors of tumor recurrence, survival, and T cell phenotypes in clear cell renal cell carcinoma patients. J ImmunoTher Cancer. 2019;7(1). doi:10.1186/s40425-019-0810-y.
- Kushlinskii NE, Gershtein ES, Morozov AA, Goryacheva IO, Filipenko ML, Alferov AA, Bezhanova SD, Bazaev VV, Kazantseva IA. Soluble ligand of the immune checkpoint receptor (sPD-L1) in blood serum of patients with renal cell carcinoma. Bull Exp Biol Med. 2019;166(3):353–357. doi:10.1007/s10517-019-04349-8.
- Tiako Meyo M, Jouinot A, Giroux-Leprieur E, Fabre E, Wislez M, Alifano M, Leroy K, Boudou-Rouquette P, Tlemsani C, Khoudour N. Predictive value of soluble PD-1, PD-L1, VEGFA, CD40 Ligand and CD44 for nivolumab therapy in advanced non-small cell lung cancer: a case-control study. Cancers. 2020;12(2):473. doi:10.3390/cancers12020473.
- McDermott DF, Lee J-L, Szczylik C, Donskov F, Malik J, Alekseev BY, Larkin JMG, Matveev VB, Gafanov RA, Tomczak P, et al. Pembrolizumab monotherapy as first-line therapy in advanced clear cell renal cell carcinoma (accRCC): results from cohort A of KEYNOTE-427.. J Clin Oncol. 2018;36(15_suppl):4500. doi:10.1200/JCO.2018.36.15_suppl.4500.
- Motzer RJ, Rini BI, McDermott DF, Arén Frontera O, Hammers HJ, Carducci MA, Salman P, Beuselinck B, Amin A, et al. Nivolumab plus ipilimumab versus sunitinib in first-line treatment for advanced renal cell carcinoma: extended follow-up of efficacy and safety results from a randomised, controlled, phase 3 trial. Lancet Oncol. 2019;20(10):1370–1385. doi:10.1016/s1470-2045(19)30413-9.