
 ?Mathematical formulae have been encoded as MathML and are displayed in this HTML version using MathJax in order to improve their display. Uncheck the box to turn MathJax off. This feature requires Javascript. Click on a formula to zoom.
ABSTRACT
Computerized image analysis for whole-slide images has been shown to improve efficiency, accuracy, and consistency in histopathology evaluations. We aimed to assess whether immunohistochemistry (IHC) image quantitative features can reflect the immune status and provide prognostic information for colorectal cancer patients. A fully automated pipeline was designed to extract histogram features from IHC digital images in a training set (N = 243). A Hist-Immune signature was generated with selected features using the LASSO Cox model. The results were validated using internal (N = 147) and external (N = 76) validation sets. The five-feature-based Hist-Immune signature was significantly associated with overall survival in training (HR 2.72, 95% CI 1.68–4.41, P < .001), internal (2.86, 1.28–6.39, 0.010), and external (2.30, 1.02–6.16, 0.044) validation sets. The full model constructed by integrating the Hist-Immune signature and clinicopathological factors had good discrimination ability (C-index 0.727, 95% CI 0.678–0.776), confirmed using internal (0.703, 0.621–0.784) and external (0.756, 0.653–0.859) validation sets. Our findings indicate that the Hist-Immune signature constructed based on the quantitative features could reflect the immune status of patients with colorectal cancer, which might advocate change in risk stratification and consequent precision medicine.
1. Introduction
The clinical outcome of colorectal cancer (CRC) patients mainly relies on the tumor-node-metastasis (TNM) classification system.Citation1 This system is valuable but provides incomplete prognostic information, given that clinical prognosis can vary substantially across patients with the same tumor stage.Citation2 Many new classification methods that focus on tumor cells, tumor gene expression, mutation status, etc., have been explored to overcome TNM limits.Citation3 However, these tumor cells-based novel approaches only have a moderate prediction performance and limited clinical usefulness.Citation4 Accumulating evidence suggests that cancer progression and recurrence are governed not only by genetic profiles intrinsic to tumor cells but also by host anti-tumor immune response.Citation5
Recently, the role of tumor-infiltrating lymphocytes (TILs) in anti-tumor immune response became evident. The influence of the intratumor location, type, and density of TILs on CRC evolution has been extensively investigated.Citation6 Nowadays, an Immunoscore classification tool was proposed as a prognostic factor in colon cancer, which summarizing the density of CD3+ and CD8+ T cells infiltration within the tumor region and tumor invasion margin on the whole-slide image (WSI).Citation7 A machine learning-based pipeline for quantifying intraepithelial and stromal tumor-infiltrating lymphocytes (iTILs and sTILs) was also established, which could subgroup resected and chemotherapy-treated CRCs.Citation8 While manual evaluation is indispensable during the Immunoscore calculation or TILs quantification process. As the semi-automatic scoring method, the process is not easily scalable. Several studies have also shown that the combinational TILs and other risk factors improve the prognosis accuracy of patients with stage II CRC.Citation9,Citation10 Multiplexed immunofluorescence WSIs were used for automated image analysis in these studies. However, there is still a need for a fully automated image analysis using the whole immunohistochemical (IHC) slide image, which is more common in clinical practice.
On the other hand, feature-based image analysis has shown potential improvement for efficiency, accuracy, and reproducibility in the quantitative histopathology evaluation.Citation11–13 High-throughput quantitative features (such as histogram feature) extracted from digital pathology images are potentially useful for characterizing positively stained cells and spatial distribution patterns.Citation14,Citation15 It is possible to identify previously unrecognized image features relevant to patient’s prognosis and potentially guide treatment decision.Citation11 However, previous studies mostly used hematoxylin and eosin (HE) stained histopathology images for feature extraction and prognosis analysis.Citation11,Citation16 Unlike the whole immunohistochemical slide image, the HE-stained image can not accurately reflect the type and distribution of immune cells. There exists the opportunity for using IHC image features to quantify the immune status of CRC patients.
Therefore, we hypothesize that quantitative features of immunohistochemical images can reflect the immune status and provide prognostic information for colorectal cancer patients. Moreover, we aim to investigate whether the signature constructed by histogram features could improve outcome prediction accuracy.
2. Materials and methods
2.1. Patients
This retrospective study was approved by The Research Ethics Committee of Guangdong Provincial People’s Hospital (GDREC2020011H) and Institutional Review Board of Yunnan Cancer Hospital (KY201824). The requirement of informed consent given the anonymous data analysis was waived. In this multicentre study, data analysis was applied retrospectively to two independent cohorts (Cohort 1, Guangdong Provincial People’s Hospital; Cohort 2, Yunnan Cancer Hospital) of patients with the American Joint Committee on Cancer (7th Edition) TNM stage I–III colorectal cancer who underwent curative-intent surgery. The inclusion and exclusion criteria for the current study are listed in the supplemental material.
In Cohort 1 (N = 390, Mar 2009 to Dec 2014), patients from Mar 2009 to Oct 2013 formed the training set (N = 243), while the remaining patients served as the internal validation set (N = 147). An independent external validation data set (N = 76) between Jan 2013 and Dec 2014 from Cohort 2 was also established.
2.2. Follow up
The primary outcome was overall survival (OS) in our study, which is defined as the time from surgery to death from any cause. Those who were still alive at the last reported date were labeled as censored data. The follow-up data were available until the end of December 2019. The outcome was ascertained by investigators who were blinded to predictors. Clinicopathologic information, including age at diagnosis, sex, TNM classification, grade of differentiation, and anatomic site, were obtained from the medical records archives.
2.3. Sample size and missing value
The study met the suggested requirements of having at least ten events per candidate variable for the derivation of a model, and the sample size of the training set was comparable to those in similar studies.Citation17–19 The sample size for the internal and external validation sets was based on tissue availability. Patients with missing data were excluded, and the imputation method was not used in the analysis.
2.4. Acquisition of the digital whole slide images
Referring to the Immunoscores generation process,Citation7 we chose CD3 and CD8 staining slides to analyze the immune status quantitatively. Details of the IHC staining procedure for CD3 and CD8 are presented in the supplemental material. The stained tissue sections were imaged using digital Whole Slide Scanning (Leica, Aperio-AT2) at 40× magnification.
2.5. Pipeline of image processing and feature extraction
The study design is shown in . Since immune cells are mainly distributed in tumor and stromal regions, we used the following image processing steps to obtain an automatic region of interest (ROI) for feature extraction. For fast computation, the original scanned image (40×, 0.252 μm/pixel) was downscaled to a low-magnification image (2.5×, 4.032 μm/pixel). The scaled image was filtered with a 2-D Gaussian smoothing kernel with a standard deviation of 15, and a global threshold determined by Otsu’s methodCitation20 was used to binarize the image. The largest connected region was retained as the ROI (Supplemental Figure S1).
And the color deconvolution methodCitation21 was used to extract the DAB channel, which reflected the expression of positive cells (Supplemental Figure S2). Then histogram features were extracted automatically from the DAB channels of CD3 and CD8 staining images within ROI using in-house MATLAB-based software. Two basic feature groups of gray level histogram were used: 1) consisted of mean, variance, skewness, kurtosis, and 5th to 10th central moment of the histogram (a total of 10 features); 2) contained the percentile of the gray level histogram at 2.5%, 25%, 50%, 75%, and 97.5% (a total of 5 features). Overall, 30 features were calculated in our study for further analysis. Details of the feature definitions are provided in the supplemental material.
2.6. Feature selection and signature building
The least absolute shrinkage and selection operator (LASSO) Cox regression analysis was used to select related prognostic features in the training set. A Hist-Immune signature was built via a linear weighted combination of selected histogram features. A Hist-Immune score of each patient was calculated by using the signature.
2.7. Evaluation and validation of the Hist-Immune signature
The possible association between the Hist-Immune signature and survival was investigated in the training set, then validated in internal and external validation sets. The Hist-Immune score values were normalized to a range of 0 to 100% by using a logistic function . Patients were then stratified into high-risk or low-risk groups using a threshold value of 50% across the three sets, and the Kaplan-Meier method was used to visualize survival curves. The difference between both curves was determined via the log-rank test.
Stratified analyses were conducted to confirm the potential association between the Hist-Immune signature and overall survival within subgroups of TNM stage and clinicopathologic risk factors from the whole dataset.
2.8. Construction, evaluation, and validation of the full model
Univariate and multivariate Cox regression analysis was employed for investigating the association between survival time and multivariate predictors, and regression coefficients were used to generate a full model. Meanwhile, to investigate whether the Hist-Immune signature have additional prognostic value to the clinicopathologic risk factors, a clinical model was constructed by only incorporating the independent clinicopathologic factors selected in the multivariate analysis. The discrimination ability of models was determined using Harrell’s C-statistics (C-index). The time-dependent receiver operating characteristic (ROC) curve with area under the curve (AUC) at 5-year OS was used to evaluate the prognostic accuracy. The time-dependent AUC curve was also plotted. The full model formed in the training set was validated in the internal and external validation sets to test the reproducibility and generalizability. The Hist-Immune signature’s incremental value to the clinical model for 5-year OS prediction was evaluated via the net reclassification improvement (NRI) calculation.
2.9. Statistical analysis
Statistical data analysis was conducted using R software (version 3.6.1, http://www.R-project.org).Citation22 R packages used in this study are presented in the supplemental material. Statistical significance was recorded if the two-sided P < .05.
3. Results
3.1. Patients
According to the inclusion and exclusion criteria, a flow chart summarized the eligible patients identified in this study (Supplemental Figure S3). Finally, 243 patients (aged 63.5 ± 12.4 years) formed the training set, and 147 patients (62.3 ± 11.7 years) formed the internal validation set from Cohort 1. An independent external validation set (N = 76; 56.1 ± 13.6 years) from Cohort 2 was also established. The median follow-up period was 92 months in Cohort 1 and 70 months in Cohort 2. Supplemental Table S1 shows a detailed distribution of the clinicopathological characteristics of the training, internal, and external validation sets.
3.2. Feature selection and signature building
Of 30 IHC quantitative features, five were selected in the LASSO Cox regression analysis. The Hist-Immune signature was then constructed with the selected five features, and a score was calculated for each patient. The selected features and corresponding coefficients are listed in the Supplemental Table S2.
3.3. Evaluation and validation of the Hist-Immune signature
The Hist-Immune signature was statistically associated with OS in the training set (hazard ratio [HR] 2.72, 95% confidence interval [CI] 1.68–4.41, P < .001), which was validated in the internal (2.86, 1.28–6.39, 0.010) and external (2.30, 1.02–6.16, 0.044) validation sets.
Using 50% as the threshold for the normalized Hist-Immune score, we included the patients with a value of 50% or higher in the high-risk group and those with a value lower than 50% in the low-risk group. When we evaluate the distribution of patients’ scores and survival statutes, lower risk score patients generally had better survival outcomes than higher risk score patients (). The 1-year, 3-year, and 5-year OS rates in the high-risk and low-risk groups of three sets are presented in . In the training set, overall survival at 5-year was recorded for 68 (62.4%, 95% CI 53.9%-72.2%) patients in the high-risk group and 109 (81.3%, 75.0%-85.2%) patients in the low-risk group. These findings were confirmed in both internal and external validation sets (,c, ).
Table 1. The five-year overall survival rate in high-risk and low-risk groups of Hist-Immune signature
According to the Hist-Immune signature, the Kaplan-Meier curves were plotted in two cohorts of patients stratified by tumor TNM stage I, II, and III (Supplemental Figure S4). Patients with stage II and III in the high-risk group had a shorter survival time than those in the low-risk group (P = .051 for stage II at marginally significant tendency, P = .013 for stage III). While for patients with stage I disease, although no statistical association was found between the Hist-Immune signature and OS (P = .130), we observed a tendency that patients with high-risk scores had a poor prognosis. When stratified by clinicopathologic risk factors, the Hist-Immune signature remained a significant prognostic factor (Supplemental Figure S5).
3.4. Construction and evaluation of the full model
After univariate and multivariate analyses, we identified Hist-Immune signature, age, and TNM stage as independent predictors for OS (). The full model incorporating the above independent predictors and a clinical model with only TNM stage and age were developed. The full model showed better discrimination performance than the clinical model (C-index, 0.727 vs. 0.694, ).
Table 2. Unadjusted and multivariate analyses for overall survival
Table 3. Discrimination ability of models in the training, internal, and external validation sets
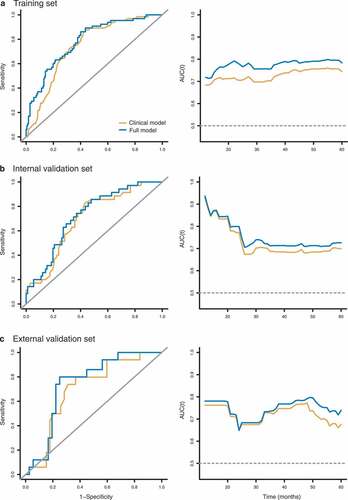
The time-dependent ROC at 5-year and the time-dependent AUC curves at varying times are presented in . The full model had the highest AUC at every time point compared to the clinical model. The full model showed significantly improved 5-year OS predictive performance compared to the clinical model (NRI 0.361, 95% CI 0.082–0.639, P = .010, Supplemental Table S3).
3.5. Validation of the full model
Internal validation: In the internal validation set, the full model yielded a higher C-index of 0.703 (95% CI 0.621–0.784) than the clinical model (0.682, 0.598–0.765). Time dependent AUC showed that the full model achieved the highest AUC values at all time points (12–60 months) for the clinical model. The incremental value of adding the Hist-Immune signature to the full model was statistically significant compared to the clinical model (NRI 0.450, 95% CI 0.085–0.815, P = .020).
External validation: A higher C-index was observed for the full model than the clinical model in the external validation set (0.756 vs. 0.705). AUCs were higher for the full model than the others at each time point. Significant performance improvement was observed when the Hist-Immune signature was integrated into the full model (NRI 0.533, 95% CI 0.310–0.757, P < .001).
4. Discussion
This study presents a fully automated pipeline that identified the objective histogram features of immunohistochemical images. We build a Hist-Immune signature in the training set with selected features and validate its prognostic value in two validation sets. Our results show that the immune-related signature could reflect the immune status of patients with colorectal cancer. In addition, through developing a full model, which incorporates the Hist-Immune signature and clinicopathologic factors, we found that the Hist-Immune signature has incremental prognostic value comparing with the model only involving clinicopathologic predictors.
In recent years, comprehensive immune cell profiling studies have moved to the forefront of cancer research.Citation23–25 Some data collected from the CRC cohort showed that the status of infiltrating lymphocytes in localized tumors has potential prognostic implications for OS and disease-free survival.Citation7,Citation26,Citation27 Image biomarker-driven precision medicine is prevalent in medical oncology.Citation16,Citation28,Citation29 Several semi-automated methods using IHC images to quantify TILs spatial distribution, such as Immunoscore, were proposed as independent prognostic factors for CRC.Citation7,Citation8,Citation30 Multiplexed immunofluorescence method was also used for automated image analysis, and multi-immune cells spatial interactions combination has been shown increased prognostic value.Citation9,Citation10 In this context, we aimed to investigate the prognostic value of the rapid, fully automated pipeline-identified histogram features of IHC images in a multicentre population. Following a rigorous scientific process, wherein the statistical analyses were performed by an independent and external validation group, our results showed that the Hist-Immune signature built using these objective features could stratify CRC patients into low- and high-risk groups for overall survival. The Hist-Immune signature derived from the rapid, fully automated pipeline could serve as a convenient and robust biomarker for predicting OS in CRC patients.
Our study has three main advantages. First, the Hist-Immune signature generation process is fully automatic, improving repeatability and reducing the pathologist’s workload. While other immune classification methods, such as Immunoscore,Citation7 require the pathologist to delimit the tumor region on WSI manually. Our method is more suitable for large-scale applications with less cost. Secondly, we used the quantitative features extracted from the IHC slide image, which can reflect the type and spatial distribution of immune cells more accurately. In previous studies,Citation11–13 HE stained digital pathology images were often used to derive these features. While HE images contain tumor-infiltrating lymphocyte information but lack information on specific immune cells (e.g., CD3 and CD8). Finally, instead of thousands of quantified features, we used basic, robust, and fast-computable histogram features. Although one study tried to determine lung cancer prognosis using automatically derived image features from HE stained digital histopathology images,Citation11 the thousands of features (9879 quantitative features) make it difficult for clinical utility. While only 30 histogram features used in our study can be quickly evaluated in clinical practice, the method developed in this study is an easy-to-use pipeline for objective and rapid prognostic prediction for patients with colorectal cancer.
We also showed that cancer’s clinical prognosis varies in a manner not fully explained by clinicopathological variables alone, but the Hist-Immune signature contributes to the variance. We identified age, stage, and Hist-Immune signature as independent prognostic factors for overall survival in CRC patients through multivariable analysis. These findings were highly consistent with the results of previous studies.Citation7,Citation27,Citation30 Moreover, we can confirm that the Hist-Immune signature better discriminates patients with varied survival outcomes than established clinicopathologic variables alone.
One limitation of our study is that this analysis was retrospective, which may be susceptible to bias introduced from certain risk factors and the loss of follow up. However, the internal and external validation sets were used to confirm the full model’s performance combining Hist-Immune signature with clinicopathologic factors. Also, the sample size in Cohort 2 was small. The patient in the external validation set had stage II–III colon cancer, which was inconsistent with the training and internal validation sets. However, the final model did well in the external validation set, indicating that the model was robust and insensitive to these differences.
In conclusion, we report a Hist-Immune signature constructed by a fully automated image analysis pipeline, which could reflect the immune status of patients with colorectal cancer and stratify patients by risk. Multivariate analysis further confirmed that the derived signature remained a stage-independent prognostic factor for predicting overall survival. This fully automatic workflow is well suited for risk stratification and decision making in clinical practice.
Figure 1. The pipeline for fully automated image processing and model development. (a) Fully automated image processing method to obtain the DAB channel with the region of interest. (b) Feature extraction, including 1st to 10th histogram and quantile distribution features. (c) The LASSO Cox method for feature selection. (d) Model development and survival analysis
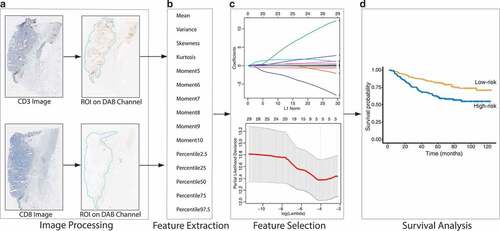
Figure 2. Kaplan-Meier estimates of overall survival according to Hist-Immune signature in the (a) training, (b) internal validation, and (c) external validation sets
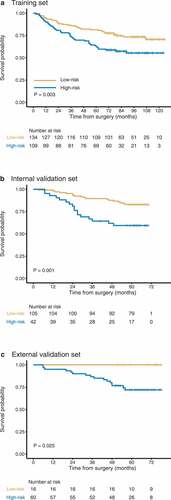
Figure 3. Time-dependent ROC and AUC curves of models in the (a) training, (b) internal validation, and (c) external validation sets. Time-dependent ROC curves were evaluated for 5-year overall survival, and time-dependent AUC curves were plotted for 12 to 60 months
Disclosure of potential conflicts of interest
All the authors have no conflict of interest to declare.
Author’s contributions
Conception and study design: KZ and ZYL; Data acquisition and review of the images: ZHL, SY, YL, YQH, YYW, and LW; Data analysis and interpretation: KZ, FZ, and CHL; Drafting and revising the manuscript: XC and KZ; Final approval of manuscript: All authors.
Supplemental Material
Download ()Supplementary material
Supplemental data for this article can be accessed on the publisher’s website.
Additional information
Funding
References
- Locker GY, Hamilton S, Harris J, Jessup JM, Kemeny N, Macdonald JS, Somerfield MR, Hayes DF, Bast RC. ASCO 2006 update of recommendations for the use of tumor markers in gastrointestinal cancer. JCO. 2006;24(33):5313–8. doi:10.1200/JCO.2006.08.2644.
- Nagtegaal ID, Quirke P, Schmoll H-J. Has the new TNM classification for colorectal cancer improved care? Nat Rev Clin Oncol. 2011;9(2):119–123. doi:10.1038/nrclinonc.2011.157.
- Galon J, Pagès F, Marincola FM, Thurin M, Trinchieri G, Fox BA, Gajewski TF, Ascierto PA. The immune score as a new possible approach for the classification of cancer. J Transl Med. 2012;10(1):1,1479–5876-10–1. doi:10.1186/1479-5876-10-1.
- Fridman WH, Pagès F, Sautès-Fridman C, Galon J. The immune contexture in human tumours: impact on clinical outcome. Nat Rev Cancer. 2012;12(4):298–306. doi:10.1038/nrc3245.
- Cancer Genome Atlas Network. Comprehensive molecular characterization of human colon and rectal cancer. Nature. 2012;487(7407):330–337. doi:10.1038/nature11252.
- Galon J, Costes A, Sanchez-Cabo F, Kirilovsky A, Mlecnik B, Lagorce-Pagès C, Tosolini M, Camus M, Berger A, Wind P, et al. Type, density, and location of immune cells within human colorectal tumors predict clinical outcome. Science. 2006;313(5795):1960–1964. doi:10.1126/science.1129139.
- Pagès F, Mlecnik B, Marliot F, Bindea G, Ou F-S, Bifulco C, Lugli A, Zlobec I, Rau TT, Berger MD, et al. International validation of the consensus Immunoscore for the classification of colon cancer: a prognostic and accuracy study. Lancet. 2018;391(10135):2128–2139. doi:10.1016/S0140-6736(18)30789-X.
- Yoo S-Y, Park HE, Kim JH, Wen X, Jeong S, Cho N-Y, Gwon HG, Kim K, Lee HS, Jeong S-Y, et al. Whole-slide image analysis reveals quantitative landscape of tumor-immune microenvironment in colorectal cancers. Clin Cancer Res. 2020;26(4):870–881. doi:10.1158/1078-0432.CCR-19-1159.
- Nearchou IP, Gwyther BM, Georgiakakis ECT, Gavriel CG, Lillard K, Kajiwara Y, Ueno H, Harrison DJ, Caie PD. Spatial immune profiling of the colorectal tumor microenvironment predicts good outcome in stage II patients. Npj Digit Med. 2020;3(1):71. doi:10.1038/s41746-020-0275-x.
- Nearchou IP, Lillard K, Gavriel CG, Ueno H, Harrison DJ, Caie PD. Automated analysis of lymphocytic infiltration, tumor budding, and their spatial relationship improves prognostic accuracy in colorectal cancer. Cancer Immunol Res. 2019;7(4):609–620. doi:10.1158/2326-6066.CIR-18-0377.
- Yu K-H, Zhang C, Berry GJ, Altman RB, Ré C, Rubin DL, Snyder M. Predicting non-small cell lung cancer prognosis by fully automated microscopic pathology image features. Nat Commun. 2016;7(1):12474. doi:10.1038/ncomms12474.
- Zhang F, Yao S, Li Z, Liang C, Zhao K, Huang Y, Gao Y, Qu J, Li Z, Liu Z. Predicting treatment response to neoadjuvant chemoradiotherapy in local advanced rectal cancer by biopsy digital pathology image features. Clin Transl Med. 2020 Jun;28:ctm2.110. doi:10.1002/ctm2.110.
- Kather JN, Weis C-A, Bianconi F, Melchers SM, Schad LR, Gaiser T, Marx A, Zöllner FG. Multi-class texture analysis in colorectal cancer histology. Sci Rep. 2016;6(1):27988. doi:10.1038/srep27988.
- Yu K-H, Berry GJ, Rubin DL, Ré C, Altman RB, Snyder M. Association of Omics features with histopathology patterns in lung adenocarcinoma. Cell Syst. 2017;5(6):620–627.e3. doi:10.1016/j.cels.2017.10.014.
- Corredor G, Wang X, Zhou Y, Lu C, Fu P, Syrigos K, Rimm DL, Yang M, Romero E, Schalper KA, et al. Spatial architecture and arrangement of tumor-infiltrating lymphocytes for predicting likelihood of recurrence in early-stage non–small cell lung cancer. Clin Cancer Res. 2019;25(5):1526–1534. doi:10.1158/1078-0432.CCR-18-2013.
- Kather JN, Krisam J, Charoentong P, Luedde T, Herpel E, Weis C-A, Gaiser T, Marx A, Valous NA, Ferber D, et al. Predicting survival from colorectal cancer histology slides using deep learning: A retrospective multicenter study Butte AJ, editor. PLoS Med. 2019;16(1):e1002730. doi:10.1371/journal.pmed.1002730.
- Collins GS, Reitsma JB, Altman DG, Moons KGM. Transparent reporting of a multivariable prediction model for individual prognosis or diagnosis (TRIPOD): the TRIPOD statement. Br J Surg. 2015;102(3):148–158. doi:10.1002/bjs.9736.
- Huang Y, Liang C, He L, Tian J, Liang C, Chen X, Ma Z, Liu Z. Development and validation of a radiomics nomogram for preoperative prediction of lymph node metastasis in colorectal cancer. JCO. 2016;34(18):2157–2164. doi:10.1200/JCO.2015.65.9128.
- van Dam P-J, van der Stok EP, Teuwen L-A, Van den Eynden GG, Illemann M, Frentzas S, Majeed AW, Eefsen RL, Coebergh van den Braak RRJ, Lazaris A, et al. International consensus guidelines for scoring the histopathological growth patterns of liver metastasis. Br J Cancer. 2017;117(10):1427–1441. doi:10.1038/bjc.2017.334.
- Otsu N. A threshold selection method from gray-level histograms. IEEE Trans Syst Man Cybern. 1979;9(1):62–66. doi:10.1109/TSMC.1979.4310076.
- Ruifrok AC, Johnston DA. Quantification of histochemical staining by color deconvolution. Anal Quant Cytol Histol. 2001;23:291–299.
- Ihaka R, Gentleman R. R: a language for data analysis and graphics. J Comput Graphical Stat. 1996;5(3):299–314. doi:10.1080/10618600.1996.10474713.
- Galon J, Angell HK, Bedognetti D, Marincola FM. The continuum of cancer immunosurveillance: prognostic, predictive, and mechanistic signatures. Immunity. 2013;39(1):11–26. doi:10.1016/j.immuni.2013.07.008.
- Laghi L, Bianchi P, Miranda E, Balladore E, Pacetti V, Grizzi F, Allavena P, Torri V, Repici A, Santoro A, et al. CD3+ cells at the invasive margin of deeply invading (pT3–T4) colorectal cancer and risk of post-surgical metastasis: a longitudinal study. Lancet Oncol. 2009;10(9):877–884. doi:10.1016/S1470-2045(09)70186-X.
- Fujiyoshi K, Väyrynen JP, Borowsky J, Papke DJ, Arima K, Haruki K, Kishikawa J, Akimoto N, Ugai T, Lau MC, et al. Tumour budding, poorly differentiated clusters, and T-cell response in colorectal cancer. EBioMedicine. 2020;57:102860. doi:10.1016/j.ebiom.2020.102860.
- Fridman W-H, Dieu-Nosjean M-C, Pagès F, Cremer I, Damotte D, Sautès-Fridman C, Galon J. The immune microenvironment of human tumors: general significance and clinical impact. Cancer Microenvironment. 2013;6(2):117–122. doi:10.1007/s12307-012-0124-9.
- Reichling C, Taieb J, Derangere V, Klopfenstein Q, Le Malicot K, Gornet J-M, Becheur H, Fein F, Cojocarasu O, Kaminsky MC, et al. Artificial intelligence-guided tissue analysis combined with immune infiltrate assessment predicts stage III colon cancer outcomes in PETACC08 study. Gut. 2020;69(4):681–690. doi: 10.1136/gutjnl-2019-319292
- Weissman SM. Personalized medicine: a new horizon for medical therapy. Precis Clin Med. 2018;1(1):1–2. doi:10.1093/pcmedi/pby001.
- Zhao K, Li Z, Yao S, Wang Y, Wu X, Xu Z, Wu L, Huang Y, Liang C, Liu Z. Artificial intelligence quantified tumour-stroma ratio is an independent predictor for overall survival in resectable colorectal cancer. EBioMedicine. 2020;61:103054. doi:10.1016/j.ebiom.2020.103054.
- Trabelsi M, Farah F, Zouari B, Jaafoura MH, Kharrat M. An Immunoscore system based on CD3+ and CD8+ infiltrating lymphocytes densities to predict the outcome of patients with colorectal adenocarcinoma. OTT. 2019;12:8663–8673. doi:10.2147/OTT.S211048.