
ABSTRACT
Pancreatic ductal adenocarcinoma (PDAC) is one of the most common tumor subtypes and remains associated with very poor survival. T cell infiltration into tumor tissue is associated with improved clinical outcome but little is known regarding the potential role of NK cells in disease control. Here we analyze the phenotype and function of NK cells in the blood and tumor tissue from patients with PDAC. Peripheral NK cells are present in normal numbers but display a CD16hiCD57hi phenotype with marked downregulation of NKG2D. Importantly, these cells demonstrate reduced cytotoxic activity and low levels of IFN-γ expression but instead produce high levels of intracellular IL-10, an immunoregulatory cytokine found at increased levels in the blood of PDAC patients. In contrast, NK cells are largely excluded from tumor tissue where they display strong downregulation of both CD16 and CD57, a phenotype that was recapitulated in primary NK cells following co-culture with PDAC organoids. Moreover, expression of activatory proteins, including DNAM-1 and NKP30, was markedly suppressed and the DNAM-1 ligand PVR was strongly expressed on tumor cells. As such, in situ and peripheral NK cells display differential features in patients with PDAC and indicate local and systemic mechanisms by which the tumor can evade immune control. These findings offer a number of potential options for NK-based immunotherapy in the management of patients with PDAC.
Introduction
Pancreatic ductal adenocarcinoma (PDAC) incidence is rising and remains associated with a 5 year survival rate of less than 5% with virtually no improvement in clinical outcome over the last 10 years.Citation1–4 Indeed, current predictions suggest that PDAC may become the second most common cause of cancer death by 2030.Citation5 Chemotherapy and radiotherapy-based regimens are currently limited and there is interest in developing novel forms of immunotherapy. Patients with PDAC display poor responses to checkpoint inhibitionCitation6 and there is thus a clear need to better understand the mechanisms of immune evasion.
The microenvironment of pancreatic ductal adenocarcinoma is typically characterized by extreme hypoxia and a dense stromal ‘desmoplastic’ reaction (TME)Citation7 which together act to support tumor progression, metastasis, and chemoresistance.Citation8–10 Features of immune suppression, such as elevated serum and tissue levels of IL-10 and TGF-β, have been observed.Citation11–13 Despite this, an immune infiltrate is present within many tumors and has been associated with improved clinical outcome.Citation14–17 Indeed, although immune cells typically demonstrate an exhausted phenotype in situCitation12 they can be expanded in vitro to recognize autologous tumor cells.Citation18
In contrast, the phenotypic and functional features of Natural Killer (NK) cells within the PDAC microenvironment has been less intensively investigated although NK cells exhibit impaired killing of autologous PDAC cells due to NKG2D and DNAM-1 deficiencyCitation19 and an increased number of peripheral NK cells may act as a prognostic marker for longer recurrence-free survival and overall survival.Citation20,Citation21 NK cells play an important role in controlling the development of cancerCitation22–24 through loss of inhibitory signaling from cells with downregulation of HLACitation25 and activatory engagement with ‘stress’ molecules such as NKG2D ligands.Citation26–28 The ultimate outcome of NK cell engagement with a target cell is mediated through the balance of inhibitory and activatory interactions and there is now considerable interest in understanding both how tumor cells evade NK cell recognition and if they may be exploited for immunotherapy.Citation29 Here we determined the phenotypic and functional profile of NK cells from patients undergoing surgical resection of PDAC tumors. We show that a range of mechanisms of immune evasion are present within NK cells and that these differ between the local and systemic environments.
Materials and methods
Participants
54 patients with PDAC were recruited from clinics at University Hospitals Birmingham NHS Foundation Trust, Queen Elizabeth Hospital Birmingham over 3-years period (2016–2019) under appropriate ethical approval (REC no 16/WM/0214). Samples from 34 healthy age-matched donors were also obtained. Patients were selected who had localized disease, without local invasion or metastasis, and who were undergoing Whipple’s resection with curative intent.
Immunophenotyping
25 ml of blood was collected prior to pancreaticoduodenectomy surgery and peripheral blood mononuclear cell (PBMC) were collected by density centrifugation. After defrosting, PBMCs were washed and re-suspended at 106cells/100 μl before staining with one of the following antibody panels. Panel 1; anti-DNAM-1 FITC (11A8 Biolegend) (5 µl); anti-PD-1 PE (EH12.2 H Biolegend) (3ul); anti-CD14/CD19 PE dazzle (HCD14/H1B19 Biolegend) (1.5 µl/2.5 µl); anti-NKp46 PerCP/Cy5.5 (Biolegend) (5 µl); anti-CD56 PEcy7(HCD56 Biolegend) (3 µl); anti-NKG2D APC (BD Biosciences) (5 µl); anti-CD3 AF700 (HIT3a Biolegend) (2.5 µl) and anti-CD16 Pacific Blue (3G8 Biolegend) (5 µl). Panel 2; anti-NKG2C FITC(11A8Milteny Biotec) (2µl); anti-CD94 PE (DX22 Biolegend)(1 µl); anti-CD14/CD19 PE-dazzle (HCD14/H1B19Biolegend) (1.5 µl/2.5 µl); anti-KIRS PerCP/Cy5.5 (HP-MA4 Biolegend)(5 µl); anti-CD56PECy7 (HCD56 Biolegend) (3 µl); anti-NKp30 APC (Biolegend)(5 µl); anti-CD3 AF700 (HIT3a Biolegend) (2.5 µl) and anti-CD57 Pacific Blue (HNK-1Biolegend) (3 µl).
Antibody stained samples were run on a BC Gallios flow cytometer within 1 h of staining. At least 100,000 events were acquired per sample using CytoSoftware, and analyzed offline using Kaluza v1.5 software.
Isolation of Tumor-infiltrating lymphocytes (TIL)
Tumor was cut into 1–2 mm pieces and incubated overnight in tissue media culture (RPMI 1640 + 10% FCS+1% Penicillin/Streptomicin+1% L-Glutamine) to allow TILs to migrate out of tissue. Media was spun at 1600 rpm for 5 min prior to flow cytometric analysis.
NK cell cytotoxicity assay
NK cells were enriched using EasySep™ Human NK cell enrichment kit (Stem Cell Technologies, Canada) and activated overnight at with IFNα (sigma, 10 ng/ml)., K562 cells were labeled with CFSE and co-cultured with the pre-activated NK cells at E:T ratio of 1:1. Cells were co-cultured for 16 hours prior to analysis using BD Accuri™ flow cytometer (BD Bioscience) and specific lysis calculated on live cell enumeration.Citation27 The equation for calculation is: 100 × (1 – [(experimental group cell count)/(control cell count)]).
Intracellular cytokine staining
PBMCs and K562 were co-cultured overnight with Brefeldin A (SIGMA ALDRICH) (1 µl/ml) at 1:1 ratio. Co-cultures were washed and stained with appropriate surface antibodies and PB live/dead dye (Invitrogen; Massachusetts, USA) before the fixation and permeabilization. Cells were then stained with antibodies against intracellular cytokines, washed, and analyzed using flow cytometry.
Quantitative reverse-transcription polymerase chain reaction (qRT-PCR)
Total RNA was isolated from normal pancreatic tissues and tumor tissues using QIAGEN RNeasy kit and treated with DNase I (Turbo DNA-free kit; Ambion). Q-RT-PCR assays were performed with TaqMan® Gene Expression Assays (Applied Biosystems), reference plasmids containing relevant target gene sequences were used to generate standard curves.
Immunohistochemistry
10 cases of paraffin wax embedded PDAC Tissue sections were de waxed and re-hydrated. Endogenous peroxidase activity was blocked using 0.3% H2O2 and the citrate buffer antigen retrieval method was performed. Before application of primary antibodies, slides were blocked in 5x casein (Vector Laboratories Ltd.). Primary antibodies Anti-ULBP2 (ab88645; Abcam) and Anti-PVR (HPA012568; Atlas Antibodies) were diluted in PBS to desired concentration. For visualization of staining DAB substrate was added (Vector Laboratories Ltd). Stained tissue was analyzed under the Eclipse E400 microscope (Nikon) and images were taken with 40x magnification.
Co-culture of organoid and autologous PBMCs
Tumor was diced into approximately 2 mm sections and crushed with the butt of a syringe. Homogenate was poured into basal culture media containing Type II Collagenase (Life Technologies; [2.5 mg/mL]) and shaken at 37°C for 60 min prior to dilution with basal culture medium and filtration through a 70uM filter (Falcon Catalog number 352350). The cell suspension was pelleted and washed prior to incubation with growth factor-reduced Matrigel (Corning Catalog number CB-40230 C), with final concentration at 75%. The suspension was then rapidly plated into a 24-well plate with 50uL of suspension per well. 20 min later, 600uL of general culture medium was added to each well of the solidified Matrigel. General culture medium was composed of Advanced DMEM/F12, supplemented with 1% penicillin streptomycin, 1X Glutamax, 1% HEPES, 100 ng/mL R-spondin 1 (Peprotech catalog number 120–38), 100 ng/mL Noggin (Peprotech catalog number 120–10 C), 50 ng/mL EGF (Peprotech catalog number 100–15), 10 ng/mL FGF-10 (Peprotech catalog number 100–26), 10 ng/mL FGF2 (Peprotech catalog number 100–18B), 1x B27 (Life Technologies Catalog number 17504044), 10 mM Nicotinamide (Sigma Aldrich Catalog Number N0636), 1.25 mM N-acetylcysteine (Sigma Aldrich catalog number A9165), 1uM Prostaglandin E2 (Catalog number R&D Systems Catalog number 2296), 10uM SB202190 (Sigma Aldrich Catalog number S7076), and 500 nm A83-01 (Sigma Aldrich catalog number SML0788). Medium was replaced every 3–4 days and matured organoids passaged 1:3 every 14 days. Autologous PBMC were defrosted and cultured in vitro, with or without organoid, with IL-2 added after 3 days at 200IU/ml. Co-cultures were maintained for 7–14 days prior to immuno-phenotyping.
Statistical analysis
Statistical analysis was performed with SPSS 24 and Prism 8. Each parameter was checked for normal distribution. A paired-t or the related samples-Wilcoxon Signed Rank test for non-parametric variables were used accordingly. A p value <.05 was considered statistical significant. The clinical correlation was carried out using Spearman’s Rank correlation test. Also the effect of NK cell on overall survival, disease-free survival, and recurrence were plotted using the Kaplan–Meier method and assessed with the log-rank (Mantel-Cox) method.
Results
Patients with PDAC have normal numbers of NK cells within blood but expression of CD16 is increased on the CD56dim subset
The overall percentage of NK cells within the blood of patients with PDAC was not reduced and comprised 18% of PBMC compared to 16% in healthy donors (p = .52) (). The relative distribution of NK cells within major NK subsets was then examined by analysis of CD16 and CD56 expression. These four major subsets comprise CD56dimCD16bright, CD56brightCD16negative, CD56brightCD16bright and CD56dimCD16negative subgroupsCitation30 (). As anticipated, CD56dimCD16bright cells were the dominant population in healthy donors, representing 79% of NK cells, with values of 6.4, 2.2, and 12% for CD56brightCD16negative, CD56bright CD16bright and CD56dimCD16negative cells, respectively (+1d). Interestingly, the CD56dimCD16bright population was further increased in the blood of PDAC patients where it comprised 87% of total cells (p = .001). The CD56brightCD16negative, CD56bright CD16bright and CD56dimCD16negative subsets were measured at 4.2, 1.9, and 6.7%, respectively ( right panel and 1D), representing a 44% reduction of CD56dimCD16negative cells within the patient group (p = .0001).
Figure 1. Patients with PDAC have normal numbers of NK cells within blood but expression of CD16 is increased on the CD56dim subset
Peripheral NK cells from PDAC patients express reduced levels of the activating receptors NKG2D and NKp30
We next went on to assess the expression of markers associated with NK cell differentiation and activation on peripheral NK cells. CD57 expression is expressed on late differentiated cells and associated with high cytotoxic activity.Citation31 Of note, CD57 was expressed on 50% of cells in the patient group compared to only 44% within healthy donors (p = .04) (). The major activatory protein CD16 was also increased in patients, expressed on 88% compared to 77% of controls (p = .0002) (). A trend toward increased expression of NKG2C () was also seen in the patient group (NKG2C: 4.8% vs 5.2% for HD vs PDAC, p = .68). Overall this profile reveals a somewhat more differentiated profile of peripheral NK cells within the patient group.
Figure 2. Peripheral NK cells from PDAC patients express reduced levels of the activating receptors NKG2D and NKp30
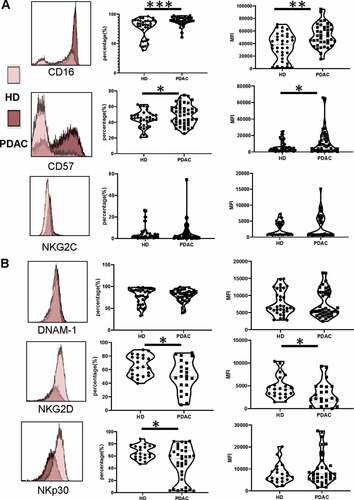
Activating receptors are critical regulators of NK cell activity and are frequently downregulated in the setting of cancer. We next defined the expression of the major activatory receptors NKG2D, DNAM-1 and NKp30. NKG2D expression was downregulated in the patient group, present on 51% of cells compared to 66% of healthy donors (p = .027) (). The mean florescence intensity (MFI) of expression was also lower at 3200 ± 564 and 4620 ± 525, respectively (p= .047). NKp30 expression was also reduced, present on 47% and 66% of cells in PDAC patients and controls, respectively (p= .023) (). In contrast, expression of DNAM-1 did not differ between the two groups, present on 79% of cells in both cohorts ().
NK cells within the blood of PDAC patients have reduced cytotoxic function and express high levels of IL-10
The functional capacity of NK populations was next assessed by assessment of relative cytotoxic activity and the pattern of cytokine production. Cytokine production was assessed by incubation of PBMC with K562 prior to assessment of cytokine production using intracellular staining. NK cells normally produce substantial amounts of proinflammatory cytokine such as IFN-γ and TNF-α and this pattern was observed in healthy donors. However, IFN-γ production was substantially reduced in NK cells from PDAC patients (1.9% vs. 5.1% in controls; p= .003) () and atrend toward reduced levels of TNF-α was also seen (2.4% vs 3.9%, p= .12) ( left panel). IL-2 production was also lower in the patient group, present within only 0.7% of cells compared to 2.4% from healthy donors (p= .009) (). Strikingly, IL-10 production was markedly increased in NK cells from PDAC patients, present in 9.8% of cells compared to only 2.2% in healthy donors (p= .001) (). Expression of IL-4 and IL-5 was comparable between donors ( middle and right panel). Lytic activity of NK cells was analyzed on K562 target cells and cytotoxicity was markedly reduced compared to healthy donors (42% vs. 70%, respectively, at E:T ratio 1:1 (p= .026) ().
Figure 3. NK cells within the blood of PDAC patients have reduced cytotoxic function and express high levels of IL-10
NK cells are a minority population within PDAC tumors and show strong downregulation of CD16
Having observed substantial differences in the phenotype and function of NK cells in the blood of PDAC patients we next went on to assess the phenotype of NK cells isolated from the tumor microenvironment using 9 paired samples of blood (PBMC-NK) and tumor-infiltrating lymphocytes (TIL-NK).
The percentage of NK cells was markedly suppressed within TIL populations, representing only 3.5% of cells compared to 17% within PBMC (p= .005) ( and ). The relative distribution of TIL-NK and PBMC-NK within the four major NK subsets was then defined by CD16 and CD56 expression. Of note, the dominant phenotype of TIL-NK cells was the CD56dimCD16negative population which comprised 55% of the total pool. CD56dimCD16bright, CD56brightCD16negative and CD56bright CD16bright subgroups represented 22, 21, and 2.2%, respectively, of the remaining population (). This was a substantially different profile from that seen within PBMC-NK where, as expected, 89% of cells expressed aCD56dimCD16bright phenotype. CD56brightCD16negative, CD56bright CD16bright and CD56dimCD16negative cells also comprised 4%, 2.2% and 4.6%, respectively (). As such these findings show a marked downregulation of CD16 within the tumor microenvironment, which was present on only 27% of total TIL-NK compared to 92% of PBMC-NK (p< .0001) ().
Figure 4. NK cells are a minority population within PDAC tumors and show strong downregulation of CD16
Figure 5. Expression of activatory receptors is reduced substantially on NK cells within the PDAC tumor
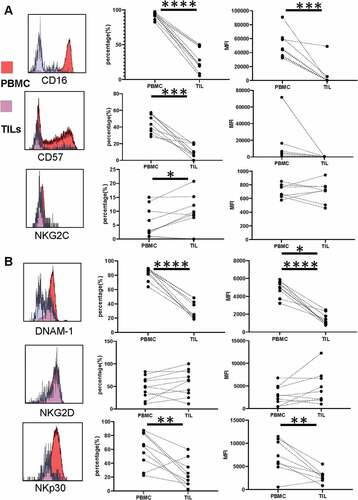
Expression of activatory receptors is reduced substantially on NK cells within the PDAC tumor
The extended phenotype of TIL-NK was then assessed using flow cytometry. CD57 expression was seen to be very low, present on 11% of cells compared to 44% in blood (p= .0001; ) . This data from CD16 and CD57 suggests aless differentiated phenotype for TIL-NK populations. But interestingly, NKG2C expression was marginally increased at 9.2% compared to 6.1% on PBMC-NK (p = .04).
Strikingly, downregulation of NK activatory receptors was profoundly suppressed on TIL-NK cells, further extending the profile that had been observed in PBMC-TIL populations. This was seen most clearly in both the percentage and median fluorescent intensity (MFI) of DNAM-1 and NKp30 expression. DNAM-1 was present on only 32% of TIL-NK cells compared to 83% of PBMC-NK (p< .0001) () with NKp30 expression of 26% and 60%, respectively (p= .007) (). Relative MFI values were 1430 ± 214 and 4860 ± 294 for DNAM-1 and 2860 ± 475 and 7120 ± 1308 for NKp30, respectively ().
Although NKG2D expression had been seen to be reduced on peripheral NK cells from PDAC patients, this remained stable within the TIL populations with no further reduction (48% versus 58% in TIL-NK and PBMC-NK, respectively; p= .15) ().
The PDAC tumor microenvironment expresses high levels of NK cell ligands and tumors induce downregulation of CD16 and CD57 on NK cells
In order to interrogate mechanisms that might lead to the characteristic phenotype of NK cells within PDAC tumors we next examined the expression of ligands for NK activatory receptors within the tumor microenvironment. qPCR was used to assess transcription of the NKG2D ligands and PVR within tumor tissue and adjacent uninvolved margin. Interestingly, expression of the NKG2D ligands ULBP2 and MICA was increased by 6.2 and 2.7 fold, respectively, within tumor tissue (ULBP2: 1000 & 162 for PDAC vs margin, p= .0059; MICA: 1510 vs 567 (p= .01) ()). PVR is aligand for DNAM and was markedly increased by 18-fold in the tumor microenvironment (4370 vs 245 (p= .0024) ()). Immunohistochemical analysis confirmed strong PVR, MICA, and ULBP2 expression on PDAC tumor tissue ().
Figure 6. The PDAC tumor microenvironment expresses high levels of NK cell ligands and tumors induce downregulation of CD16 and CD57 on NK cells
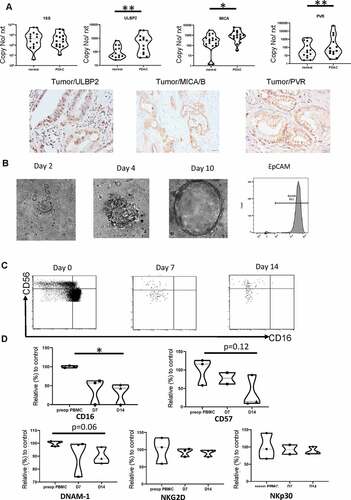
To further understand how PDAC tumor cells might act to directly influence NK phenotype we next co-cultured primary PDAC cells with autologous PBMC-NK cells invitro. PDAC tumor organoids were generated and after 2–3 week maturation were co-cultured with the PBMC for 14 days. NK cell phenotype was determined prior to incubation and then atday 7 andday 14 following co-culture, the data were shown as relative percentage of surface expression compared to PBMC cultures without organoid (n = 3). CD16 and CD57 expression in the control group remained stable during culture but, interestingly, CD16 expression was profoundly downregulated during organoid co-culture, falling to 32% of the control group at day 14 (p= .01). As such the majority of NK cells came to develop aCD56dimCD16negative phenotype typical of those found in primary PDAC tumors ( right panel). CD57 expression was also reduced during co-culture, falling to 37% of control values atday 14 (p= .12) (). This phenotypic change was not observed with organoid-conditioned medium. Expression of the activatory receptors DNAM-1, NKG2D and NKp30 expression was broadly stable during culture. As such tumor cells can rapidly directly downregulate CD16 and CD57 expression but do not modulate expression of activity ligands during short-term culture.
The CD56dim CD16neg NK population within blood does not affect overall survival but is positively correlated with tumor recurrence
Finally, we next assessed how the size and phenotype of the NK pool correlated with clinical outcome. Interestingly, the proportion of total NK cells within blood correlated directly with the size of the tumor (R = 0.38, P= .02). A trend toward reduced survival was also observed ().
Figure 7. The CD56dim CD16neg NK population within blood does not affect overall survival but is positively correlated with tumor recurrence
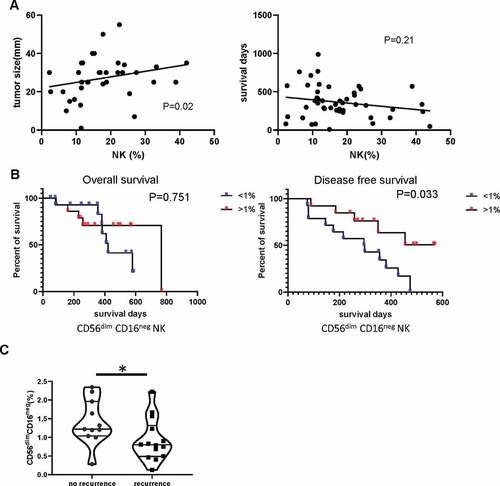
Given our earlier observations on differential populations of CD56dimCD16neg NK within patients, and expansion after incubation with tumor organoids, we considered that these cells may be tumor-reactive and of particular interest. The cohort of PDAC patients undergoing potentially curative surgery was divided into two groups on the basis of the median percentage of CD56dimCD16neg NK cell populations (<1% and ≥ 1%) and correlated with pathologic and clinical outcome (). Patients with ≥ 1% CD56dimCD16neg NK cells had higher CA19-9 levels than those with <1% CD56dimCD16neg NK cells. The overall survival and disease-free survival curves were plotted using the Kaplan–Meier method and the significance was assessed using log-rank (Mantel-Cox) method. Patients with a CD56dimCD16neg NK population higher than 1% of PBMCs demonstrated significantly reduced tumor recurrence ( and ) with amedian of disease-free survival of 451 days (164–737) compared with 185 days (17–352) with those in the <1% group. These data indicate that CD56dimCD16neg NK populations may play acrucial role in containing recurrence of PDAC tumor after surgery.
Table 1. Demographic, diagnostic and therapeutic characteristics of two groups of PDAC patients with defined on the basis of CD56dim CD16neg NK cell population (<1% and ≥ 1%)
Table 2. Clinical survival of two groups of PDAC patients with defined on the basis of CD56dim CD16neg NK cell population (<1% and ≥ 1%)
Discussion
Most studies on the mechanisms of immune evasion in PDAC patients have focussed on T cell immune responses against tumor tissue but here we investigated NK cell phenotype and function. Differential features of NK cell immune evasion are observed within the tumor microenvironment and peripheral blood. As local invasion and metastasis ultimately develop in the majority of patients with PDAC, these findings indicate that immunotherapy protocols might seek to reverse these features in both settings.
A clear difference was apparent in the number of NK cells within the blood and tumor compartments. Lim et al have previously reported a higher percentage of NK cells in blood from PDAC patients compared to HDCitation19 and a similar trend was seen in our study but did not reach statistical significance (). NK proportions were markedly lower within tumor tissue, representing only 3.5% of the TIL population. As such migration of NK cells into the tumor site is likely suppressed and lack of CXCR2 expression on NK cells has been shown to be one critical determinant.Citation19 However, it should also be noted that NK cells numbers are frequently excluded from normal tissue and future work should address the profile of NK cells in control pancreatic tissue. The expression of CD16 and CD57 also differed between compartments. This is likely to partially reflect differential NK phenotype within normal tissue and peripheral blood as NK cells within secondary lymphoid tissue express a CD56brightCD16neg phenotypeCitation30,Citation32 whilst the cytotoxic CD56dimCD16pos subgroup predominates in blood.Citation33,Citation34 However, at least four NK subsets can be defined according to CD56 and CD16 expressionCitation30 and we show that NK cells with a CD56dimCD16neg phenotype are enriched within tumor but depleted within peripheral blood. This subset expresses a broadly immature phenotype with high expression of NKG2A+ and reduced CD57,Citation35 findings that concur with our observations within NK-TIL. In contrast, NK cells in the blood of PDAC patients demonstrate a differentiated phenotype, with high levels of expression of CD16, CD57 expression. Organoid cultures provide an opportunity to interrogate interactions between primary tumor and immune effector cells in vitro and it was noteworthy that the features of NK cell phenotype within the tumor microenvironment were largely recapitulated following culture with PDAC organoids, with substantial downregulation of CD16 and CD57.
Downregulation of activating receptor expression on NK cells and impaired NK function is a common mechanism of immune evasion in cancer, and has been associated with tumor progression in PDAC.Citation36–39 We also observed this profile but it was noteworthy that a different pattern was observed on cells from blood or tumor microenvironment. NKG2D expression is often reduced on NK cells in cancerCitation26,Citation27 and although modest downregulation was observed in PDAC patients this pattern remained stable within blood and TIL populations. In contrast, although NKp30 was only partially downregulated within blood, a profound reduction in expression was observed within tumor tissue. DNAM-1 expression was also selectively and comprehensively downregulated within the tumor microenvironment. Interestingly, expression of the inhibitory TIGIT receptor,Citation40 which binds to the same ligands as DNAM-1, is significantly higher on NK cells from blood in PDAC patients compared with HD (Supplementary Figure 3) and reinforces an important role for this pathway. Another mechanism for impairment of NK cell function within the tumor microenvironment may be the conversion of NK cells into innate lymphoid cell due to high concentration of TGF-β.Citation41.
The expression of ligands for NK activatory receptors was examined by PCR and immunohistochemistry. NKG2D ligand expression was increased in tumors, most notably for ULBP2 and MICA which were increased by 2–6 fold. Interestingly, the concentration of serum NKG2D ligands is an independent marker of survival in PDACCitation42–45 and it most strongly associated with ULBP2.Citation43 The expression of PVR, a major ligand for DNAM, was markedly increased on tumor cells () and is likely to explain the profound downregulation of DNAM in this setting. This is particularly noteworthy as DNAM-mediated cytotoxicity represents a major mechanism of lysis of PDAC cells.Citation19
The functional profile of peripheral NK cells was assessed using cytotoxicity assay and cytokine profile after stimulation although too few cells were available within TIL for this analysis. One of the most striking observations was that NK cells from PDAC patients have a markedly altered profile of cytokine production, with reduced levels of IFN-γ and IL-2 but substantially increased production of IL-10. As such they express a ‘regulatory’ phenotype, a concept that is emerging within NK biology. IL-10 producing NK cells have been demonstrated after stem cell transplantationCitation46 and viral infectionCitation47 and likely mediate a regulatory role, promoted by sustained proliferation after chronic stimulation.Citation47,Citation48 CD56bri NK cells are generally regarded as the major subset of cytokine-producing cellsCitation49 but CD56dim cells may also display rapid cytokine production after stimulation,Citation50 particularly from the CD16neg subset.Citation35
These findings raise questions as to how IL-10 production might act to suppress tumor-specific immune responses. Systemic concentrations of IL-10 levels are 3–5 fold higher in the blood of patients with PDAC, where they are strongly correlated with impaired T cell function,Citation11–13 and our data indicate that NK cells are likely to be a major source of IL-10 production within the periphery. IL-10 might also have a direct impact on NK cell function and has been shown to inhibit NK‐92 killing of PDAC cells in vitro. Importantly, this effect was restored by anti‐IL‐10 receptor blockade, indicating a potential novel therapeutic intervention.Citation51 Of note, all patients studied had undergone operative resection of PDAC with curative intent and had no evidence of metastatic disease at this time. Despite this, our findings reveal that the peripheral immune system is already significantly modulated by the disease process and it is likely that this immunoregulatory environment may play an important part in tumor spread. Indeed the number of peripheral NK cells has been identified as an independent marker of increased survival.Citation20
Interestingly, a positive correlation between the percentage of peripheral NK cells and the size of the PDAC tumor. The reasons underlying this are not clear but may include direct tumor-mediated stimulation of NK proliferation or increased partitioning of the NK pool from the tumor and into the peripheral circulation. The CD56dimCD16neg NK cell subpopulation was of particular note as it was reduced within blood but enriched in TILs. Interestingly, patients with peripheral CD56dimCD16neg NK populations above the median level (>1%) suffered less disease recurrence than patients with <1%. Our observation that this subset can be expanded by co-culture with autologous organoids reveals a potential mechanism for therapeutic intervention.
Our findings indicate that a range of mechanisms of immune evasion are apparent within NK cells in patients with PDAC. These include exclusion from the tumor site, downregulation of activatory receptors with impaired differentiation in the tumor microenvironment, and promotion of an immunoregulatory IL-10 phenotype within the periphery. This suggests that primary NK cells might have potent activity to suppress PDAC development and that these evasion mechanisms are a necessary component of tumor evolution. As such, approaches that overcome these mechanisms could have considerable potential in a disease with few therapeutic options. Approaches such as IL-10 blockade, mechanisms to support activatory receptor expressionCitation52, or NK cellular therapy all represent options for future investigation.
Authors’ contributions
JZ, GM, KR and PM designed the study. FM, JZ, HP. SN, SMD and MF performed the experiments in the research lab. FM, BM, and RB collected the patient samples. JZ, FM, KR and PM wrote the manuscript. All authors read and approved the final manuscript.
Consent for publication
This is not applicable for this study.
Competing interests
The authors declare that they have no competing interests.
Ethics approval and consent to participate
This study was approved by the Birmingham Local Research Ethics Committee REC 16/WM/0214. Written informed consent was obtained from all of the patients.
Supplemental Material
Download ()Acknowledgments
We kindly thank the help from Dr. Kriti Verma and Dr. Guido Frumento (university of Birmingham, UK).
Availability of data and material
All data supporting the conclusion of this study have been included within the article. They can be requested through corresponding authors.
Supplementary material
Supplemental data for this article can be accessed on the publisher’s website.
Additional information
Funding
References
- Quaresma M, Coleman MP, Rachet B. 40-year trends in an index of survival for all cancers combined and survival adjusted for age and sex for each cancer in England and Wales, 1971–2011: a population-based study. Lancet. 2015;385(9974):1206–13. doi:10.1016/S0140-6736(14)61396-9.
- Ducreux M, Committee Obot EG, Cuhna AS, Hollebecque A, Burtin P, Goéré D, Seufferlein T, Haustermans K, Van Laethem JL, Conroy T, et al. Cancer of the pancreas: ESMO Clinical Practice Guidelines for diagnosis, treatment and follow-up†. Ann Oncol. 2015;26(suppl_5):v56–v68. doi:10.1093/annonc/mdv295.
- Warshaw AL, Castillo CF-D. Pancreatic Carcinoma. New England J Med. 1992;326(7):455–465. doi:10.1056/nejm199202133260706.
- Bates SE. Pancreatic Cancer: challenge and Inspiration. Clin Cancer Res. 2017;23(7): 1628–28. doi:10.1158/1078-0432.Ccr-16-2069.
- Kenner BJ, Chari ST, Maitra A, Srivastava S, Cleeter DF, Go VLW, Rothschild LJ, Goldberg AE. Early Detection of Pancreatic Cancer-a Defined Future Using Lessons From Other Cancers: A White Paper. Pancreas. 2016;45(8):1073–1079. doi:10.1097/MPA.0000000000000701.
- Brahmer JR, Tykodi SS, Chow LQM, Hwu W-J, Topalian SL, Hwu P, Drake CG, Camacho LH, Kauh J, Odunsi K, et al. Safety and Activity of Anti–PD-L1 Antibody in Patients with Advanced Cancer. New England J Med. 2012;366(26):2455–2465. doi:10.1056/NEJMoa1200694.
- Merika EE, Syrigos KN, Saif MW. Desmoplasia in Pancreatic Cancer. Can We Fight It? Gastroenterol Res Pract. 2012;2012:10. doi:10.1155/2012/781765.
- Stetler-Stevenson WG, Aznavoorian S, Liotta LA. Tumor Cell Interactions with the Extracellular Matrix During Invasion and Metastasis. Annu Rev Cell Biol. 1993;9(1):541–573. doi:10.1146/annurev.cb.09.110193.002545.
- Gaggioli C, Hooper S, Hidalgo-Carcedo C, Grosse R, Marshall JF, Harrington K, Sahai E. Fibroblast-led collective invasion of carcinoma cells with differing roles for RhoGTPases in leading and following cells. Nat Cell Biol. 2007;9(12):1392–1400. doi:10.1038/ncb1658.
- Orimo A, Gupta PB, Sgroi DC, Arenzana-Seisdedos F, Delaunay T, Naeem R, Carey VJ, Richardson AL, Weinberg RA. Stromal Fibroblasts Present in Invasive Human Breast Carcinomas Promote Tumor Growth and Angiogenesis through Elevated SDF-1/CXCL12 Secretion. Cell. 2005;121(3):335–348. doi:10.1016/j.cell.2005.02.034.
- von Bernstorff W, Voss M, Freichel S, Schmid A, Vogel I, Jöhnk C, Henne-Bruns D, Kremer B, Kalthoff H. Systemic and Local Immunosuppression in Pancreatic Cancer Patients. Clin Cancer Res. 2001;7(3):925s–32s.
- Wörmann SM, Diakopoulos KN, Lesina M, Algül H. The immune network in pancreatic cancer development and progression. Oncogene. 2014;33(23):2956–2967. doi:10.1038/onc.2013.257.
- Bellone G, Turletti A, Artusio E, Mareschi K, Carbone A, Tibaudi D, Robecchi A, Emanuelli G, Rodeck U. Tumor-associated transforming growth factor-beta and interleukin-10 contribute to a systemic Th2 immune phenotype in pancreatic carcinoma patients. Am J Pathol. 1999;155(2):537–547. doi:10.1016/s0002-9440(10)65149-8.
- Fukunaga A, Miyamoto M, Cho Y, Murakami S, Kawarada Y, Oshikiri T, Kato K, Kurokawa T, Suzuoki M, Nakakubo Y, et al. CD8+ Tumor-Infiltrating Lymphocytes Together with CD4+ Tumor-Infiltrating Lymphocytes and Dendritic Cells Improve the Prognosis of Patients with Pancreatic Adenocarcinoma. Pancreas. 2004;28(1):e26–e31. doi:10.1097/00006676-200401000-00023.
- Protti MP, De Monte L. Immune infiltrates as predictive markers of survival in pancreatic cancer patients. Front Physiol. 2013;4:210. doi:10.3389/fphys.2013.00210.
- Nejati R, Goldstein JB, Halperin DM, Wang H, Hejazi N, Rashid A, Katz MH, Lee JE, Fleming JB, Rodriguez-Canales J, et al. Prognostic Significance of Tumor-Infiltrating Lymphocytes in Patients With Pancreatic Ductal Adenocarcinoma Treated With Neoadjuvant Chemotherapy. Pancreas. 2017;46(9):1180–1187. doi:10.1097/mpa.0000000000000914.
- Ino Y, Yamazaki-Itoh R, Shimada K, Iwasaki M, Kosuge T, Kanai Y, Hiraoka N. Immune cell infiltration as an indicator of the immune microenvironment of pancreatic cancer. Br J Cancer. 2013;108(4):914–923. [published Online First: 2013/02/05]. doi:10.1038/bjc.2013.32.
- Meng Q, Liu Z, Rangelova E, Poiret T, Ambati A, Rane L, Xie S, Verbeke C, Dodoo E, Del Chiaro M, et al. Expansion of Tumor-reactive T Cells From Patients With Pancreatic Cancer. J Immunother. 2016;39(2):81–89. doi:10.1097/cji.0000000000000111.
- Lim SA, Kim J, Jeon S, Shin MH, Kwon J, Kim T-J, Im K, Han Y, Kwon W, Kim S-W, et al. Defective Localization With Impaired Tumor Cytotoxicity Contributes to the Immune Escape of NK Cells in Pancreatic Cancer Patients. Front Immunol. 2019;10:496. doi:10.3389/fimmu.2019.00496.
- Hoshikawa M, Aoki T, Matsushita H, Karasaki T, Hosoi A, Odaira K, Fujieda N, Kobayashi Y, Kambara K, Ohara O, et al. NK cell and IFN signatures are positive prognostic biomarkers for resectable pancreatic cancer. Biochem Biophys Res Commun. 2018;495(2):2058–2065. doi:10.1016/j.bbrc.2017.12.083.
- Davis M, Conlon K, Bohac GC, Barcenas J, Leslie W, Watkins L, Lamzabi I, Deng Y, Li Y, Plate JMD, et al. Effect of pemetrexed on innate immune killer cells and adaptive immune T cells in subjects with adenocarcinoma of the pancreas. J Immunoth. (Hagerstown, Md: 1997). 2012;35(8):629–640. [published Online First: 2012/09/22]. doi:10.1097/CJI.0b013e31826c8a4f.
- Imai K, Matsuyama S, Miyake S, Suga K, Nakachi K. Natural cytotoxic activity of peripheral-blood lymphocytes and cancer incidence: an 11-year follow-up study of a general population. Lancet. 2000;356(9244):1795–1799. doi:10.1016/S0140-6736(00)03231-1.
- Guillerey C, Huntington ND, Smyth MJ. Targeting natural killer cells in cancer immunotherapy. Nat Immunol. 2016;17:1025. doi:10.1038/ni.3518.
- Morvan MG, Lanier LL. NK cells and cancer: you can teach innate cells new tricks. Nat Rev Cancer. 2015;16:7. doi:10.1038/nrc.2015.5.
- Hicklin DJ, Marincola FM, Ferrone S. HLA class I antigen downregulation in human cancers: T-cell immunotherapy revives an old story. Mol Med Today. 1999;5(4):178–186. doi:10.1016/S1357-4310(99)01451-3.
- Groh V, Wu J, Yee C, Spies T. Tumour-derived soluble MIC ligands impair expression of NKG2D and T-cell activation. Nature. 2002;419(6908):734–738. doi:10.1038/nature01112.
- Parry HM, Stevens T, Oldreive C, Zadran B, McSkeane T, Rudzki Z, Paneesha S, Chadwick C, Stankovic T, Pratt G, et al. NK cell function is markedly impaired in patients with chronic lymphocytic leukaemia but is preserved in patients with small lymphocytic lymphoma. Oncotarget. 2016;7(42):68513–68526. doi:10.18632/oncotarget.12097.
- Lanier LL. NKG2D Receptor and Its Ligands in Host Defense. Cancer Immunol Res. 2015;3(6):575–582. doi:10.1158/2326-6066.CIR-15-0098.
- Oberschmidt O, Kloess S, Koehl U. Redirected Primary Human Chimeric Antigen Receptor Natural Killer Cells As an “Off-the-Shelf Immunotherapy” for Improvement in Cancer Treatment. Front Immunol. 2017;8(654). doi:10.3389/fimmu.2017.00654.
- Michel T, Poli A, Cuapio A, Briquemont B, Iserentant G, Ollert M, Zimmer J. Human CD56 bright NK Cells: an Update. J Immunol. 2016;196(7):2923–2931. doi:10.4049/jimmunol.1502570.
- Nielsen C, White M, Goodier M, Riley EM. Functional Significance of CD57 Expression on Human NK Cells and Relevance to Disease. Front Immunol. 2013;4:422. doi:10.3389/fimmu.2013.00422.
- Poli A, Michel T, Thérésine M, Andrès E, Hentges F, Zimmer J. CD56 bright natural killer (NK) cells: an important NK cell subset. Immunology. 2009;126(4):458–465. doi:10.1111/j.1365-2567.2008.03027.x.
- Moretta L. Dissecting CD56dim human NK cells. Blood. 2010;116(19):3689–3691. doi:10.1182/blood-2010-09-303057.
- Abel AM, Yang C, Thakar MS, Malarkannan S. Natural Killer Cells: development, Maturation, and Clinical Utilization. Front Immunol. 2018;9:1869. doi:10.3389/fimmu.2018.01869.
- Amand M, Iserentant G, Poli A, Sleiman M, Fievez V, Sanchez IP, Sauvageot N, Michel T, Aouali N, Janji B, et al. Human CD56dimCD16dim Cells As an Individualized Natural Killer Cell Subset. Front Immunol. 2017;8:699. doi:10.3389/fimmu.2017.00699.
- Jun E, Song AY, Choi J-W, Lee HH, Kim M-Y, Ko D-H, Kang HJ, Kim SW, Bryceson Y, Kim SC, et al. Progressive Impairment of NK Cell Cytotoxic Degranulation Is Associated With TGF-β1 Deregulation and Disease Progression in Pancreatic Cancer. Front Immunol. 2019;10:1354. doi:10.3389/fimmu.2019.01354.
- Peng Y-P, Zhu Y, Zhang -J-J, Xu Z-K, Qian Z-Y, Dai -C-C, Jiang K-R, Wu J-L, Gao W-T, Li Q, et al. Comprehensive analysis of the percentage of surface receptors and cytotoxic granules positive natural killer cells in patients with pancreatic cancer, gastric cancer, and colorectal cancer. J Transl Med. 2013;11(1):262. doi:10.1186/1479-5876-11-262.
- Funa K, Nilsson B, Jacobsson G, Alm GV. Decreased natural killer cell activity and interferon production by leucocytes in patients with adenocarcinoma of the pancreas. Br J Cancer. 1984;50(2):231–233. doi:10.1038/bjc.1984.168.
- Peng Y-P, Zhang -J-J, Liang W-B, Tu M, Lu Z-P, Wei J-S, Jiang K-R, Gao W-T, Wu J-L, Xu Z-K, et al. Elevation of MMP-9 and IDO induced by pancreatic cancer cells mediates natural killer cell dysfunction. BMC Cancer. 2014;14(1):738. doi:10.1186/1471-2407-14-738.
- Zhang Q, Bi J, Zheng X, Chen Y, Wang H, Wu W, Wang Z, Wu Q, Peng H, Wei H, et al. Blockade of the checkpoint receptor TIGIT prevents NK cell exhaustion and elicits potent anti-tumor immunity. Nat Immunol. 2018;19(7):723–732. doi:10.1038/s41590-018-0132-0.
- Gao Y, Souza-Fonseca-Guimaraes F, Bald T, Ng SS, Young A, Ngiow SF, Rautela J, Straube J, Waddell N, Blake SJ, et al. Tumor immunoevasion by the conversion of effector NK cells into type 1 innate lymphoid cells. Nat Immunol. 2017;18(9):1004–1015. doi:10.1038/ni.3800.
- Duan X, Deng L, Chen X, Lu Y, Zhang Q, Zhang K, Hu Y, Zeng J, Sun W. Clinical significance of the immunostimulatory MHC class I chain-related molecule A and NKG2D receptor on NK cells in pancreatic cancer. Med Oncol. 2011;28(2):466–474. doi:10.1007/s12032-010-9480-9.
- Chen J, Zhu -X-X, Xu H, Fang H-Z, Zhao J-Q. Expression and prognostic significance of unique ULBPs in pancreatic cancer. Onco Targets Ther. 2016;9:5271–5279. doi:10.2147/OTT.S107771.
- Chen J, Xu H, Zhu -X-X. Abnormal expression levels of sMICA and NKG2D are correlated with poor prognosis in pancreatic cancer. Ther Clin Risk Manag. 2015;12:11–18. doi:10.2147/TCRM.S96869.
- Märten A, von Lilienfeld-toal M, Büchler MW, Schmidt J. Soluble MIC is elevated in the serum of patients with pancreatic carcinoma diminishing γδ T cell cytotoxicity. Inter J Can. 2006;119(10):2359–2365. doi:10.1002/ijc.22186.
- Chan YLT, Zuo J, Inman C, Croft W, Begum J, Croudace J, Kinsella F, Maggs L, Nagra S, Nunnick J, et al. NK cells produce high levels of IL-10 early after allogeneic stem cell transplantation and suppress development of acute GVHD. Eur J Immunol. 2018;48(2):316–329. [published Online First: 2017/10/27]. doi:10.1002/eji.201747134.
- Tarrio ML, Lee S-H, Fragoso MF, Sun H-W, Kanno Y, O’Shea JJ, Biron CA. Proliferation Conditions Promote Intrinsic Changes in NK Cells for an IL-10 Response. J Immunol. 2014;193(1):354–363. doi:10.4049/jimmunol.1302999.
- Jiang Y, Yang M, Sun X, Chen X, Ma M, Yin X, Qian S, Zhang Z, Fu Y, Liu J, et al. IL-10+ NK and TGF-β+ NK cells play negative regulatory roles in HIV infection. BMC Infect Dis. 2018;18(1):80. doi:10.1186/s12879-018-2991-2.
- Cooper MA, Fehniger TA, Turner SC, Chen KS, Ghaheri BA, Ghayur T, Carson WE, Caligiuri MA. Human natural killer cells: a unique innate immunoregulatory role for the CD56bright subset. Blood. 2001;97(10):3146–3151. doi:10.1182/blood.V97.10.3146.
- De Maria A, Bozzano F, Cantoni C, Moretta L. Revisiting human natural killer cell subset function revealed cytolytic CD56(dim)CD16+ NK cells as rapid producers of abundant IFN-gamma on activation. Proc Natl Acad Sci U S A. 2011;108(2):728–732. [published Online First: 12/27]. doi:10.1073/pnas.1012356108.
- Curd LM, Favors SE, Gregg RK. Pro-tumour activity of interleukin-22 in HPAFII human pancreatic cancer cells. Clin Exp Immunol. 2012;168(2):192–199. doi:10.1111/j.1365-2249.2012.04570.x.
- Brooks J, Fleischmann-Mundt B, Woller N, Niemann J, Ribback S, Peters K, Ekin Demir I, Armbrecht N, Ceyhan GO, Manns MP, et al. Perioperative, spatiotemporally coordinated activation of T and NK cells prevents recurrence of pancreatic cancer. Cancer Res. 2017. canres.2415.017. doi:10.1158/0008-5472.Can-17-2415.