
 ?Mathematical formulae have been encoded as MathML and are displayed in this HTML version using MathJax in order to improve their display. Uncheck the box to turn MathJax off. This feature requires Javascript. Click on a formula to zoom.
ABSTRACT
The tumor microenvironment (TME) of esophageal squamous cell carcinoma (ESCC) impacts tumor progression but is poorly understood. We obtained tumor tissues from 279 patients after esophagectomy and characterized the TME in intraepithelial and stromal regions using multiplex fluorescent immunohistochemistry (mfIHC). A heterogeneous immune population infiltrating tumor and the uninvolved esophageal tissue were observed. The infiltration of intraepithelial programmed death ligand 1 (PD-L1)-positive tumor-associated macrophages (TAMs) and stromal granzyme B+ activated cytotoxic T cells (aCTLs) correlated with both prolonged overall survival (OS) and disease-free survival (DFS). The intraepithelial memory T cell infiltration predicted longer OS, while intraepithelial and stromal regulatory T cell (Treg) infiltration was associated with shortened OS and DFS, respectively. Multivariate models combining immune infiltrates and clinicopathological factors outperformed tumor-node-metastasis (TNM) stage in predicting OS and DFS at 3 and 5 years. The infiltration of Treg inversely correlated with that of the antitumor effectors including CTLs, aCTLs, and natural killer (NK) cells. Intraepithelial memory T cell infiltration also negatively correlated with PD-L1 expression. In spatial analysis, intraepithelial dendritic cell (DC)-memory T cell engagement increased in high PD-L1+ TAM infiltration group. The characterization of the TME revealed a complex interplay between immune populations and may be employed to stratify patient for prognosis prediction and immunotherapy.
Introduction
Esophageal cancer is the sixth leading cause of cancer death worldwide, and esophageal squamous cell carcinoma (ESCC) is the most common type of esophageal cancer predominant in East Asia. Standard therapy includes endoscopic or surgical resection as well as chemoradiotherapy, but the 5-year survival rate remains very poor at approximately 20%.Citation1 Traditionally, clinical diagnoses and treatment strategies are primarily based on the assessment of tumors, such as the tumor-node-metastasis (TNM) staging system. However, large variations in clinical outcomes have been reported in patients with the same disease stage, suggesting that the present staging system is inadequate for evaluating prognosis and does not reflect the biological heterogeneity of ESCC. Based on tumor cell gene expression, various biomarkers have been reported to be associated with treatment responses and prognoses in ESCC.Citation2–4 However, tumors have increasingly been recognized as organs whose complexity approaches containing a repertoire of recruited, ostensibly normal cells that contribute to the tumor microenvironment (TME) in addition to cancer cells.Citation5 Mainly composed of host immune populations, these infiltrates are highly specialized, transcriptionally dynamic and extremely heterogeneous in regards to their phenotypes and functions, and have been implicated in each step of tumor development.Citation6–8 Therefore, infiltrating immune cells in the TME have become a focus of cancer research and pharmaceutical development.Citation9
Based on the immune landscape, cancer cells with high immunogenicity are considered to induce antitumor immunity in the early stage of tumor development. Natural killer (NK) cells control tumor growth and mediate a robust anti-metastatic effect by antibody-dependent cellular cytotoxicity, as well as cytokine and chemokine secretion.Citation10 Dendritic cells (DCs) initiate all adaptive immune responses by uptaking, processing, and presenting tumor antigens to activate CD8+ and CD4+ T cells.Citation11 CD8+ cytotoxic T cells (CTLs) play pivotal role in cytotoxic activity toward tumor cells, where activated CTLs (aCTLs) release cytotoxic granules leading to target cell death.Citation12 CD4+ helper T cells (Ths) are comprised of distinct subsets, mediating either pro- or anti-cancer immune response.Citation13 Following the effector phase, a pool of antigen-experienced cells expanded as memory T cells, persisting to provide durable immunological memory.Citation14 Meanwhile, cancer cells can also over-express inhibitory molecules such as programmed death ligand 1 (PD-L1) and induce regulatory cells such regulatory T cells (Tregs) to impair the antitumor immunity. PD-L1 can bind to programmed death-1 receptor (PD-1) on T cells and causes T cell anergy and apoptosis, renders tumor cells resistant to CTL-mediated lysis.Citation15 Tregs are capable of suppressing a wide range of antitumor immune responses, accelerating tumorigenesis, and enhancing metastasis.Citation16 Tumor-associated macrophages (TAMs), however, exist on a phenotypic spectrum, ranging from anti-tumoral M1 and pro-tumoral M2 state.Citation17,Citation18
Given that these tumor-infiltrating populations might affect the outcome of cancer to different extent, an increasing number of studies have explored the prognostic significance of host infiltrating immune populations; however, their clinical implications remain controversial in ESCC. For instance, Wang et al. reported that patients with high level of CTL had better overall survival (OS),Citation19 whereas others found that patient survival was independent of the level of CTL.Citation20 Similarly, Th infiltration was reported to be associated with better outcomes by Chen et al.,Citation21 while Hao et al. revealed that Th infiltration had no prognostic correlation.Citation22 Though Tregs possess immunosuppressive capacities in cancer immunity, Yoshioka claimed that Treg infiltration was not a factor to predict patient prognosis.Citation23 Although memory T cell infiltration levels were employed to predict prognosis in colorectal and breast cancers,Citation24,Citation25 there are limited available data about memory T cell infiltration in ESCC.Citation22,Citation26 As for PD-L1, while some studies have reported that PD-L1 expression was associated with poor prognosis,Citation27 others suggested that PD-L1 expression increased survival in ESCC patients.Citation28,Citation29 And prognostic significance of NK cell, DC, and TAM infiltration is insufficient in ESCC, which requires further exploration. It is noted that the numbers of cases were limited in some previous studies, which may bias the evaluation of statistical difference between groups. In addition, only one or two immune cells were determined in a single study, lacking complete evaluation of the complicated immune contexture of ESCC TME.
Due to the biological importance and controversial clinical implications of these markers and cells types, in this study, we used a novel tyramide signal amplification (TSA) multiplexing techniqueCitation30 and immunolabeled cells with pancytokeratin (panCK), CD68, CD11c, CD45RO, PD-L1, CD4, CD8A, CD56, granzyme B and forkhead box P3 (FoxP3) in the TME of resected human ESCC and peritumoral uninvolved esophageal tissue samples. Based on this, the associations of immune infiltrates including TAMs, DCs, memory T cells, CTLs, aCTLs, Ths, Tregs and NK cells in intraepithelial and stromal regions with ESCC patient clinicopathological features and outcomes were explored. Spatial analysis was also employed to explore the spatial distribution of immune infiltrates in addition to their infiltration levels.
Methods
Patients
A total of 279 pathological Stage Ib-IIIc ESCC patients (the 8th edition AJCC TNM staging system) who underwent complete esophagectomy at the Department of Thoracic Surgery from September 2002 to August 2012 were enrolled. Informed consent was received from patients. The patients were followed up every month for the first 3 months, every 3 months for the first year, every 6 months for the next 2 years, and then annually. OS was defined as the time from surgery to death, censoring patients who were still alive at the time of the last follow-up, and disease-free survival (DFS) as the time from surgery to the time with any signs or symptoms of ESCC. Tissue microarrays (TMAs) were constructed with formalin-fixed paraffin-embedded (FFPE) blocks of archived tumor specimens from the above 279 ESCC cases and 43 uninvolved esophageal epithelial specimens as described previously.Citation31 Two 1-mm cores from representative areas of each tumor or uninvolved esophageal epithelial sample were punched and arrayed on a recipient paraffin block.
Multiplex fluorescent immunohistochemistry (mfIHC) staining
Two 4-µm sections from TMA blocks were subjected to mfIHC using the PANO Multiplex IHC kit (0004100100, Panovue, Beijing, China) to examine specific cell markers including CD11c (ab52632, Abcam), CD45RO (55618, Cell Signaling), CD68 (ZM0060, ZSGB-Bio), panCK (4545, Cell Signaling), and PD-L1 (13684, Cell Signaling) in panel A, and CD4 (BX50023, biolynx), CD8A (70306, Cell Signaling), CD56 (3576, Cell Signaling), FoxP3 (320202, Biolegend), and granzyme B (ab4059, Abcam) in panel B. Different primary antibodies were sequentially applied, followed by horseradish peroxidase-conjugated secondary antibody incubation and TSA. The slides were microwave heat-treated after each TSA operation. Nuclei were stained with 4ʹ-6ʹ-diamidino-2-phenylindole (DAPI, D9524, Sigma-Aldrich) after all the human antigens had been labeled.
Multispectral imaging
Imaging was performed using a Vectra Multispectral Imaging System (PerkinElmer). One image per core was captured at 200 x magnification. Each 200 x multispectral image cube was created by combining images obtained every 10 nm of the emission light spectrum across the range of each emission filter cube. Five filter cubes were used for each image capture, including DAPI (440–680 nm), FITC (520–680 nm), CY3 (570–690 nm), CY5 (670–720 nm), and Texas Red (580–700 nm).
Image analysis
We used inForm Cell Analysis software (PerkinElmer) to batch analyze all images obtained from available cores. A library was made using single-antigen staining for each fluorophore, and multispectral images were unmixed with color-based identification. An algorithm was trained to segment tissue into intraepithelial and stromal regions based on panCK staining. Each cell was segmented into the nucleus, cytoplasm, and membrane compartments and assigned with specific spatial coordinates. Cells were phenotyped as tumoral or normal epithelial cells (ECs) (panCK+), TAMs (CD68+), DCs (CD11c+), memory T cells (CD45RO+), CTLs (CD8A+CD4−CD56−), granzyme B+ aCTLs (granzyme B+CD8A+CD4−CD56−), Ths (CD4+FoxP3−CD8A−), Tregs (CD4+FoxP3+CD8A−), and NK cells (CD56+), and the intensity for each marker in all compartments was recorded. All phenotyping and analysis were conducted while blinded to sample identification and clinical outcomes.
Spatial analysis
Each image with phenotyped cells was considered a bivariate planar marked point pattern, which can be characterized by the K-function using the spatstat R package. Ripley defined the K-function for a stationary point process so that K(r) is the expected number of other points of the process within a distance r of a typical point of the process.Citation32 The K-function is defined as follows:
Theoretically, the value of the K-function is K(r) = πr2, with cells of two types independent of each other satisfying the Poisson hypothesis.
A commonly used transformation of K is the L-function, which transforms the Poisson K-function to the straight line Lpois(r) = r, making the visual assessment of the graph much easier. The square root transformation also approximately stabilizes the variance of the estimator, making it easier to assess deviations. The L-function is defined as follows:
For each image, the L-function was estimated for a range of r from 0 to 20 μm, and the corresponding area under curve (AUC) was calculated to estimate intercellular engagements. Higher AUC value corresponded to higher engagement level.
Statistics
Statistical analyses of mfIHC data were performed with SPSS 25.0 (IBM Corporation). Statistical analyses of immunohistochemical quantifications were performed using a Student’s t-test or analysis of variance, as appropriate. ESCC patients were stratified into high or low immune infiltration groups based on the cutoff value defined by X-tile, which was substituted with the median value when X-tile suggested 0 for the cutoff value. The correlation between immunohistochemical quantifications and clinicopathological parameters were determined by chi-square analysis. For survival analysis, significant differences were evaluated with the log-rank test and plotted with Kaplan-Meier analysis. Factors with a P value < .1 in the log-rank test that satisfied Cox proportional hazard assumptions were included in multivariate Cox regression analysis with forward selection. Notably, when the correlation coefficient of various factors was larger than 0.8, only factors with lower P values in the log-rank test were included in the multivariate Cox regression analysis. The prognostic accuracies of the Cox models were evaluated using a time-dependent receiver operating characteristics (ROC) with timeROC R package. Coefficients of Spearman’s rank correlation or Pearson’s correlation were computed to describe associations among factors. A P value < .05 from a two-sided test was considered statistically significant.
Study approval
Collection of samples for this study and experiments performed were approved by the Ethics Committee of Sun Yat-sen University Cancer Center (GZR2020-275).
Results
Heterogeneous immune populations infiltrate ESCC and uninvolved esophageal tissue
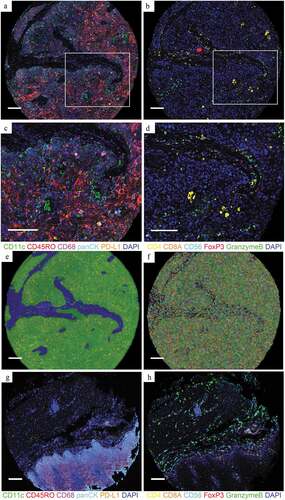
Samples of tumor cores from 279 patients with ESCC after esophagectomy and uninvolved esophageal tissue specimens from 43 patients were obtained for TMAs. With a novel multiplex immunolabelling protocol using opal fluorophores, we evaluated the ESCC immune microenvironment by staining FFPE tissue sections for panCK, CD68, CD11c, CD45RO, PD-L1, CD8A, CD4, CD56, granzyme B and FoxP3 ( and b), respectively. Based on these markers and the morphology, cells were phenotyped as tumoral or normal ECs (panCK+), TAMs (CD68+), DCs (CD11c+), memory T cells (CD45RO+), CTLs (CD8A+CD4−CD56−), aCTLs (granzyme B+CD8A+CD4−CD56−), Ths (CD4+FoxP3−CD8A−), Tregs (CD4+FoxP3+CD8A−), and NK cells (CD56+) ( and d). Tissues were segmented into intraepithelial and stromal regions () and cells were segmented into the nucleus, cytoplasm, and membrane compartments (). For each immune population, the ratio of the cell count to total cell count was calculated in intraepithelial and stromal regions separately, based on tissue segmentation, and each cell was visualized by cell segmentation for analysis. For comparison, cores of uninvolved esophageal tissue were also stained with the same protocol as tumor cores for panel A () and panel B (). Corresponding hematoxylin-eosin (HE) staining images of the tumor and uninvolved tissue were shown in Supplementary Figure 1. The average percentage of cell counts was calculated per patient when there were two TMA cores available. Cores were excluded if no tissue was analyzable due to inaccurate sampling position or tissue loss in processing. As a result, tumor cores from 269 and 220 patients for intraepithelial regions, and 268 and 224 patients for stromal regions were analyzed in panel A and panel B, respectively. Uninvolved tissue cores from 42 and 35 patients for intraepithelial regions, and 42 and 32 for stromal regions were analyzed in panel A and B, respectively.
Figure 1. Opal multiplex analysis of human ESCC identifies different immune subpopulations. (a and b) Representative images displaying the same TMA cores of tumor after multispectral merged imaging for panel A (a) and panel B (b). (c) Magnified subsection of the core outlined in (a) (green, CD11c; red, CD45RO; magenta, CD68; cyan, panCK; orange, PD-L1 and blue, DAPI). (d) Magnified subsection of the core outlined in (b) (yellow, CD4; orange, CD8; cyan, CD56; red, FoxP3; green, granzyme B and blue, DAPI). (e and f) Composite image subjected to tissue segmentation (e) and cell segmentation (f). (g and h) Representative images displaying the same TMA cores of uninvolved tissue after multispectral merged imaging for panel A (g) and panel B (h). All scale bars equal 200 μm
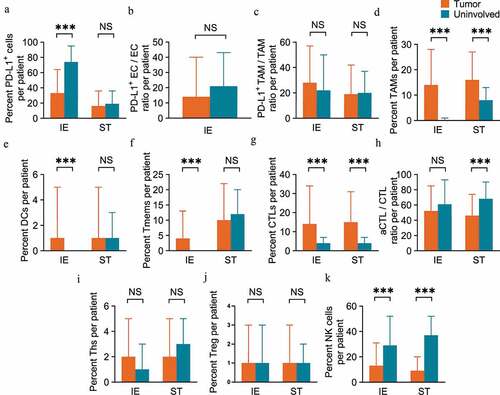
The immune infiltration level was compared between ESCC and peritumoral uninvolved esophageal epithelial tissues. There was positive expression of the immune checkpoint PD-L1 in both tumor and peritumoral tissues, and PD-L1+ cells in intraepithelial regions were present at a higher ratio in uninvolved tissue (74.28%) than in tumor tissue (32.59%, P < .001, unpaired t-test), while no significant difference was found in PD-L1+ cell infiltration in stromal regions between tumor tissue and uninvolved tissue (). Considering that ECs and TAMs were the major components that expressed PD-L1 in the TME, we also calculated the PD-L1+ EC/EC and PD-L1+ TAM/TAM ratios. The results revealed that there was no significant difference in the PD-L1+ EC/EC ratio between tumor tissue and uninvolved tissue (), and the same pattern was also observed for the PD-L1+ TAM/TAM ratio in both intraepithelial and stromal regions (). TAMs were more abundant in both the intraepithelial (14.29% vs. 0.43%, P < .001) and stromal regions (16.33% vs. 7.54%, P < .001) of tumors than in corresponding regions of uninvolved tissues (). We also observed elevated levels of both DCs and memory T cells infiltrating the intraepithelial regions of tumor tissue (0.88% and 4.01% for DCs and memory T cells, respectively) compared to that of the uninvolved tissues (0.01%, P < .001 for DCs and 0.25%, P < .001 for memory T cells, respectively), while no such difference was found in stromal regions ( and f). CTLs also infiltrated tumor tissue at a higher level in both intraepithelial (14.08% vs. 3.65%, P < .001) and stromal (14.54% vs. 4.43%, P < .001) regions than in uninvolved tissue (). However, the aCTL/CTL ratio decreased in tumor stromal regions (45.65%) as compared to that in uninvolved tissue (68.18%, P < .001), while the ratio was similar in intraepithelial regions of tumor tissue and tissues (). The Ths () and Tregs () were equally distributed in intraepithelial and stromal regions of both tumor and uninvolved tissues. In regard to the innate immune effectors, NK cells consistently decreased in both the intraepithelial (13.31% vs. 28.50%, P < .001) and stromal regions (8.73% vs. 37.29%, P < .001) of the tumor as compared to uninvolved tissue ().
Figure 2 ESCC tissue samples display heterogeneous populations of immune cell infiltrates. (a-f) Pairwise comparisons of the ratio of immune subpopulations in intraepithelial regions and stromal regions per patient for PD-L1+ cells (a), PD-L1+ EC/EC ratio (b), PD-L1+ TAM/TAM ratio (c), TAMs (d), DCs (e) and memory T cells (f) between tumoral (n=269 for IE, n=268 for ST) and peritumoral uninvolved esophageal tissue samples (n=42 for IE and ST). (g-k) CTLs (g), aCTL/CTL ratio (h), Ths (i), Tregs (j) and NK cells (k) between tumoral (n=220 for IE, n=224 for ST) and peritumoral uninvolved esophageal tissue samples (n=35 for IE, n=32 for ST). Significance was determined by an unpaired t-test. Data are presented as the mean ± standard deviation (s.d.). ***P<0.001, NS, not significant. IE, intraepithelial. ST, stromal
Association between immune infiltration and clinicopathological factors
The association of immune infiltration levels in intraepithelial (Supplemental Table 1) and stromal regions (Supplemental Table 2) with clinicopathological parameters was analyzed. The data revealed that intraepithelial NK cell infiltration correlated with sex (P = .002, chi-square test) and stromal NK cell infiltration correlated with age (P = .007). The infiltration levels of various immune subsets, including intraepithelial CTLs (P = .038), aCTLs (P = .030) and Ths (P = .015), as well as stromal PD-L1+ TAMs (P = .020), TAMs (P = .032), DCs (P = .014) and Ths (P = .012), were associated with tumor length. The differentiation degree was associated with the TAM infiltration level in intraepithelial regions (P = .006). No correlation was found between TNM stage and the immune infiltration level in either intraepithelial or stromal region.
Immune infiltration correlates with ESCC patient survival
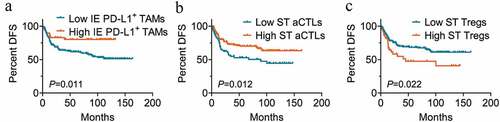
According to the cutoff value defined by X-tile, patients were stratified into high or low immune infiltration groups. For OS, high infiltration levels of memory T cells (P = .004 for intraepithelial regions; P = .009 for stromal regions, Kaplan-Meier analysis with the log-rank test) ( and b) and CTLs (P = .007 for intraepithelial regions; P = .028 for stromal regions) ( and d) in both intraepithelial and stromal regions were associated with better clinical outcomes. Though the difference was not significant in intraepithelial regions (P = .062) (), increased granzyme B+ aCTL infiltration in stromal regions was also significantly correlated with longer OS (P = .002) (). The high infiltration level of Tregs in stromal regions (P = .029) (), but not in intraepithelial regions (P = .064) (), correlated with a significant decrease in patient OS. A high ratio of PD-L1+ ECs was significantly associated with worse clinical outcomes for OS (P = .046) (), whereas patients who had high PD-L1+ TAM infiltration in intraepithelial regions had a prolonged OS time compared to those with low infiltration level, though the difference was not significant (P = .067) (). For DFS, the intraepithelial PD-L1+ TAM infiltration (P = .011) () and stromal aCTL infiltration (P = .012) () correlated with prolonged survival time, while Treg infiltration in stromal region (P = .022) () predicted shortened DFS in univariate analysis. There was no significant correlation between the infiltration level of TAMs, DCs, Ths, or NKs and OS or DFS in this cohort of patients. The results of univariate survival analyses with the log-rank test are presented in Supplemental Tables 3 and 4.
Figure 3. Immune cell infiltration in intraepithelial and stromal regions stratifies patient OS. (a-j) Overall survival analysis of patients based on the percentage of cell numbers per patient of intraepithelial (n=170 for low, n=99 for high) (a) and stromal memory T cells (n=222 for low, n=46 for high) (b), intraepithelial (n=92 for low, n=128 for high) (c) and stromal CTLs (n=110 for low, n=114 for high) (d), intraepithelial (n=110 for low, n=110 for high) (e) and stromal aCTLs (n=77 for low, n=147 for high) (f), stromal Tregs (n=179 for low, n=45 for high) (g) and intraepithelial (n=110 for low, n=110 for high) (h), PD-L1+ ECs (n=210 for low, n=59 for high) (i) and intraepithelial PD-L1+ TAMs (n=220 for low, n=49 for high) (j). Significance was determined using the log-rank test and Kaplan-Meier survival curves are presented. IE, intraepithelial. ST, stromal. OS, overall survival. DFS, disease free survival
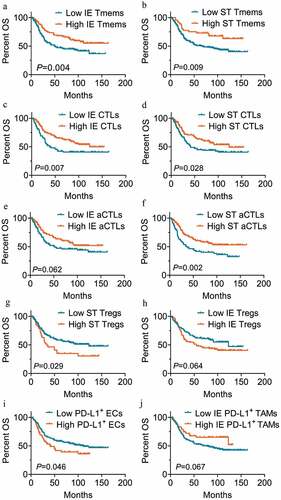
Figure 4. Immune cell infiltration in intraepithelial and stromal regions stratifies patient DFS. (a-c) Disease free survival analysis of patients based on the percentage of cell numbers per patient of intraepithelial PD-L1+ TAM (n=220 for low, n=49 for high) (a), stromal aCTLs (n=77 for low, n=147 for high) (b) and Tregs (n=179 for low, n=45 for high) (c). High and low infiltration groups were divided based on the cutoff value suggested by X-tile or the median percentage of the ratio when X-tile suggested 0 for the cutoff value. Significance was determined using the log-rank test and Kaplan-Meier survival curves are presented. IE, intraepithelial. ST, stromal. DFS, disease free survival
As for clinicopathological parameters (), only the TNM stage had a significant impact on OS (P < .001) and DFS (P = .007) by Kaplan-Meier analysis with the log-rank test. Patients in the younger group had a longer OS time than those in the elderly age group, but the difference was not significant (P = .075).
Table 1. Univariate analysis of clinicopathological factors for overall survival and disease free survival in ESCC
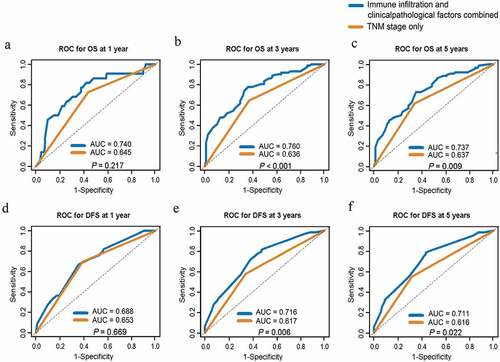
To investigate whether immune infiltrates were independent prognostic factors, a multivariate analysis with a Cox regression model was performed. Notably, the correlation coefficient of intraepithelial and stromal aCTL infiltration was larger than 0.8; therefore, only stromal aCTL infiltration, with a lower P value in the log-rank test, was included in multivariate Cox regression analysis for OS. As shown in , the infiltration of memory T cell [hazard ratio (HR) = 0.514, 95% confidence interval (CI): 0.323–0.818, P = .005], Treg (HR = 1.525, 95%CI: 1.023–2.274, P = .038), and PD-L1+ TAM (HR = 0.416, 95%CI: 0.225–0.769, P = .005) in intraepithelial regions, and granzyme B+ aCTL in stromal regions (HR = 0.655, 95%CI: 0.434–0.987, P = .043) were associated with OS independently of the TNM stage (HR = 2.391, 95%CI: 1.594–3.587, P < .001) and age (HR = 1.548, 95%CI: 1.033–2.319, P = .034). And the intraepithelial PD-L1+ TAM infiltration (HR = 0.37, 95%CI: 0.169–0.811, P = .013), stromal aCTL (HR = 0.559, 95%CI: 0.352–0.888, P = .014) and Treg infiltration (HR = 1.729, 95%CI: 1.031–2.900, P = .038) correlated with DFS independent of the TNM stage (HR = 1.99, 95%CI: 1.256–3.152, P = .003) (). As shown in , the multivariate models combining immune infiltrates and clinicopathological factors outperformed the models with TNM staging only for both OS and DFS at 3 and 5 years with statistical significances.
Table 2. Multivariate survival analysis of immune infiltration level and clinicopathological factors for overall survival
Table 3. Multivariate survival analysis of immune infiltration level and clinicopathological factors for disease free survival
Figure 5. AUC comparison between Cox models of immune infiltration and clinicopathological factors combined and TNM stage only for ESCC prognosis prediction. (a-c) ROC curves of prognostic models combing immune infiltrates and clinicopathological factors or TNM stage only for OS at 1 year (a), 3 years (b) and 5 years (c). (d-f) ROC curves of prognostic models combing immune infiltrates and clinicopathological factors or TNM stage only for DFS at 1 year (d), 3 years (e) and 5 years (f). ROC, receiver operating characteristics; AUC, area under curve. TNM, tumor-node-metastasis. OS, overall survival. DFS, disease free survival
Prognostic associations of immune infiltration in subgroups of TNM stage
The prognostic associations of immune infiltrates with significant difference in above univariate and multivariate survival analyses were further analyzed in subgroups of TNM stage. In Kaplan-Meier analysis, decreased level of PD-L1+ ECs (P = .031) and increased levels of intraepithelial memory T cell (P = .018) and CTL infiltration (P = .049) as well as stromal aCTL infiltration (P = .003) were associated with prolonged OS in Stage I–II cases, but not in Stage III ones. A similar differential prognostic association was observed that increased intraepithelial PD-L1+ TAM infiltration (P = .045) and stromal aCTL infiltration (P = .049) as well as decreased stromal Treg infiltration (P = .041) correlated with longer DFS in Stage I–II patients, but not in Stage III ones. Notably, memory T cell infiltration level in stromal region was associated with prolonged OS in Stage III patients (P = .029), but not Stage I–II one. The results of univariate analyses of OS and DFS in subgroups of TNM stage are summarized in Supplemental Table 5 and 6. Multivariate Cox analyses were performed to determine the independent prognostic factors for patients in Stage I–II and Stage III, respectively. As shown in Supplemental Table 7, the infiltration of intraepithelial PD-L1+ TAMs (HR = 0.37; 95%CI: 0.142–0.965, P = .042), memory T cells (HR = 0.292; 95%CI: 0.126–0.673, P = .004), and stromal aCTLs (HR = 0.451; 95%CI: 0.240–0.847, P = .013) were independent prognostic factors for OS in Stage I–II cases, while the intraepithelial PD-L1+ TAM infiltration (HR = 0.43; 95%CI: 0.192–0.963, P = .04) and age (HR = 2.028, 95%CI: 1.192–3.448, P = .009) were associated with OS in Stage III cases. However, no immune infiltrate remains significantly associated with DFS in any subgroup of TNM stage. Therefore, the prognostic association of immune infiltration was more significant in Stage I–II patients as compared to Stage III ones.
Treg infiltration correlates with decreased antitumor immune effector infiltration
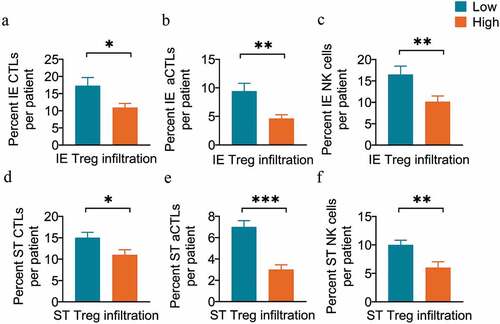
The microenvironment of ESCC is characterized by both antitumoral and regulatory immune subsets, such as Tregs, which impair antitumoral immunity and promote tumor progression.Citation6,Citation33 Our results revealed that patients in the high Treg infiltration group had a significantly lower infiltration of several antitumor immune effectors, including the CTLs (10.91% vs. 17.26%, P = .02, unpaired t-test) (), aCTLs (4.63% vs. 9.41%, P = .002) (), and NK cells (10.13% vs. 16.48%, P = .008) () in intraepithelial regions. Similar results were observed in stromal regions, where the infiltration levels of CTLs (11.12% vs. 15.41%, P = .012) (), aCTLs (3.48% vs. 6.84%, P < .001) () and NK cells (5.67% vs. 9.50%, P = .006) () significantly decreased in the high stromal Treg infiltration group.
Figure 6. Tregs are associated with decreased antitumor effector infiltration. (a-c) Pairwise comparisons of the percent of cell counts for CTLs (a), aCTLs (b) and NK cells (c) between the high (n=110) and low Treg infiltration groups (n=110) in intraepithelial regions per patient. (d-f) Pairwise comparisons of the percent of cell counts for CTLs (d), aCTLs (e), and NK cells (f) between the high (n=45) and low Treg infiltration groups (n=179) in stromal regions per patient. Significance was determined by an unpaired t-test. Data are presented as the mean ± standard error of the mean (s.e.m.). *P<0.05, **P<0.01, ***P<0.001. IE, intraepithelial. ST, stromal
Memory T cell infiltration is positively correlated with DC infiltration but negatively correlated with PD-L1 expression
In addition to immune effectors in the TME, the role of memory T cells is also essential in the adaptive immune response to cancer. Correlation analyses revealed positive associations of infiltration levels between memory T cells and several effector T lymphocytes, including CTLs (rs = 0.286, P < .001) (), Ths (rs = 0.380, P < .001) () and Tregs (rs = 0.148, P = .030) () in intraepithelial regions. The correlations are partly because that the same markers are shared by the subpopulations of memory and effector T cells during stepwise cell differentiation.Citation14,Citation34 Interestingly, the infiltration level of memory T cells was found to be positively correlated with that of the DCs (rs = 0.195, P = .001) (), but negatively with that of PD-L1-expressing subpopulations, including PD-L1+ cells (rs = −0.304, P < .001) (), PD-L1+ ECs (rs = −0.310, P < .001) () and PD-L1+ TAMs (rs = −0.245, P < .001) () in intraepithelial regions, respectively. However, there was no significant association of the infiltration levels of memory T cells with DCs or any PD-L1-expressing subpopulation in the stromal regions.
Figure 7. Memory T cells are associated with other immune populations in intraepithelial regions. Correlation analysis between the percent of cell counts for memory T cells and other populations, including CTLs (a), Ths (b), Tregs (c), DCs (d), PD-L1+ cells (e), PD-L1+ ECs (f), and PD-L1+ TAMs (g) in intraepithelial regions per patient. The Spearman correlation coefficient (rs) and significance levels (P value) are presented for each correlation and area between the dashed line for the 95% CI. IE, intraepithelial. ST, stromal
DC-memory T cell engagement increased in high intraepithelial PD-L1+ TAM infiltration group
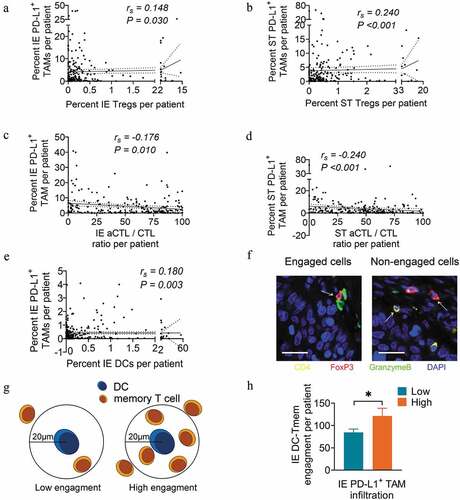
In addition to the negative association with memory T cell infiltration as shown in , the infiltration level of PD-L1+ TAM also correlated positively with Treg infiltration (rs = 0.148, P = .03 for intraepithelial regions; rs = 0.240, P < .001 for stromal regions) ( and b), but negatively with that of aCTL/CTL ratio in both intraepithelial (rs = −0.176, P = .01) and stromal regions (rs = −0.24, P < .001) ( and d). This is consistent with previous reports that TAMs could impair the T cell response by directly expressing PD-L1 on the membrane and recruiting infiltrating Tregs into the TME.Citation17 However, the PD-L1+ TAM infiltration level was positively associated with DC infiltration in intraepithelial regions (rs = 0.180, P = .003) (). Regarding that the immune subsets may present distinct spatial distribution pattern in the TME where close proximity allows for effective cellular interactions ( and g),Citation35 we performed spatial analysis with the engagement level as a quantitative index to better interpret cellular interactions. Spatial analysis revealed a significantly increased engagement level of memory T cells within 20 μm around DCs in the high PD-L1+ TAM infiltration group compared to the low PD-L1+ TAM infiltration group (P = .040) ().
Figure 8. PD-L1+ TAM infiltration is associated with the infiltration and engagement level of other immune populations. (a and b) Correlation analysis between the percent of cell counts for PD-L1+ TAMs and Tregs in intraepithelial (a) and stromal (b) regions per patient. (c and d) Correlation analysis between the percent of cell counts for PD-L1+ TAMs and aCTL/CTL ratio in intraepithelial (c) and stromal (d) regions per patient. (e) Correlation analysis between the percent of cell counts for PD-L1+ TAMs and DCs in intraepithelial regions per patient. (f) Schema depicting engaged or nonengaged immune cells. (g) Schema depicting low or high memory T cell engagement within a radius of 20 μm from the nucleus of an DC at the center. (h) Pairwise comparison of DC-memory T cell engagement levels between the high (n=41) and low PD-L1+ TAM infiltration groups (n=177) in intraepithelial regions per patient. Spearman correlation coefficient (rs) and significance levels (P value) presented for each correlation and area between dashed line for 95% CI. In pairwise comparisons, significance was determined by an unpaired t-test, and data are presented as the mean ± s.d. *P<0.05. IE, intraepithelial. ST, stromal. All scale bars equal 20 μm
Discussion
Since tumor progression has been considered a result of the dynamic balance between an invasive tumor process and a defense system, with patient prognosis and responses to immunotherapy effectively dictated by the abundance, composition, activity, and spatial distribution of immune infiltrates and molecules, the consensus has grown that TME components, particularly immune infiltrates, should be evaluated in standard tumor pathological scoring.Citation36,Citation37 Immune cell types are easier to quantify with well-characterized markers and cell counting can be performed faster with digital pathology.Citation38 Though traditional chromogenic IHC visualizes cellular morphology and the relative distribution, inaccurate phenotyping and inconsistent interpretation among investigators exist. Other methods, such as flow cytometry, enhance the accuracy of phenotyping but inevitably lose information about intercellular distance and interactions in situ. As a novel methodology, mfIHC combines the merits of multi-antigen recognition and intact tissue structure retention, allowing for the comprehensive characterization of the complex immune milieu of tumor tissues. mfIHC also avoids overestimating the abundance of immune infiltration when markers are not specific to one phenotype. To examine the complex TME of ESCC, we applied mfIHC to TMAs comprised tumor and paired uninvolved tissues obtained from ESCC patients after esophagectomy, and the analysis was performed in intraepithelial and stromal regions, respectively, for that the histological location and specific microenvironment may contribute to immune cell heterogeneity.Citation17
We found diverse cell populations infiltrating the microenvironment of ESCC, including antitumor subsets that activate inflammation and promote survival as well as regulatory subsets that attenuate antitumor immunity and support tumorigenesis. Among various proinflammatory populations, CTLs are the robust immune effectors against tumors, and their infiltration level in both regions of the tumor was elevated compared to that in uninvolved tissue and was significantly correlated with prolonged OS. Similarly, the infiltration level of the aCTLs in stromal regions, a subpopulation of CTLs eliminating tumor cells by releasing cytotoxic granules, was significantly correlated with prolonged ESCC survival. This result highlighted the significant role of stromal aCTL in antitumor response, as more T cells need to be activated outside the tumor and trafficked into tumor tissue to control tumor growth.Citation39 Despite these infiltrating antitumor effectors, failed immunosurveillance and tumor rejection outlined that there were immunosuppressive populations as counteracting forces in the TME. High infiltration of the immunosuppressive Tregs in stromal regions was identified to be correlated with a significant decrease in ESCC patient survival in our study. Furthermore, the significantly decreased infiltration of several antitumor immune effectors, including CTLs, aCTLs and NK cells, was observed in patients in the high Treg infiltration group compared to the low infiltration group, in both intraepithelial and stromal regions. These results provided evidences for the notion that Tregs function to suppress anti-tumoral immunity in ESCC.
In the tumor-specific adaptive immune responses, effector cells are short-lived cells, while memory cells have the potential for long-term survival and rapidly eliminate cancer cells during antigen re-encounter after immunization with antigens presented by antigen-presenting cells such as DCs.Citation34,Citation40 In our study, the infiltration level of memory T cells and DCs significantly increased in tumoral epithelia compared to uninvolved tissue. And memory T cell infiltration is positively correlated with DC infiltration, but negatively with PD-L1+ subpopulation infiltrations, in the intraepithelial regions of ESCC specimens. In tumor immunity, DCs re-stimulate established primed T cells in TME leading to efficient killing of tumor cells and the consequent linear differentiation of these T cells gives rise to diverse memory cell subsets.Citation11 These results highlight the importance of DC cells in boosting the generation of memory T cells, which could be antagonized by PD-L1-expressing cells.Citation15,Citation41,Citation42 It is interesting that the positive correlation between the infiltration levels of memory T and DC cells was only observed in intraepithelial but not stromal regions, probably because that more tumor antigens could be taken up and presented to T cells by DCs cells in intraepithelial regions. By uni- and multivariate survival analyses, increased memory T cells infiltration in tumoral epithelial regions was identified as an independent prognostic factor for prolonged OS in ESCC patients, underlying the importance of memory T cells as a long-term protector against tumor re-challenge.
In our study, there was no significant difference of PD-L1+ TAM distribution in either intraepithelial or stromal regions between tumor and uninvolved tissues. But the infiltration level of PD-L1+ TAMs was correlated negatively with aCTL/CTL ratio, while positively correlated with Treg infiltration in both intraepithelial and stromal regions, suggesting an immuno-suppressive role of PD-L1+ TAM in ESCC. This is consistent with previous reports that PD-L1+ TAMs exerted a negative impact on antitumor responses by inhibiting CTL function, inducing CTL apoptosis and recruiting Treg infiltrates into the TME.Citation39,Citation43 However, we also find that the DC infiltration positively correlated with intraepithelial PD-L1+ TAM infiltration and the engagement of DC-memory T cell in the intraepithelial regions was significantly increased in high PD-L1+ TAM infiltration group as compared to low PD-L1+ TAM group. Increased DC-memory T cell engagement may suggest an elevated level of memory T cell hyper-proliferation and augmented effector responses, which are biological features for hot tumors characterized by high degree of T cell infiltration and checkpoint activation.Citation44 However, the correlations with DC-memory T cell engagement were not observed for TAMs. TAMs are historically defined as M1 and M2 in vitro as pro-inflammatory or anti-inflammatory, respectively.Citation17 Yang et al.Citation7 reported that PD-L1 was highly expressed in the pro-inflammatory TAM M1 subtype, rather than M2, in an ESCC mouse model. Our results revealed that the presence of PD-L1+ TAMs, though characterized by their immunosuppressive capacity, might be implicated in the interaction of preexisting proinflammatory and memory subsets and be indicative of a more immunogenic TME. This observation was consistent with our survival analysis result that enhanced intraepithelial PD-L1+ TAM infiltration predicted favorable outcomes in ESCC, which could be the complicated manifestation of its both immunosuppressive and pro-inflammatory capacities.
With diverse immune infiltrates showing prognostic implication, prognostic models have been constructed in combination of essential immune populations to tailor therapies to the tumor microenvironment. For instance, the Immunoscore was proposed combining the evaluation of CTL and memory T cell infiltration in the tumor.Citation24,Citation45 Though Immunoscore showed substantial prognostic power for some types of cancer, it may be too simplistic to provide a thorough evaluation of the TME, for that only survival-favorable immune phenotypes were included and the impact of inhibitory subsets and molecules was overlooked. Furthermore, as we found in this study, immune infiltrates from different regions of tumor specimens had different prognostic roles and it requires finer region division to analyze immune infiltration levels. Based on this, we constructed multivariate models combining regional immune infiltrations and clinicopathological factors. Our models significantly outperformed TNM staging at 3 and 5 years for OS and DFS prediction of ESCC. There, the ESCC immune infiltrates provided prognostic value complementing that of clinicopathological features.
We have to admit that there were deficiencies in our study. Firstly, there was an inevitable disadvantage for TMA’s susceptibility to errors caused by tissue heterogeneity, which may result in missing rare events or inaccurately quantifying histological characteristics. However, TMA allows for analyzing presumptive candidate biomarkers in tissue specimens from a large number of different patients simultaneously, offering a high level of experimental uniformity and providing a judicious use of precious tissue. In our study, two tissue cores were taken to represent the TME for each case to reduce the impact of tissue heterogeneity. More importantly, it should be noted that TMA are intended to estimate the prevalence of selected markers within a large population of samples, rather than to provide a detailed analysis at the level of single specimen. A lot of studies have taken full advantages of TMA to characterize TME.Citation46 Further studies on the whole tissue section would aid in showing the heterogeneity of ESCC TME. Secondly, we performed the multicolor staining in two panels separately, which forbade the spatial analysis of phenotypes in different panels, such as EC-CTL engagement level. The incomplete spatial analysis requires further improvement in future study.
In summary, our study reveals the immune infiltrates in ESCC. The prognostic implication of certain immune phenotypes in different regions and interrelationships among several adaptive immune cells highlight the complicated immune contexture of ESCC TME. Among these immune cells, the intraepithelial PD-L1+ TAM, memory T cell, Treg as well as stromal aCTL and Treg demonstrate clinical significance and could be potential biomarkers incorporated in to clinical routine for prognostic prediction. Our study offers insights into the tumor immunity in ESCC and can be harnessed toward effective immunotherapy strategies.
Disclosure of potential conflicts of interest
No potential conflicts of interest were disclosed.
Correction Statement
This article has been republished with minor changes. These changes do not impact the academic content of the article.
Supplemental Material
Download ()Acknowledgments
CP, MX, SZ, JF and JW participated in the conception or design of the work. CP, YW, YH and XX contributed to data acquisition. CP, YW, QL and JW participated in data analysis and interpretation. CP and JW participated in drafting the manuscript. All authors contributed to the critical revision and had final approval of the version to be published
Supplementary material
Supplemental data for this article can be accessed on the publisher’s website.
Additional information
Funding
References
- Hong Y, Ding ZY. PD-1 inhibitors in the advanced esophageal cancer. Front Pharmacol. 2019;10:1418. doi:10.3389/fphar.2019.01418.
- Wen J, Wang G, Xie X, Lin G, Yang H, Luo K, Liu Q, Ling Y, Xie X, Lin P, et al. Prognostic value of a Four-miRNA signature in patients with lymph node positive locoregional esophageal squamous cell carcinoma undergoing complete surgical resection. Ann Surg. 2019 Apr 30. doi:10.1097/SLA.0000000000003369.
- Wen J, Luo K, Liu H, Liu S, Lin G, Hu Y, Zhang X, Wang G, Chen Y, Chen Z, et al. MiRNA expression analysis of pretreatment biopsies predicts the pathological response of esophageal squamous cell carcinomas to neoadjuvant chemoradiotherapy. Ann Surg. 2016 May;263(5):942–13. doi:10.1097/SLA.0000000000001489.
- Wen J, Yang H, Liu MZ, Luo KJ, Liu H, Hu Y, Zhang X, Lai RC, Lin T, Wang HY, et al. Gene expression analysis of pretreatment biopsies predicts the pathological response of esophageal squamous cell carcinomas to neo-chemoradiotherapy. Ann Oncol. 2014 Sep;25(9):1769–1774. doi:10.1093/annonc/mdu201.
- Hanahan D, Weinberg RA. Hallmarks of cancer: the next generation. Cell. 2011 Mar 4;144(5):646–674. doi:10.1016/j.cell.2011.02.013.
- Yue Y, Lian J, Wang T, Luo C, Yuan Y, Qin G, Zhang B, Zhang Y. Interleukin-33-nuclear factor-kappaB-CCL2 signaling pathway promotes progression of esophageal squamous cell carcinoma by directing regulatory T cells. Cancer Sci. 2020 Mar;111(3):795–806. doi:10.1111/cas.14293.
- Yang H, Zhang Q, Xu M, Wang L, Chen X, Feng Y, Li Y, Zhang X, Cui W, Jia X, et al. CCL2-CCR2 axis recruits tumor associated macrophages to induce immune evasion through PD-1 signaling in esophageal carcinogenesis. Mol Cancer. 2020 Feb 27;19(1):41. doi:10.1186/s12943-020-01165-x.
- Bruno A, Ferlazzo G, Albini A, Noonan DM. A think tank of TINK/TANKs: tumor-infiltrating/tumor-associated natural killer cells in tumor progression and angiogenesis. J Natl Cancer Inst. 2014 Aug;106(8):dju200. doi:10.1093/jnci/dju200.
- Huang TX, Fu L. The immune landscape of esophageal cancer. Cancer Commun (Lond). 2019 Nov 26;39(1):79. doi:10.1186/s40880-019-0427-z.
- Melaiu O, Lucarini V, Cifaldi L, Fruci D. Influence of the tumor microenvironment on NK cell function in solid tumors. Front Immunol. 2019;10:3038. doi:10.3389/fimmu.2019.03038.
- Fu C. Dendritic Cells and CD8 T cell immunity in tumor microenvironment. Front Immunol. 2018;9:3059. doi:10.3389/fimmu.2018.03059.
- Farhood B, Najafi M, Mortezaee K. CD8(+) cytotoxic T lymphocytes in cancer immunotherapy: A review. J Cell Physiol. 2019 Jun;234(6):8509–8521. doi:10.1002/jcp.27782.
- Chraa D, Naim A, Olive D, Badou A. T lymphocyte subsets in cancer immunity: friends or foes. J Leukoc Biol. 2019 Feb;105(2):243–255. doi:10.1002/jlb.Mr0318-097r.
- Reading JL, Galvez-Cancino F, Swanton C, Lladser A, Peggs KS, Quezada SA. The function and dysfunction of memory CD8(+) T cells in tumor immunity. Immunol Rev. 2018 May;283(1):194–212. doi:10.1111/imr.12657.
- Oliva S, Troia R, D’Agostino M, Boccadoro M, Gay F. Promises and pitfalls in the use of PD-1/PD-L1 inhibitors in multiple myeloma. Front Immunol. 2018 Nov 27;9(1664–3224 (Electronic)):2749. doi:10.3389/fimmu.2018.02749.
- Nishikawa H, Sakaguchi S. Regulatory T cells in tumor immunity. Int J Cancer. 2010 Aug 15;127(4):759–767. doi:10.1002/ijc.25429.
- DeNardo DG, Ruffell B. Macrophages as regulators of tumour immunity and immunotherapy. Nat Rev Immunol. 2019 Jun;19(6):369–382. doi:10.1038/s41577-019-0127-6.
- Miyashita T, Tajima H, Shah FA, Oshima M, Makino I, Nakagawara H, Kitagawa H, Fujimura T, Harmon JW, Ohta T, et al. Impact of inflammation-metaplasia-adenocarcinoma sequence and inflammatory microenvironment in esophageal carcinogenesis using surgical rat models. Ann Surg Oncol. 2014 Jun;21(6):2012–2019. doi:10.1245/s10434-014-3537-5.
- Wang W, Chen D, Zhao Y, Zhao T, Wen J, Mao Y, Chen C, Sang Y, Zhang Y, Chen Y, et al. Characterization of LAG-3, CTLA-4, and CD8+ TIL density and their joint influence on the prognosis of patients with esophageal squamous cell carcinoma. Ann Transl Med. 2019 Dec;7(23):776. doi:10.21037/atm.2019.11.38.
- Wang J, Jia Y, Wang N, Zhang X, Tan B, Zhang G, Cheng Y. The clinical significance of tumor-infiltrating neutrophils and neutrophil-to-CD8+ lymphocyte ratio in patients with resectable esophageal squamous cell carcinoma. J Transl Med. 2014 Jan 7;12:7. doi:10.1186/1479-5876-12-7.
- Chen K, Zhu Z, Zhang N, Cheng G, Zhang F, Jin J, Wu J, Ying L, Mao W, Su D, et al. Tumor-infiltrating CD4+ lymphocytes predict a favorable survival in patients with operable esophageal squamous cell carcinoma. Med Sci Monit. 2017 Sep 26;23:4619–4632. doi:10.12659/msm.904154.
- Hao J, Li M, Zhang T, Yu H, Liu Y, Xue Y, An R, Wang S. Prognostic value of tumor-infiltrating lymphocytes differs depending on lymphocyte subsets in esophageal squamous cell carcinoma: an updated meta-analysis. Front Oncol. 2020;10(2234–943X (Print)):614. doi:10.3389/fonc.2020.00614.
- Yoshioka T, Miyamoto M, Cho Y, Ishikawa K, Tsuchikawa T, Kadoya M, Li L, Mishra R, Ichinokawa K, Shoji Y, et al. Infiltrating regulatory T cell numbers is not a factor to predict patient’s survival in oesophageal squamous cell carcinoma. Br J Cancer. 2008 Apr 8;98(7):1258–1263. doi:10.1038/sj.bjc.6604294.
- Mlecnik B, Bindea G, Angell HK, Maby P, Angelova M, Tougeron D, Church SE, Lafontaine L, Fischer M, Fredriksen T, et al. Integrative analyses of colorectal cancer show immunoscore is a stronger predictor of patient survival than microsatellite instability. Immunity. 2016 Mar 15;44(3):698–711. doi:10.1016/j.immuni.2016.02.025.
- Savas P, Virassamy B, Ye C, Salim A, Mintoff CP, Caramia F, Salgado R, Byrne DJ, Teo ZL, Dushyanthen S, et al. Single-cell profiling of breast cancer T cells reveals a tissue-resident memory subset associated with improved prognosis. Nat Med. 2018 Jul;24(7):986–993. doi:10.1038/s41591-018-0078-7.
- Enomoto K, Sho M, Wakatsuki K, Takayama T, Matsumoto S, Nakamura S, Akahori T, Tanaka T, Migita K, Ito M, et al. Prognostic importance of tumour-infiltrating memory T cells in oesophageal squamous cell carcinoma. Clin Exp Immunol. 2012 May;168(2):186–191. doi:10.1111/j.1365-2249.2012.04565.x.
- Yagi T, Baba Y, Ishimoto T, Iwatsuki M, Miyamoto Y, Yoshida N, Watanabe M, Baba H. PD-L1 expression, tumor-infiltrating lymphocytes, and clinical outcome in patients with surgically resected esophageal cancer. Ann Surg. 2019 Mar;269(3):471–478. doi:10.1097/SLA.0000000000002616.
- Chen K, Cheng G, Zhang F, Zhang N, Li D, Jin J, Wu J, Ying L, Mao W, Su D, et al. Prognostic significance of programmed death-1 and programmed death-ligand 1 expression in patients with esophageal squamous cell carcinoma. Oncotarget. 2016 May 24;7(21):30772–30780. doi:10.18632/oncotarget.8956.
- Jiang D, Song Q, Wang H, Huang J, Wang H, Hou J, Li X, Xu Y, Sujie A, Zeng H, et al. Independent prognostic role of PD-L1expression in patients with esophageal squamous cell carcinoma. Oncotarget. 2017 Jan 31;8(5):8315–8329. doi:10.18632/oncotarget.14174.
- Stack EC, Wang C, Roman KA, Hoyt CC. Multiplexed immunohistochemistry, imaging, and quantitation: a review, with an assessment of Tyramide signal amplification, multispectral imaging and multiplex analysis. Methods. 2014 Nov;70(1):46–58. doi:10.1016/j.ymeth.2014.08.016.
- Wen J, Luo KJ, Hu Y, Yang H, Fu JH. Metastatic lymph node CHIP expression is a potential prognostic marker for resected esophageal squamous cell carcinoma patients. Ann Surg Oncol. 2013 May;20(5):1668–1675. doi:10.1245/s10434-012-2733-4.
- Baddeley A, Rubak E, Turner R. Spatial point patterns: methodology and applications with R. CRC Press; Boca Raton, Florida, USA. 2015.
- Yagi T, Baba Y, Okadome K, Kiyozumi Y, Hiyoshi Y, Ishimoto T, Iwatsuki M, Miyamoto Y, Yoshida N, Watanabe M, et al. Tumour-associated macrophages are associated with poor prognosis and programmed death ligand 1 expression in oesophageal cancer. Eur J Cancer. 2019 Apr;111(1879–0852 (Electronic)):38–49. doi:10.1016/j.ejca.2019.01.018.
- Golubovskaya V, Wu L. Different subsets of T cells, memory, effector functions, and CAR-T immunotherapy. Cancers (Basel). 2016 Mar 15;8(3):36. doi:10.3390/cancers8030036.
- Nagl S, Haas M, Lahmer G, Büttner-Herold M, Grabenbauer GG, Fietkau R, Distel LV. Cell-to-cell distances between tumor-infiltrating inflammatory cells have the potential to distinguish functionally active from suppressed inflammatory cells. Oncoimmunology. 2016 May;5(5):e1127494. doi:10.1080/2162402X.2015.1127494.
- Galon J, Pages F, Marincola FM, Angell HK, Thurin M, Lugli A, Zlobec I, Berger A, Bifulco C, Botti G, et al. Cancer classification using the Immunoscore: a worldwide task force. J Transl Med. 2012 Oct 3;10(1479–5876 (Electronic)):205. doi:10.1186/1479-5876-10-205.
- Lin EW, Karakasheva TA, Hicks PD, Bass AJ, Rustgi AK. The tumor microenvironment in esophageal cancer. Oncogene. 2016 Oct 13;35(41):5337–5349. doi:10.1038/onc.2016.34.
- Galon J, Mlecnik B, Bindea G, Angell HK, Berger A, Lagorce C, Lugli A, Zlobec I, Hartmann A, Bifulco C, et al. Towards the introduction of the ‘Immunoscore’ in the classification of malignant tumours. J Pathol. 2014 Jan;232(2):199–209. doi:10.1002/path.4287.
- Tang H, Liang Y, Anders RA, Taube JM, Qiu X, Mulgaonkar A, Liu X, Harrington SM, Guo J, Xin Y, et al. PD-L1 on host cells is essential for PD-L1 blockade-mediated tumor regression. J Clin Invest. 2018 Feb 1;128(2):580–588. doi:10.1172/JCI96061.
- Gardner A, Ruffell B. Dendritic cells and cancer immunity. Trends Immunol. 2016 Dec;37(12):855–865. doi:10.1016/j.it.2016.09.006.
- Allie SR, Zhang W, Fuse S, Usherwood EJ. Programmed death 1 regulates development of central memory CD8 T cells after acute viral infection. J Immunol. 2011 Jun 1;186(11):6280–6286. doi:10.4049/jimmunol.1003870.
- Gibbons RM, Liu X, Pulko V, Pulko V, Harrington SM, Krco CJ, Kwon ED, Dong H. B7-H1 limits the entry of effector CD8(+) T cells to the memory pool by upregulating Bim. Oncoimmunology. 2012 Oct 1;1(7):1061–1073. doi:10.4161/onci.20850.
- Francisco LM, Salinas VH, Brown KE, Vanguri VK, Freeman GJ, Kuchroo VK, Sharpe AH PD-L1 regulates the development, maintenance, and function of induced regulatory T cells. J Exp Med. 2009 Dec 21;206(13):3015–3029. doi:10.1084/jem.20090847.
- Galon J, Bruni D. Approaches to treat immune hot, altered and cold tumours with combination immunotherapies. Nat Rev Drug Discov. 2019 Mar;18(3):197–218. doi:10.1038/s41573-018-0007-y.
- Angell H, Galon J. From the immune contexture to the Immunoscore: the role of prognostic and predictive immune markers in cancer. Curr Opin Immunol. 2013 Apr;25(2):261–267. doi:10.1016/j.coi.2013.03.004.
- Wu C, Lin J, Weng Y, Zeng D-N, Xu J, Luo S, Xu L, Liu M, Hua Q, Liu C-Q, et al. Myeloid signature reveals immune contexture and predicts the prognosis of hepatocellular carcinoma. J Clin Invest. 2020 Sep 1;130(9):4679–4693. doi:10.1172/jci135048.