
ABSTRACT
Although all murine MDSCs are defined as Gr1+CD11b+, their true immunophenotype remains elusive. In this study, we found murine Gr1+CD11b+ cells can be divided into two subsets: Gr1+CD11b+B220− and Gr1+CD11b+B220+, especially in the spleen tissues. Unlike the dominant B220− subset, the B220+ subpopulation was not induced by tumor in vivo. Moreover, Gr1+CD11b+B220+ cells from tumor-bearing mice spleens were unable to induce arginase 1 and inducible nitric oxide synthase expression, inhibit T cell proliferation, or promote tumor growth in primary tumor site. Nevertheless, these cells suppressed tumor metastasis in vivo and reduced cancer cell motility in vitro, while Gr1+CD11b+B220− cells from tumor-bearing mice spleens promoted tumor metastasis and enhanced cancer cell motility. Furthermore, both the polymorphonuclear (PMN-MDSCs) and monocytic MDSCs (Mo-MDSCs) could be further divided into B220− and B220+ subsets; interestingly, tumor only induced the expansion of B220− PMN-MDSCs and B220− Mo-MDSCs, but not the B220+ counterparts. Compared with B220− PMN-MDSCs and B220− Mo-MDSCs, the Ly6G+Ly6C−CD11b+B220+ and Ly6G−Ly6C+CD11b+B220+ cells from tumor-bearing mice spleens exhibited a more mature phenotype without immunosuppressive activity. Additionally, IL-6 deficiency attenuated the tumor-induced accumulation of MDSCs, B220− MDSCs and B220− PMN-MDSCs but increased the percentages of Gr1+CD11b+B220+, Ly6G+Ly6C−CD11b+B220+, and Ly6G−Ly6C+CD11b+B220+ cells, indicating the opposing roles of the IL-6 signaling pathway in the expansion of B220− MDSCs and their B220+ counterparts. Taken together, our findings indicate that the B220+ subset is a distinct subset of Gr1+CD11b+ cells functionally different from the B220− subpopulation during tumorigenesis and induction of MDSCs to B220+ cells may be helpful for cancer therapy.
KEYWORDS:
1. Introduction
As a heterozygous group of immature cells derived from myeloid progenitors and precursors, myeloid-derived suppressor cells (MDSCs) have gained increased attention for their critical role in immunosuppression during tumorigenesis and inflammation.Citation1 It has been reported that MDSCs exert their tumor-promoting effects mainly by elevating the expression of arginase 1 (Arg1) and inducible nitric oxide synthase (iNOS) to suppress the proliferation and activity of cytotoxic T lymphocytes (CTLs),Citation2,Citation3 inhibit the function of macrophages (Mφs),Citation4 dendritic cells (DCs)Citation5 and natural killer cells (NKs),Citation6 and induce the accumulation of regulatory B cells (Bregs)Citation7 and regulatory T cells (Tregs).Citation8 In humans, MDSCs can be divided into three main subpopulations: polymorphonuclear MDSCs (PMN-MDSCs; CD3−CD19−CD56−HLA-DR−CD33+CD11b+CD15+CD14−), monocytic MDSCs (Mo-MDSCs; CD3−CD19−CD56−HLA-DR−CD33+CD11b+CD15−CD14+), and early-stage MDSCs (e-MDSCs; CD3−CD19−CD56−HLA-DR−CD33+CD11b+CD15−CD14−).Citation9,Citation10 In mice, MDSCs co-express the surface antigens Gr1 and CD11b and can be divided into two main subpopulations: Ly6G+Ly6C−CD11b+ PMN-MDSCs and Ly6G−Ly6C+CD11b+ Mo-MDSCs.Citation11 The population of MDSCs is extremely heterozygous, and it is not yet clear whether the conventional interpretation of Gr1 (Ly6G/Ly6C) and CD11b expression is suitable for distinguishing MDSCs in mice.
The accumulation and expansion of MDSCs are tightly controlled by a combination of colony-stimulating factors, including GM-CSF, G-CSF, M-CSF, and SCF, and pro-inflammatory cytokines, such as IL-6, IL-1β, IL-18, TNFα, TGFβ, and PGE2.Citation12–14 Several studies have demonstrated that tumor-secreted IL-6 activates the JAK2-STAT3 signaling pathway and impairs myeloid cell maturation and myelopoiesis, which results in the expansion and activation of MDSCs in tumor-bearing hosts, including in breast cancer and drug-resistant hepatocellular cancer models.Citation14–17 In addition, blockade of the IL-6 signaling pathway via an anti-IL-6 neutralizing antibody reduced the accumulation and immunosuppressive activity of MDSCs.Citation18 Moreover, a high level of IL-6 is associated with increased production of reactive oxygen species (ROS) and enhanced activity of Arg1 in MDSCs.Citation19 However, the effect of IL-6 on the differentiation of different MDSC subtypes remains poorly characterized.
Several animal experiments and pre-clinical studies suggest that targeting MDSCs and their subpopulations alone or in combination with other therapies may help overcome the suppressive nature of the tumor microenvironment and improve the efficiency of immunotherapeutic interventions. In mouse models, strategies aimed at eliminating MDSCs has been generally accomplished by the use of antibodies that target the surface markers Gr1 or CD11b (Ly6G/Ly6C).Citation20–26 In addition, induction of differentiation and apoptosis of MDSCs is also effective in suppressing tumor growth in different murine tumor models.Citation27–29 However, further investigations into their different phenotypes and functions are urgently needed before targeting these populations for clinical therapy since MDSCs are extremely heterogeneous. In this study, we explored the precise classification of murine MDSCs and their potential functions in tumorigenesis. Our findings not only reveal the high heterogeneity of MDSCs, but also inform us of their different effects on tumor growth and development. Application of this novel identification system may improve understanding of MDSC activity and allow the development of more precise immunotherapeutic methods for cancer treatment.
2. Materials and methods
2.1. Cell culture
Murine melanoma B16 cells, breast cancer 4T1 cells, and colon carcinoma CT-26 cells were purchased from the American Type Culture Collection (ATCC; Manassas, VA). B16 cells were maintained in Dulbecco’s modified Eagle’s medium (DMEM; Thermo Fisher Scientific, Waltham, MA). 4T1 and CT-26 cells were cultured in RPMI 1640 medium (Thermo Fisher Scientific). All culture media were supplemented with 10% (v/v) fetal bovine serum (FBS; HyClone, Logan, UT), 100 U/ml of penicillin (Beyotime, Shanghai, China), and 100 µg/ml of streptomycin (Beyotime) in a humid incubator at 37°C with 5% CO2.
2.2. In vivo mouse model
C57BL/6 and BALB/c mice (female; 6–8 weeks old) were purchased from Charles River Ltd. (Beijing, China) and maintained in a specific pathogen-free and controlled environment. IL-6-deficient (IL-6−/−; B6.129S6-Il6[tm1Kopf]) mice were obtained from the Model Animal Research Center of Nanjing University (Nanjing, Jiangsu, China). The B16, 4T1, and CT-26 subcutaneous tumor models were established as previously described.Citation10 Briefly, six mice (6–8 weeks old) were subcutaneously injected with 5 × 10⁶ B16 cells, 4T1 cells, or CT-26 cells and maintained for 18 (B16), or 24 days (4T1 and CT-26). The mice were then euthanized, and the femur and spleen tissues were isolated. Subsequently, Gr1+CD11b+B220−, Gr1+CD11b+B220+, Ly6G+Ly6C−CD11b+B220−, Ly6G+Ly6C−CD11b+B220+, Ly6G−LyC+CD11b+B220−, and Ly6G−Ly6C+CD11b+B220+ cell populations were purified for the indicated studies. To investigate the effects of Gr1+CD11b+B220− and Gr1+CD11b+B220+ cells on tumor growth, these cell populations were purified from the spleen tissues of tumor-free, B16, or 4T1 tumor-bearing mice and injected into the new tumors of B16 or 4T1 bearing mice (6–8 weeks old) on days 1, 3, 6, 9, and 12 (B16) or on days 1, 5, 10, and 15 (4T1) (2 × 10⁶ cells/mouse) after palpable tumors were formed. The tumor volume was measured in two dimensions by calipers on the indicated days after palpable tumors were formed and calculated by the following formula: (0.5 × length × width2). After 18 days (B16) or 24 days (4T1), the mice were euthanized and tumors were harvested immediately. For the tumor metastasis models, cell suspensions containing 100 µl of B16 or 4T1 cells (1 × 10⁶ cells/mouse) were intravenously inoculated into the tail vein of 12-week-old mice. Then, the Gr1+CD11b+B220− and Gr1+CD11b+B220+ cells purified from the spleen tissues of tumor-free, B16, or 4T1 tumor-bearing mice were injected into the tail vein of mice intravenously inoculated with B16 or 4T1 cells on days 5, 10, 15, and 20 (5 × 10⁵ cells/mouse). The animals were euthanized on day 24 and the lungs and livers were collected for morphometric examination. The animal experiments were approved by the Ethics Committee of Nankai University and Tianjin International Joint Academy of Biomedicine.
2.3. Flow cytometry
The immunocytes isolated from the bone marrow (BM), spleen, and tumor tissues were subjected to flow cytometry analysis following the previously described protocol.Citation10 Briefly, 1 × 10⁶ cells were blocked with 1 × phosphate buffered saline (PBS) with 1% FBS at 4°C for 30 min and then stained with 5 μl of indicated fluorochrome-conjugated antibody for a further 30 min at 4°C. Flow cytometry was performed on a BD FACSCalibur flow cytometer (BD Biosciences, San Jose, CA) and the results were analyzed with FlowJo software (version 10.6; Tree Star, Ashland, OR). The antibodies used for flow cytometry were as follows: FITC anti-mouse Gr-1 (Biolegend, San Diego, CA; cat. no. 108405), PE or APC anti-mouse/human CD11b (Biolegend; cat. no. 101207 or 101211), PE or PE-Cy5 anti-mouse/human CD45R/B220 (Biolegend or BD Biosciences, San Jose, CA; cat. no. 103207 or 553091), APC anti-mouse CD3 (Biolegend; cat. no. 100235), PE or PerCP anti-mouse CD19 (Biolegend; cat. no. 152407 or 115531), PerCP/Cyanine5.5 anti-mouse IgM (Biolegend; cat. no. 406511), PerCP anti-mouse IgD (Biolegend; cat. no. 405735), FITC or Brilliant Violet 510 anti-mouse CD45 (Biolegend; cat. no. 103107 or 109837), APC or PE anti-mouse CD4 (Biolegend; cat. no. 100411 or 100407), PE anti-mouse CD8a (Biolegend; cat. no. 100707), PE anti-mouse Ly6G (Biolegend; cat. no. 127607), FITC anti-mouse Ly6C (Biolegend; cat. no. 128005), PerCP/Cyanine5.5 anti-mouse CD80 (Biolegend; cat. no. 104721), PerCP anti-mouse CD86 (Biolegend; cat. no. 105025), PerCP anti-mouse F4/80 (Biolegend; cat. no. 123125), and PerCP/Cyanine5.5 anti-mouse PD-L1 (Biolegend; cat. no. 124333). The corresponding fluorochrome-conjugated isotype controls were also purchased from Biolegend. The dilution ratio of antibodies for flow cytometry was 1:100.
2.4. Western blot analysis
Western blot was performed as previously described.Citation30 The antibodies and dilution ratios were as follows: Rabbit anti-Arg1 (Cell Signaling Technology [CST] Danvers, MA; cat. no. 93668), rabbit anti-iNOS (CST; cat. no. 13120), mouse anti-Stat3 (CST; cat. no. 9139), rabbit anti-phospho-Stat3 (Tyr705) (CST; cat. no. 9145), mouse anti-E-cadherin (CST; cat. no. 14472), rabbit anti-N-cadherin (CST; cat. no. 13116), rabbit anti-Vimentin (CST; cat. no. 5741), rabbit anti-Cebpβ (Abcam; cat. no. ab32358), rabbit anti-ERK1/2 (CST; cat. no. 9102), rabbit anti-p-ERK1/2 (Thr202/Tyr204) (CST; cat. no. 9101), rabbit anti-S100A8 (CST; cat. no. 47310), rabbit anti-S100A9 (CST; cat. no. 73425), rabbit anti-IRF8 (CST; cat. no. 5628), and mouse anti-β-actin (Abcam, Cambridge, MA; cat. no. ab6276). All antibodies were used at a 1:1000 dilution, with the exception of mouse anti-β-actin, which was used at 1:5000.
2.5. Cell sorting
As previously described,Citation10 high-purity of Gr1+CD11b+B220−, Gr1+CD11b+B220+, Ly6G+Ly6C−CD11b+, Ly6G−Ly6C+CD11b+, Ly6G+Ly6C−CD11b+B220−, Ly6G+Ly6C−CD11b+B220+, Ly6G−Ly6C+CD11b+B220−, and Ly6G−Ly6C+CD11b+B220+ cells were sorted from the spleen tissues of tumor-free, B16, or 4T1 bearing mice using the indicated fluorochrome-conjugated antibodies and the BD FACSAria flow cytometer (BD Biosciences).
2.6. Carboxyfluorescein succinimidyl ester (CFSE) assay
For the T cell proliferation assay, CD4+ T and CD8+ T cells were sorted from the spleen tissues of healthy C57BL/6 mice by flow cytometry, and incubated with 5 μM of carboxyfluorescein succinimidyl ester (CFSE; Sigma-Aldrich, St. Louis, MO) for 5 min at 37°C. The excess dye was washed away with 50 ml of RPMI-1640 containing 10% FBS (three washes). CFSE-labeled cells were then co-cultured with Gr1+CD11b+B220−, Gr1+CD11b+B220+, Ly6G+Ly6C−CD11b+B220−, Ly6G+Ly6C−CD11b+B220+, Ly6G−Ly6C+CD11b+B220−, or Ly6G−Ly6C+CD11b+B220+ cells, which were sorted from the spleen tissues of B16 bearing mice, at a ratio of 4:1 in DMEM medium with 5% FBS (Hyclone). The culture plates were precoated with anti-CD3 (8 μg/ml; Biolegend, cat. no. 100201) and CD28 (10 μg/ml; Biolegend, cat. no. 102101) monoclonal antibodies (mAbs) for 3 days. After co-culture for 3 days, the proliferation rate was determined by flow cytometry.
2.7. Detection of ROS
The ROS content was detected using a general oxidative stress indicator (CM-H2DCFDA; Thermo Fisher) followed by flow cytometric analysis as previously described.Citation31 Briefly, sorted cells were incubated with 4 μM of CM-H2DCFDA for 30 min at 37°C. After washing three times with 1 × PBS, the cells were detected by flow cytometry. The Gr1+CD11b+ cells isolated from healthy C57BL/6 mice were used as the negative control (NC) population.
2.8. Detection of arginase activity
Arginase activity was determined using an Arginase Activity Assay Kit (Sigma-Aldrich) according to the manufacturer’s protocol.
2.9. Wright staining
Sorted cells were spread on positively charged glass slides and air-dried at room temperature before staining with 500 μl of Wright staining solution for 3 min, followed by addition of 500 μl of distilled water for 15 min. The stained slides were then rinsed with distilled water and air-dried. All images were acquired on an Eclipse Ni microscope (Nikon, Tokyo, Japan) operated under the NIS Element software.
2.10. Wound healing assay
B16 and 4T1 cells (lower layer) were co-cultured with different sorted MDSC subtypes (upper layer) using a 24-transwell system (pore size: 0.4 μm; Corning Costar, Corning, NY) at a ratio of 4:1 for 48 h. When the confluency of the tumor cells reached 95%, wounds were scratched using 20 μl plastic pipette tips. After the cells had been cultured for 0 or 36 h, each well was washed three times with fresh medium to remove floating cells. Six random fields along the original scratch line were photographed and the wound healing rate was measured using ImageJ software.
2.11. Migration assay
Cell migration was determined using a 24-tranwell system (pore size: 8 μm; Corning Costar). Briefly, 2 × 10⁵ tumor cells (on the bottom of the 24-well dish) were co-cultured with different sorted Gr1+CD11b+ cell subtypes (5 × 10⁴/well; on the upper layer of a transwell insert) for 48 h. The tumor cells were then resuspended in serum-free culture medium and plated onto the upper layer of one new insert (5 × 10⁴ cells/insert). Medium containing 10% FBS was added to the lower chamber. After 24 h, the inserts were fixed with 4% paraformaldehyde (Sangon, Shanghai, China) and stained with 0.1% crystal violet (Solarbio, Beijing, China). Non-migrated cells on the upper layer were removed with a cotton swab. The inserts were rinsed in distilled water three times, allowed to air dry, and photographed. The stained cells were then dissolved in 33% ice-cold acetic acid and the absorbances were assessed at 570 nm using a microplate reader (Molecular Devices, Sunnyvale, CA).
2.12. siRNA transfection
Small interfering RNA (siRNA) transfection was performed as previously described.Citation10 The sequences of siRNA oligonucleotides were as follows: NC siRNA, 5´-CCUACGCCACCAAUUUCGU-3´; Stat3 siRNA: 5´-CAACAUGUCAUUUGCUGAA-3´; Cebpβ siRNA: 5´-GACAAGCUGAGCGACGAGUA-3´.
2.13. Statistical analysis
All values are presented as the mean ± standard error of the mean (SEM). An unpaired Student’s t-test was used to analyze significant differences between the two groups. For multiple groups, significance was evaluated with a one-way ANOVA. P-values < .05 were considered to indicate statistical significance.
3. Results
3.1. Only the B220− subset of murine Gr1+CD11b+ cells is responsible for MDSC accumulation during tumorigenesis
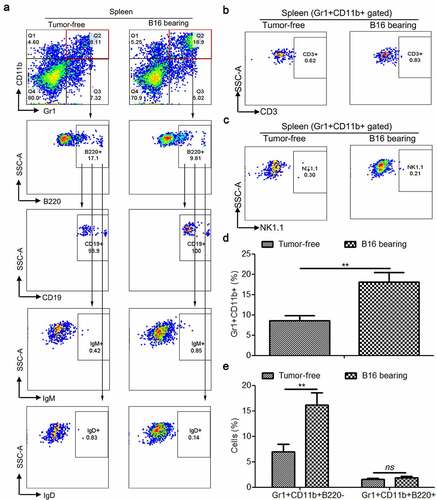
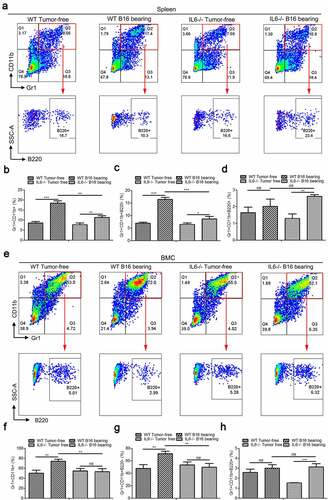
Initially, the main goal of this study was to determine the expression of surface markers of lymphoid cells (B, T, and NK lymphocytes) in murine Gr1+CD11b+ MDSCs. We first detected the expression of B220 (B cells), CD3 (T cells), and NK1.1 (NK cells) in murine spleen- and BM-derived Gr1+CD11b+ cells. Interestingly, the results showed that several Gr1+CD11b+ cells were B220 positive (, Supplemental Fig. 1A–B, 2A, 2C, 2E, and 2G), especially in the spleen, suggesting that the Gr1+CD11b+ cells could be divided into two discrete subpopulations: Gr1+CD11b+B220− and Gr1+CD11b+B220+. Our data also revealed that the Gr1+CD11b+ cells in the spleen and BM were negatively stained for CD3 ( and Supplemental Fig. 1C) and NK1.1 ( and Supplemental Fig. 1D). Next, we further characterized the Gr1+CD11b+B220+ cells in the murine spleen and found that these cells were CD19+IgM−IgD− (), which resemble the phenotype of pro/pre-B cells. Collectively, these data indicate that Gr1+CD11b+B220+CD19+IgM−IgD− cells constitute a novel subset of Gr1+CD11b+ cells. We next established three in vivo MDSC induction models by subcutaneously injecting B16 melanoma cells, 4T1 breast cancer cells, or CT-26 colon carcinoma cells into C57BL/6 (B16) or BALB/c (4T1 and CT-26) mice for 18 days (B16) or 24 days (4T1 and CT-26) and compared the proportions of Gr1+CD11b+B220− and Gr1+CD11b+B220+ cells in the spleen and BM between tumor-bearing mice and healthy controls. We observed that the percentages of both the total Gr1+CD11b+ cells and the Gr1+CD11b+B220− subset were increased in tumor-bearing mice compared with the healthy control (, , Supplemental Fig. 1E–F, 2B, 2D, 2F and 2H). However, the proportion of Gr1+CD11b+B220+ cells was not elevated (, Supplemental Fig. 1G, 2B, 2D, 2F and 2H), suggesting that the accumulation of Gr1+CD11b+ cells during tumor development is only attributed to the expansion of the B220− subset, but not of the B220+ subset. We also analyzed the proportion of Gr1+CD11b+B220+ in total B220+ cells in tumor-free mice spleens and BM. We found that the Gr1+CD11b+B220+ cells only accounted for a small portion in B220+ cells in spleen (3.39%; Supplemental Fig. 3) and BM (12.9%; Supplemental Fig. 3).
Figure 1. Tumorigenesis induces the accumulation of splenic Gr1+CD11b+ and Gr1+CD11b+B220− cells, but not Gr1+CD11b+B220+ cells in B16 bearing mice. (a) Representative plots depicting the Gr1+CD11b+ cells, as well as Gr1+CD11b+B220− and Gr1+CD11b+B220+ subpopulations in the spleens of B16 bearing mice and healthy controls. The Gr1+CD11b+B220+ subset was further analyzed for CD19, IgM, and IgD expression. For each group, samples from 6 mice were mixed for evaluation. (b and c) Flow cytometry to detect the expression of CD3 (b) and NK1.1 (c) in splenic Gr1+CD11b+ cells derived from tumor-free and B16 bearing mice. (d and e) Comparison of the proportions of splenic Gr1+CD11b+ (d), Gr1+CD11b+B220−, (e) and Gr1+CD11b+B220+ (e) cells between healthy controls and B16 bearing mice (n = 3). All data presented in bar graphs are shown as mean ± SEM. ns, not significant; **p < .01
3.2. Splenic Gr1+CD11b+B220+ cells obtained from tumor-bearing mice do not possess immunosuppressive function in vitro
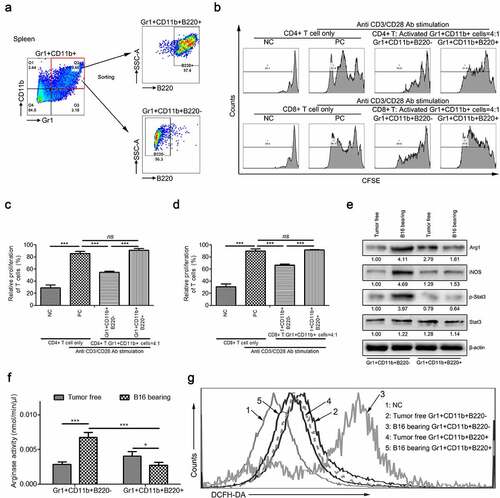
To determine the biological functions of these two subsets in Gr1+CD11b+ cells, we performed an in vitro CFSE-based proliferation study on CD4+ and CD8+ splenic T cells, which were stimulated with CD3 and CD28 monoantibodies (mAbs) and co-cultured with purified Gr1+CD11b+B220− or Gr1+CD11b+B220+ cells (). The data revealed that the proliferation of CD4+ and CD8+ T cells was significantly suppressed by B16 tumor-activated Gr1+CD11b+B220− cells, but not by Gr1+CD11b+B220+ cells isolated from the spleen of B16 bearing mice (–). Consistently, unlike Gr1+CD11b+B220− cells, tumorigenesis could not induce the expression of Arg1 and iNOS (), the phosphorylation of Stat3 (Tyr705) (), the activity of arginase (), or the production of ROS () in Gr1+CD11b+B220+ cells.
Figure 2. Only the B220− subset of MDSCs have immunosuppressive function in MDSCs during tumorigenesis in vitro. (a) Gating strategy for FACS sorting of Gr1+CD11b+B220+ and Gr1+CD11b+B220− subpopulations from the spleen tissues. (b–d) Representative images (b) and results of statistical analysis (c and d, n = 3) showing the proliferation rate of CFSE-labeled splenic CD4+ and CD8+ T cells co-cultured with Gr1+CD11b+B220− and Gr1+CD11b+B220+ cells from B16 tumor-bearing mice spleens in the presence of anti-CD3/CD28 stimulation. (e–g) The expression of Arg1, iNOS, Stat3, and p-Stat3 (e), arginase activities (f) and intracellular ROS levels (g) in Gr1+CD11b+B220− and Gr1+CD11b+B220+ cells from tumor-free or B16 tumor-bearing mice spleens. Ratios of protein band intensities (protein/β-actin), with the control sample’s normalized to 1, are shown under bands in western blot analysis. All data are shown as mean ± SEM. ns, not significant; *p < .05; **p < .01; ***p < .001
3.3. Intratumoral injection of Gr1+CD11b+B220+ cells from tumor-bearing mice spleens do not affect tumor growth but suppress lung and liver metastasis in vivo
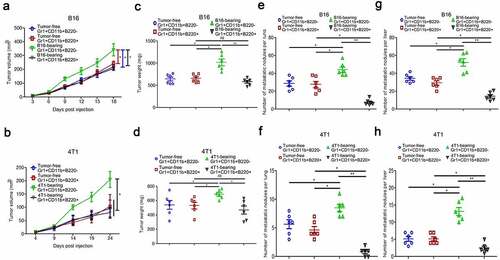
To determine whether Gr1+CD11b+B220− or Gr1+CD11b+B220+ cells obtained from tumor-bearing mice spleens can affect the development of B16 or 4T1 tumors in vivo, tumor models were established along with intratumoral injection of Gr1+CD11b+B220− or Gr1+CD11b+B220+ cells from tumor-free or tumor-bearing mice spleens. As shown in (B16), (B16), (4T1) and (4T1), intratumoral injection of Gr1+CD11b+B220− cells from tumor-bearing mice spleens significantly promoted tumor growth compared with that injection of Gr1+CD11b+B220− cells from tumor-free mice spleens. In contrast, intratumoral injection of Gr1+CD11b+B220+ cells from tumor-bearing mice spleens didn’t affect tumor growth compared with that injection of Gr1+CD11b+B220+ cells from tumor-free mice spleens. ( and : B16; and : 4T1). In addition, tumor cells were injected into the tail veins of mice, and 5 days later, the mice were divided into four groups (n = 6 mice per group) and the following cells were injected into the tail veins: Gr1+CD11b+B220− from tumor-free mice spleens, Gr1+CD11b+B220+ from tumor-free mice spleens, Gr1+CD11b+B220− from tumor-bearing mice spleens, and Gr1+CD11b+B220+ from tumor-bearing mice spleens (5 × 10⁵ cells/mouse). Injections were repeated on days 10, 15, and 20, and all mice were euthanized on day 24. To detect the incidence of tumor metastasis, we collected the lung and liver from each group and calculated the number of metastatic nodules. In mice injected with Gr1+CD11b+B220− or Gr1+CD11b+B220+ cells from tumor-free mice spleens, numerous metastatic colonies were detected in the lung and liver after tumor cell injection ( and : B16; and : 4T1), and their numbers were significantly increased in mice injected with Gr1+CD11b+B220− cells from tumor-bearing mice spleens ( and : B16; and : 4T1). Nevertheless, injection of Gr1+CD11b+B220+ cells from tumor-bearing mice spleens obviously reduced the metastatic nodules in the lung and liver ( and : B16; and : 4T1). These observations clearly indicate that the B220− and B220+ subsets of Gr1+CD11b+ cells from tumor-bearing mice spleens play opposing roles in tumor metastasis.
Figure 3. Gr1+CD11b+B220+ cells from tumor-bearing mice spleens show no effect on B16 and 4T1 tumor growth, but suppress distant metastasis of B16 and 4T1 tumors (a–d). Tumor growth curve (a: B16; b: 4T1) and tumor weight (c: B16; d: 4T1) of mice bearing B16 or 4T1 tumors (n = 6 per group) intratumorally injected with Gr1+CD11b+B220− or Gr1+CD11b+B220+ cells from tumor-free or tumor-bearing mice spleens. (e-h) B16 or 4T1 cells (1 × 10⁶) were intravenously injected into healthy mice for 24 days, accompanied by intravenous injection of Gr1+CD11b+B220− or Gr1+CD11b+B220+ cells (5 × 10⁵) from tumor-free or tumor-bearing mice spleens at day 5, 10, 15 and 20, respectively. Quantitative analyses of metastasized colonies in the lungs (n = 6) are shown in e (B16) and f (4T1). Quantitative analyses of metastasized colonies in the livers (n = 6) are shown in g (B16) and h (4T1). All data are shown as mean ± SEM. ns, not significant; *p < .05; **p < .01
3.4. Gr1+CD11b+B220− cells from tumor-bearing mice spleens promote cancer cell migration, while their B220+ counterparts suppress cell migration via cell-to-cell communication
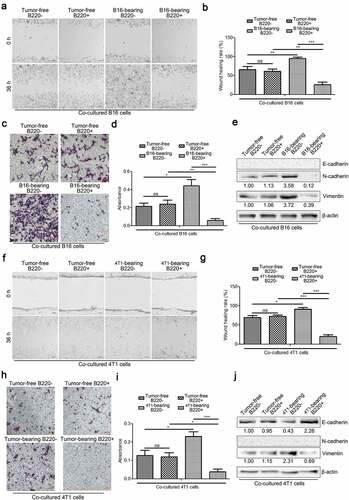
To investigate the underlying mechanisms by which Gr1+CD11b+B220− and Gr1+CD11b+B220+ cells from tumor-bearing mice spleens affect metastasis, we co-cultured B16 and 4T1 cells with Gr1+CD11b+B220− or Gr1+CD11b+B220+ cells from tumor-free or tumor-bearing mice spleens and assessed their motility using wound healing and transwell assays. As shown in – (B16) and – (4T1), co-culture with Gr1+CD11b+B220− cells from tumor-bearing mice spleens accelerated the wound healing process and enhanced the migration ability of B16 (–) and 4T1 (–) cells. However, the tumor cells co-cultured with Gr1+CD11b+B220+ cells from tumor-bearing mice spleens showed decreased cell motility (–: B16; –: 4T1). It is known that EMT is a process in which epithelial cells lose their polarized morphology and acquire mesenchymal features.Citation32 In cancer, EMT is associated with cell invasion and dissemination to distant organs.Citation32 In the current study, the tumor cells were co-cultured with Gr1+CD11b+B220− cells from tumor-bearing mice spleens for 48 h, following which, the expression levels of EMT markers were significantly altered, including a dramatic upregulation of the mesenchymal markers N-cadherin and Vimentin, and downregulation of the epithelial marker E-cadherin (: B16; : 4T1). In contrast, in tumor cells co-cultured with Gr1+CD11b+B220+ cells from tumor-bearing mice spleens, the expression levels of N-cadherin and Vimentin were downregulated, while the expression of E-cadherin was upregulated (: B16; : 4T1) (E-cadherin was not detectable in B16 cells, and N-Cadherin was not detectable in 4T1 cells). These data indicate that Gr1+CD11b+B220− and Gr1+CD11b+B220+ cells from tumor-bearing mice spleens play opposing roles in tumor cell EMT and motility.
Figure 4. Gr1+CD11b+B220− and Gr1+CD11b+B220+ cells from tumor-bearing mice spleens play opposing roles in affecting cancer cell EMT and motility directly. (a–b and f–g) Wound healing assay was used to evaluate the motility of B16 or 4T1 cells co-cultured with Gr1+CD11b+B220− or Gr1+CD11b+B220+ cells from tumor-free or tumor-bearing mice spleens. The migratory distance was measured by ImageJ and compared 36 h later. a (B16) and f (4T1): representative images; b (B16) and g (4T1): quantification analysis (n = 3). (c–d and h–i) Representative pictures (c: B16; h: 4T1) and quantification analysis (d: B16; i: 4T1) to show the results of transwell migration assay in B16 or 4T1 cells co-cultured with Gr1+CD11b+B220− or Gr1+CD11b+B220+ cells from tumor-free or tumor-bearing mice spleens (n = 3). Scale bars: 100 μm. (e and j) Western blot analysis of E-cadherin, N-cadherin and Vimentin protein expression in B16 (e) or 4T1 (j) cells co-cultured with Gr1+CD11b+B220− or Gr1+CD11b+B220+ cells from tumor-free or tumor-bearing mice spleens. Ratios of protein band intensities (protein/β-actin), with the control sample’s normalized to 1, are shown under bands in western blot analysis. All data presented in bar graphs are shown as mean ± SEM. ns: Not significant; *p < .05; **p < .01; ***p < .001
3.5. IL-6 deficiency suppresses the expansion of Gr1+CD11b+B220− cells but elevates the proportion of Gr1+CD11b+B220+ cells during tumorigenesis
Our previous studies have demonstrated that IL-6 deficiency suppresses tumor growth via impairing the accumulation of MDSCs in mice.Citation33 In the present study, we further evaluated the effect of IL-6 on the accumulation of Gr1+CD11b+B220− and Gr1+CD11b+B220+ cells in vivo. The results showed that loss of IL-6 impaired tumor-induced expansion of both Gr1+CD11b+ and Gr1+CD11b+B220− cells in the spleens (–) and BM (–). Interestingly, far from suppressing the proportion of Gr1+CD11b+B220+ cells, IL-6 deficiency promoted the accumulation of this subset in both the spleens () and the BM (). As the Gr1+CD11b+B220+ subset co-expresses CD19, we also determined the proportions of CD19− and CD19+ subsets in spleen- and BM-derived Gr1+CD11b+ cells from wild type and IL-6−/− mice with/without B16 tumor injection. Similar observations were found where knockout of IL-6 suppressed tumor-induced Gr1+CD11b+CD19− cells but increased the proportion of Gr1+CD11b+CD19+ cells in both the spleens and BM of B16 bearing mice (Supplemental Figure 4a–f).
Figure 5. IL-6 deficiency impairs the accumulation of spleen- and BM-derived MDSCs by suppressing the expansion of Gr1+CD11b+B220− cells in B16 bearing mice. (a) Representative images showing the changes in the proportion of splenic Gr1+CD11b+ cells and their B220 subtypes in wild type and IL-6−/− mice with/without B16 injection. For each group, samples from 6 mice were mixed for evaluation. (b–d) The average percentages of splenic Gr1+CD11b+ (b), Gr1+CD11b+B220− (c), and Gr1+CD11b+B220+ (d) cells in samples described in a (n = 3). (e) Representative images showing the changes in the proportion of BM Gr1+CD11b+ cells and their B220 subtypes in B16 bearing wild type and IL-6−/− mice compared to healthy controls. For each group, samples from 6 mice were mixed for evaluation. (f–h) The average percentages of BM Gr1+CD11b+ (f), Gr1+CD11b+B220− (g), and Gr1+CD11b+B220+ (h) cells in samples described in e (n = 3). All data presented in bar graphs are shown as mean ± SEM. ns, not significant; *p < .05; **p < .01; ***p < .001
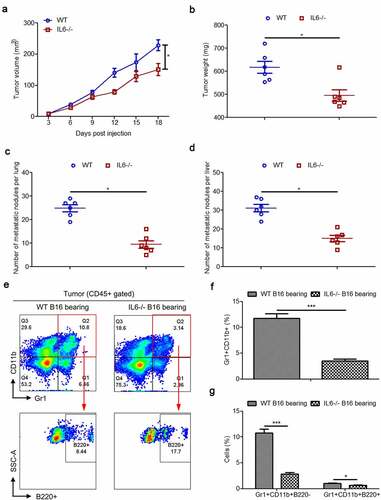
Similar to the results of previous studies,Citation33 the B16 tumor in IL-6−/− mice grew obviously slower than that in wild type mice (–). In comparison to wild type mice, we also observed decreased metastasis of B16 tumors in the lungs and livers of IL-6−/− mice that were intravenously injected with cancer cells (–). These data suggest that systemic knockout of IL-6 represses the growth and metastasis of B16 tumors. Next, we measured intratumoral Gr1+CD11b+ cells and Gr1+CD11b+B220− and Gr1+CD11b+B220+ subtypes in B16 tumor models of wild type and IL-6−/− mice. Our results showed that the percentages of Gr1+CD1b+ cells were significantly decreased in the tumor tissues of IL-6−/− mice compared to normal controls. Moreover, the proportion of the B220+ subset was increased in Gr1+CD11b+ cells in the tumors of IL6−/− mice, resulting in a greater decrease in the proportion of Gr1+CD11b+B220− cells than Gr1+CD11b+B220+ cells (–).
Figure 6. Intratumoral Gr1+CD11b+ cells and their B220−/B220+ subtypes in B16 tumor models of wild type and IL-6−/− mice. (a) Six wild type and IL-6−/− mice were subcutaneously injected with 5 × 10⁶ B16 cells, respectively. Growth kinetics of B16 tumors in wild type and IL-6−/− mice. (b) The average weight of tumors from each experimental group is presented. (c–d) Quantitative analysis of B16 melanoma colonies in the lungs (c) and livers (d) of wild type and IL-6−/− mice. (e) Representative FACS plots for frequency of intratumoral Gr1+CD11b+ cells and their B220 subtypes in B16 bearing wild type and IL-6−/− mice, gated on CD45+ cells. For each group, samples from 6 mice were mixed for evaluation. (f and g) Percentages of intratumoral Gr1+CD11b+ (f), Gr1+CD11b+B220− (g), and Gr1+CD11b+B220+ (g) cells in samples described in a (n = 3). All data presented in bar graphs are shown as mean ± SEM. ns, not significant; *p < .05; ***p < .001
3.6. Both PMN-MDSCs and Mo-MDSCs can be divided into B220− and B220+ subsets, and tumorigenesis only induced the expansion of the B220− populations
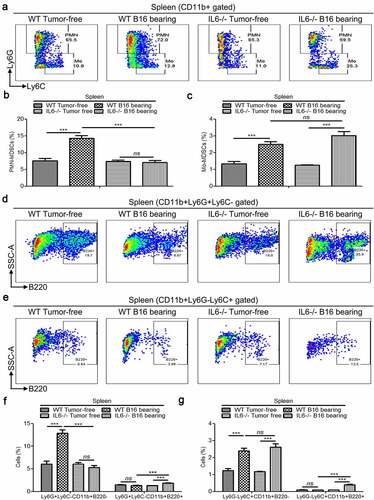
In mice, MDSCs can be separated into PMN-MDSCs and Mo-MDSCs.Citation34 Therefore, we further examined the expression of B220 in PMN-MDSCs and Mo-MDSCs. Our results showed that the percentages of both PMN-MDSCs and Mo-MDSCs were increased in the spleen tissues of B16 bearing mice compared with healthy controls (–). In addition, both of these subtypes were partially positive for B220 ( and ). However, cancer cells were only able to induce the expansion of B220− PMN-MDSCs and B220− Mo-DMSCs, but not that of Ly6G+Ly6C−CD11b+B220+ and Ly6G−Ly6C+CD11b+B220+ cells in the spleen tissues of mice ( and ).
Figure 7. Splenic PMN-MDSCs, Mo-MDSCs and their B220−/B220+ subtypes in wild type and IL-6−/− mice with/without B16 injection. (a) Representative images showing the changes in the proportion of splenic PMN-MDSCs and Mo-MDSCs in wild type and IL-6−/− mice with/without B16 injection. For each group, samples from 6 mice were mixed for evaluation. (b–c) The average percentages of splenic PMN-MDSCs (b) and Mo-MDSCs (c) in samples described in a (n = 3). (d-e) Dot plots to present the B220−/B220+ subtypes of splenic PMN-MDSCs (d) and Mo-MDSCs (e) in the wild type and IL-6−/− mice with/without B16 injection. (f and g) Percentages of Ly6G+Ly6C−CD11b+B220− (f), Ly6G+Ly6C−CD11b+B220+ (f), Ly6G−Ly6C+CD11b+B220−- (g) and Ly6G−Ly6C+CD11b+B220+ (g) cells in samples described in d and e (n = 3). All data presented in bar graphs are shown as means ± SEM. ns, not significant; ***p < .001
3.7. IL-6−/− impairs splenic B220− PMN-MDSCs’ accumulation but increases the proportions of both Ly6G+Ly6C−CD11b+B220+ and Ly6G−Ly6C+CD11b+B220+ cells in tumor-bearing mice
We also determined the proportions of PMN-MDSCs, Mo-MDSCs, B220− PMN-MDSCs, B220− Mo-MDSCs, Ly6G+Ly6C−CD11b+B220+, and Ly6G−Ly6C+CD11b+B220+ cells in IL-6−/− mice with/without B16 tumor cell injection. Our results showed that IL-6 deficiency only attenuated tumor-induced expansion of PMN-MDSCs, but not that of Mo-MDSCs (–). In addition, systemic knockout of IL-6 impaired B16 tumor-induced accumulation of B220− PMN-MDSCs but elevated the proportions of both Ly6G+Ly6C−CD11b+B220+ and Ly6G−Ly6C+CD11b+B220+ cells in the spleen tissues of B16 bearing mice (–).
3.8. B220− PMN-MDSCs, B220− Mo-MDSCs, and their B220+ counterparts from tumor-bearing mice spleens play different roles in T cell proliferation and cancer cell migration
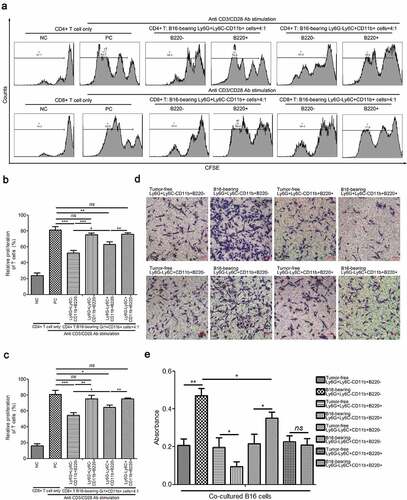
Next, the immunosuppressive activity of Ly6G+Ly6C−CD11b+B220−, Ly6G+Ly6C−CD11b+B220+, Ly6G−Ly6C+CD11b+B220−, and Ly6G−Ly6C+CD11b+B220+ cells from B16 tumor-bearing mice spleens was evaluated. The results of the CFSE-based proliferation assay demonstrated that both the Ly6G+Ly6C−CD11b+B220− and Ly6G−Ly6C+CD11b+B220− cells from tumor-bearing mice spleens significantly suppressed the proliferation of CD4+ and CD8+ T cells, and that Ly6G+Ly6C−CD11b+B220− exhibited a more potent suppressive capacity (–). Co-culture with Ly6G+Ly6C−CD11b+B220+ and Ly6G−Ly6C+CD11b+B220+ cells from tumor-bearing mice spleens showed no clear effect on T cell proliferation compared with CD4+ and CD8+ T cells stimulated with CD3/CD28 monoclonal antibodies alone (–). In addition, B16 cells co-cultured with Ly6G+Ly6C−CD11b+B220− as well as Ly6G−Ly6C+CD11b+B220− cells from tumor-bearing mice spleens showed greater migratory capacity compared with B16 cells co-cultured with their counterparts from tumor-free mice spleens ( and ). However, Ly6G+Ly6C−CD11b+B220+ cells from tumor-bearing mice spleens suppressed the migration of B16 cells, while Ly6G−Ly6C+CD11b+B220+ cells from tumor-bearing mice spleens exhibited no obvious effect on the migration of B16 cells (-).
Figure 8. Determination of immunosuppressive activity of Ly6G+Ly6C−CD11b+B220−, Ly6G+Ly6C−CD11b+B220+, Ly6G−Ly6C+CD11b+B220−, and Ly6G−Ly6C+CD11b+B220+ cells from B16 tumor-bearing mice spleens. (a–c) Representative images (a) and statistical analysis results (b and c, n = 3) showing the proliferation rate of CFSE-labeled splenic CD4+ and CD8+ T cells co-cultured with Ly6G+Ly6C−CD11b+B220−, Ly6G+Ly6C−CD11b+B220+, Ly6G−Ly6C+CD11b+B220−, and Ly6G−Ly6C+CD11b+B220+ cells from B16 tumor-bearing mice spleens in the presence of anti-CD3/CD28 stimulation. These cells were sorted from the spleens of mice subcutaneously injected with 5 × 10⁶ B16 cells for 15 days. (d–e) Representative pictures (d) and quantification analysis (e) showing the results of the transwell migration assay in B16 cells co-cultured with Ly6G+Ly6C−CD11b+B220−, Ly6G+Ly6C−CD11b+B220+, Ly6G−Ly6C+CD11b+B220−, and Ly6G−Ly6C+CD11b+B220+ cells from B16 tumor-free or tumor-bearing mice spleens (n = 3). Scale bars: 100 μm. All data are shown as mean ± SEM. ns: Not significant. *p < .05; **p < .01; ***p < .001
3.9. Ly6G+Ly6C−CD11b+B220+ and Ly6G−Ly6C+CD11b+B220+ cells from tumor-bearing mice spleens showed a more mature phenotype compared with their B220− counterparts
To further investigate the immunoregulatory phenotype of Ly6G+Ly6C−CD11b+B220−, Ly6G+Ly6C−CD11b+B220+, Ly6G−Ly6C+CD11b+B220−, and Ly6G−Ly6C+CD11b+B220+ cells, the expression of CD80, CD86, F4/80, and PD-L1 was determined by flow cytometry. Ly6G+Ly6C−CD11b+B220+ cells from tumor-bearing mice spleens expressed higher levels of the costimulatory molecules CD80 and CD86, and lower levels of the inhibitory molecule PD-L1 compared with Ly6G+Ly6C−CD11b+B220− cells from tumor-bearing mice spleens. In addition, neither the Ly6G+Ly6C−CD11b+B220+ cells from tumor-bearing mice spleens, nor the Ly6G+Ly6C−CD11b+B220− cells from tumor-bearing mice spleens expressed F4/80 (-). Moreover, although the expression levels of CD80, CD86, and F4/80 in Ly6G−Ly6C+CD11b+B220− cells from tumor-bearing mice spleens were similar to those of Ly6G−Ly6C+CD11b+B220+ cells from tumor-bearing mice spleens, the latter expressed a lower level of PD-L1 (-).
Figure 9. Characterization of B220+/B220− subsets of Ly6G+Ly6C−CD11b+ and Ly6G−Ly6C+CD11b+ cells. (a-b) The expression of CD80, CD86, F4/80, and PD-L1 in Ly6G+Ly6C−CD11b+B220−, Ly6G+Ly6C−CD11b+B220+, Ly6G−Ly6C+CD11b+B220−, and Ly6G−Ly6C+CD11b+B220+ cells from B16 tumor-bearing mice spleens, analyzed by flow cytometry. Representative flow cytometric results are shown in a. Percentage of CD80+, CD86+, F4/80+ and PD-L1+ cells are shown in B. (c) Western blot analysis of p-Stat3, total-Stat3, Cebpβ, p-ERK, ERK, S100A8, S100A9, and IRF8 inLy6G+Ly6C−CD11b+B220−, Ly6G+Ly6C−CD11b+B220+, Ly6G−Ly6C+CD11b+B220−, and Ly6G−Ly6C+CD11b+B220+ cells from tumor-free and B16 tumor-bearing mice spleens. (d) Ly6G+Ly6C−CD11b+ and Ly6G−Ly6C+CD11b+ cells from tumor-free mice spleens were transfected with two distinct siRNAs targeting Stat3 and Cebpβ, respectively, and cultured with GM-CSF (40 ng/ml) and IL-6 (40 ng/ml) for 4 days. The protein levels of p-Stat3, Stat3, and Cebpβ were analyzed by western blot analysis. (e–g) Representative images (e) and statistical analysis results (f and g, n = 3) showing the B220−/B220+ distributions of Ly6G+Ly6C−CD11b+ and Ly6G−Ly6C+CD11b+ cells from tumor-free mice spleens cultured with GM-CSF (40 ng/ml) and IL-6 (40 ng/ml) for 4 days and transfected with control siRNA, Cebpβ siRNA, or Stat3 siRNA. Ratios of protein band intensities (protein/β-actin), with the control sample’s normalized to 1, are shown under bands in western blot analysis. All data are shown as mean ± SEM. ns: Not significant. **p < .01; ***p < .001
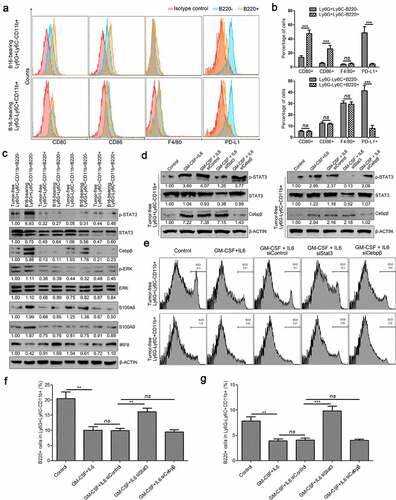
3.10. Silencing of Stat3 increased the percentage of B220+ cells in both Ly6G+Ly6C−CD11b+ and Ly6G−Ly6C+CD11b+ cell subsets
Finally, we examined the expression changes of MDSC-related transcription factors and critical proteins in Ly6G+Ly6C−CD11b+B220−, Ly6G+Ly6C−CD11b+B220+, Ly6G−Ly6C+CD11b+B220−, and Ly6G−Ly6C+CD11b+B220+ cells from tumor-free or tumor-bearing mice spleens. The results showed that tumorigenesis induced the expression of Cebpβ and p-Stat3, and suppressed the expression of IRF8 both in Ly6G+Ly6C−CD11b+B220− and Ly6G−Ly6C+CD11b+B220− cells, especially in Ly6G+Ly6C−CD11b+B220− cells, but did not influence the expression levels of these proteins in Ly6G+Ly6C−CD11b+B220+ and Ly6G−Ly6C+CD11b+B220+ cells (). To further elucidate the role of p-Stat3 and Cebpβ in the tumor-induced proliferation of these cells, Ly6G+Ly6C−CD11b+ and Ly6G−Ly6C+CD11b+ cells from tumor-free mice spleens were transfected with two distinct siRNAs targeting Stat3 and Cebpβ, respectively, and cultured with GM-CSF (40 ng/ml) and IL-6 (40 ng/ml) for 4 days. As expected, GM-CSF plus IL-6 treatment induced the expression of Cebpβ and the phosphorylation of Stat3 (). Transfection of Stat3 siRNA successfully suppressed the protein levels of total Stat3 and p-Stat3 (). Meanwhile, transfection of Cebpβ siRNA successfully reduced the protein level of Cebpβ both in Ly6G+Ly6C−CD11b+ and Ly6G−Ly6C+CD11b+ cells (). In addition, we found that GM-CSF plus IL-6 treatment successfully elevated the percentage of B220− cells and reduced the percentage of B220+ cells both in Ly6G+Ly6C−CD11b+ and Ly6G−Ly6C+CD11b+ cells, similar to that in tumor-bearing mice (–). Moreover, the influence of GM-CSF plus IL-6 on the distributions of B220+/B220− could be reversed by Stat3 knockdown in both Ly6G+Ly6C−CD11b+ and Ly6G−Ly6C+CD11b+ cells. These findings further imply a critical role of the IL-6/STAT3 signaling pathway in the distribution of B220−/B220+ subsets in Ly6G+Ly6C−CD11b+ and Ly6G−Ly6C+CD11b+ cells (–). In contrast, silencing of Cebpβ could not reverse the effect of GM-CSF plus IL-6 treatment on the distribution of B220−/B220+ subsets either in Ly6G+Ly6C−CD11b+ or Ly6G−Ly6C+CD11b+ cells (–).
4. Discussion
MDSCs have gained increased attention for their immunosuppressive function in cancer and for their roles in promoting tumor progression and metastasis. However, the plasticity and heterogeneity of MDSCs make them difficult to study experimentally and target therapeutically. The characterization and recognition of specific markers in human and murine MDSCs is an important but as yet poorly defined process. In this study, for the first time to the best of our knowledge, we reveal that a small proportion of murine Gr1+CD11b+ cells also express the B cell marker B220. Furthermore, our data show that these Gr1+CD11b+B220+ cells are positive for CD19 but negative for IgM and IgD, suggesting that these cells are originated from pro/pre-B cells. Our study highlights the developmental complexity of MDSCs and challenges the current concept of murine MDSCs. Importantly, our results show that B220+ myeloid cells are not classical functional MDSCs, which do not affect cancer cell growth but suppress tumor metastasis. Therefore, induction of MDSCs to B220+ cells may be helpful for clinical cancer therapy.
Accumulating studies have identified two classical subpopulations of tumor-associated MDSCs, PMN-MDSCs and Mo-MDSCs, based on the surface expression of Ly6G and Ly6C. The findings of the current study show that both PMN-MDSCs and Mo-MDSCs can be divided into B220− and B220+ subsets. Moreover, our data also demonstrate that only the B220− subsets are responsible for the immunosuppressive functions of PMN-MDSCs and Mo-MDSCs, respectively. Therefore, we conclude that it is important to inhibit the induction of pan-B220− MDSCs for the suppression of tumor growth. Furthermore, our findings demonstrate that IL-6−/− impairs the accumulation of PMN-MDSCs and B220− PMN-MDSCs, but not the Mo-MDSCs and B220− Mo-MDSCs. We speculate that the IL-6/STAT3 pathway plays a more important role in PMN-MDSCs than that in Mo-MDSCs. The hypothesis is supported by several studies in other labs.Citation35–37 For example, Abad et al. evaluated the impact of STAT3 deletion in myeloid cells in the population of MDSCs within medulloblastoma tumors in Smo* mice. They found that the relative abundance of CD11b+ cells among mononuclear cells was significantly reduced in tumors of STAT3 conditional knocked-out (cKO) mice compared with that of wild type mice. Importantly, the proportion of PMN-MDSCs was reduced profoundly in tumors from STAT3 cKO mice. Conversely, a significant increase was found in the proportion of Mo-MDSCs.Citation35 In Tet2−/− mice, Li et al. also found IL-6 only induces the expansion of PMN-MDSCs.Citation37
Several lines of evidence have indicated that a subset of pro-B cells may reorient into the myeloid lineage. For example, Audzevich et al. identified a B cell progenitor within the BM that differentiates into tissue Mφs in adult mice.Citation38 These Mφ precursors co-express the myeloid markers Gr1, CD11b, CD16/32, and the lymphoid lineage markers B220 and CD19.Citation38 By analyzing BM cells from normal and osteopetrotic mice by flow cytometry, Blin-Wakkach et al. found that the pro-B cells from the BM of these mice contain a novel bi-phenotypic population co-expressing B-lymphoid markers (B220, CD19, CD43, CD5) and myeloid lineage markers (CD11b, F4/80).Citation39 Early embryonic CSF1R+CD19+ pro-B cells in the embryonic fetal liver also express multiple other myeloid genes and possess residual myeloid as well as B cell potential.Citation40 It has been reported that Flt3 ligand induces the activation of some B cell-associated genes, including B220, CD24, CD43, and c-kit in progenitor cells predestined to macrophage differentiation.Citation41 Interestingly, Flt3 ligand also mediates STAT3-independent expansion but STAT3-dependent activation of MDSCs.Citation42
Modifications in the differentiation of the bipotent B-lymphoid/myeloid cells may be associated with various pathological conditions, including hematopoietic disorders. For instance, bi-phenotypic acute leukemia (BAL) and mixed-phenotype acute leukemia (MPAL) belong to a biologically different group of leukemias that arise from hematopoietic stem cells with ambiguous expression of lineage markers.Citation43 The combination of the B-lymphoid marker CD19 and the myeloid marker CD33 is present on acute leukemia with a B/myeloid phenotype, which usually has a poor prognosis and an unknown origin.Citation44
There are several limitations to the current study. First, the origin of the B220+ subset of Gr1+CD11b+ cells remains to be elucidated. Second, the molecular mechanism underlying the different behaviors of Gr1+CD11b+B220+ and Gr1+CD11b+B220− cells in the tumor is an interesting topic, which needs further research. Our data reveal that IL-6 is critical for the expansion of Gr1+CD11b+B220− cells, and that knockout of IL-6 increases the population of Gr1+CD11b+B220+ cells. Therefore, we speculate that the IL-6-STAT3 signaling pathway plays opposing roles in Gr1+CD11b+B220− and Gr1+CD11b+B220+ cells. In this study, we indeed found that silencing of Stat3 increased the percentage of the B220+ subpopulation in both Ly6G+Ly6C−CD11b+ and Ly6G−Ly6C+CD11b+ cells in the in vitro system. However, the differentiation of Gr1+CD11b+ cells is incredibly complex and involves a multitude of molecular signals. Therefore, other factors that respond to the differentiation of B220−/B220+ subsets in Gr1+CD11b+ cells should be further identified. In addition, although the Gr1+CD11b+B220+ cells from tumor-bearing mice spleens have no significant effect on tumor growth unlike their B220− counterparts, the influence of Gr1+CD11b+B220+ cells from tumor-bearing mice spleens on other tumor behaviors cannot be excluded. Indeed, we found that Gr1+CD11b+B220+ cells from tumor-bearing mice spleens suppress tumor metastasis and cancer cell motility, while Gr1+CD11b+B220− cells from tumor-bearing mice spleens promote tumor metastasis and cancer cell motility. Interestingly, Dror et al. showed that CD79a, a B cell receptor adaptor, is expressed on immature BM myeloid cells and is upregulated on MDSCs by various soluble factors secreted by tumor cells in multiple different mouse models of metastatic but not non-metastatic cancer.Citation45 Moreover, activation of CD79a on mouse MDSCs enhances their migration ability, suppressive effect on T cell proliferation, and the secretion of pro-tumorigenic cytokines, and thus promotes primary tumor growth and metastasis.Citation45 Further study is needed to explore the relationship between the CD79a+ and B220+ subsets in murine Gr1+CD11b+ cells. Furthermore, although all human MDSCs are defined as CD19−, it is interesting to investigate the population and functions of CD3−CD19+CD56−HLA-DR−CD33+CD11b+CD15+/−CD14+/− cells in humans. Finally, drugs specifically targeting B220− cells will be designed and validated to determine whether they are more effective than the therapeutic method targeting the entire Gr1+CD11b+ cell population.
Collectively, the discovery of B220+ subsets in Gr1+CD11b+ cells highlights the complicated composition and functions of MDSCs, as well as expands our understanding of the plasticity of hematopoietic precursors. Moreover, bi-phenotypic immune cells may represent a novel area for the study of immature myeloid cells and tumor immunology.
Authors’ contributions
Z.Z. and R.Y. designed the study. Z.Z. wrote, revised and finalized the paper. Z.Z., X.H., E.W., and Y.H. performed the experiments. Z.Z. analyzed the experimental results.
Supplemental Material
Download ()Acknowledgments
We thank Dr. Xinxin Tian of Southern University of Science and Technology for editing the manuscript.
Disclosure statement
No potential conflict of interest was reported by the author(s).
Supplementary material
Supplemental data for this article can be accessed on the publisher’s website
Additional information
Funding
References
- Lim HX, Kim TS, Poh CL. Understanding the differentiation, expansion, recruitment and suppressive activities of myeloid-derived suppressor cells in cancers. Int J Mol Sci PubMed PMID: 32443699. 2020;21(10):3599. doi:10.3390/ijms21103599.
- Shime H, Maruyama A, Yoshida S, Takeda Y, Matsumoto M, Seya T. Toll-like receptor 2 ligand and interferon-γ suppress anti-tumor T cell responses by enhancing the immunosuppressive activity of monocytic myeloid-derived suppressor cells. Oncoimmunology PubMed PMID: 29296526; PubMed Central PMCID: PMCPMC5739553. 2018;7(1):e1373231. doi:10.1080/2162402X.2017.1373231.
- Schouppe E, Van Overmeire E, Laoui D, Keirsse J, Van Ginderachter JA. Modulation of CD8(+) T-cell activation events by monocytic and granulocytic myeloid-derived suppressor cells. Immunobiology PubMed PMID: 23932436. 2013;218(11):1385–17. doi:10.1016/j.imbio.2013.07.003.
- Ostrand-Rosenberg S, Sinha P, Beury DW, Clements VK. Cross-talk between myeloid-derived suppressor cells (MDSC), macrophages, and dendritic cells enhances tumor-induced immune suppression. Semin Cancer Biol PubMed PMID: 22313874; PubMed Central PMCID: PMCPMC3701942. 2012;22(4):275–281. doi:10.1016/j.semcancer.2012.01.011.
- Hu CE, Gan J, Zhang RD, Cheng YR, Huang GJ. Up-regulated myeloid-derived suppressor cell contributes to hepatocellular carcinoma development by impairing dendritic cell function. Scand J Gastroenterol PubMed PMID: 20822377. 2011;46(2):156–164. doi:10.3109/00365521.2010.516450.
- Li H, Han Y, Guo Q, Zhang M, Cao X. Cancer-expanded myeloid-derived suppressor cells induce anergy of NK cells through membrane-bound TGF-β1. J Immunol PubMed PMID: 19109155. 2009;182(1):240–249. doi:10.4049/jimmunol.182.1.240.
- Lee-Chang C, Rashidi A, Miska J, Zhang P, Pituch KC, Hou D, Xiao T, Fischietti M, Kang SJ, Appin CL, et al. Myeloid-derived suppressive cells promote B cell-mediated immunosuppression via transfer of PD-L1 in glioblastoma. Cancer Immunol Res PubMed PMID: 31530559; PubMed Central PMCID: PMCPMC6891201. 2019;7(12):1928–1943. doi:10.1158/2326-6066.CIR-19-0240.
- Huang B, Pan PY, Li Q, Sato AI, Levy DE, Bromberg J, Divino CM, Chen S-H. Gr-1+CD115+ immature myeloid suppressor cells mediate the development of tumor-induced T regulatory cells and T-cell anergy in tumor-bearing host. Cancer Res PubMed PMID: 16424049. 2006;66(2):1123–1131. doi:10.1158/0008-5472.CAN-05-1299.
- Okla K, Czerwonka A, Wawruszak A, Bobinski M, Bilska M, Tarkowski R, Bednarek W, Wertel I, Kotarski J. Clinical relevance and immunosuppressive pattern of circulating and infiltrating subsets of myeloid-derived suppressor cells (MDSCs) in epithelial ovarian cancer. Front Immunol. 2019;10:691. PubMed PMID: 31001284; PubMed Central PMCID: PMCPMC6456713. doi:10.3389/fimmu.2019.00691.
- Zhang Z, Huang X, Wang E, Huang Y, Yang R. Suppression of Mll1-complex by Stat3/Cebpβ–induced miR-21a/21b/181b maintains the accumulation, homeostasis, and immunosuppressive function of polymorphonuclear myeloid-derived suppressor cells. J Immunol PubMed PMID: 32358019. 2020;204(12):3400–3415. doi:10.4049/jimmunol.2000230.
- Gao Y, Shang W, Zhang D, Zhang S, Zhang X, Zhang Y, Yang R. Lnc-C/EBPβ modulates differentiation of MDSCs through downregulating IL4i1 with C/EBPβ LIP and WDR5. Front Immunol. 2019;10:1661. PubMed PMID: 31379854; PubMed Central PMCID: PMCPMC6650770. doi:10.3389/fimmu.2019.01661.
- Walankiewicz M, Grywalska E, Polak G, Kotarski J, Siwicka-Gieroba DJ, Rolinski J. Myeloid-derived suppressor cells in ovarian cancer: friend or foe? Cent Eur J Immunol PubMed PMID: 29472817; PubMed Central PMCID: PMCPMC5820985. 2017;42(4):383–389. doi:10.5114/ceji.2017.72823.
- Nakamura K, Kassem S, Cleynen A, Chretien ML, Guillerey C, Putz EM, Bald T, Förster I, Vuckovic S, Hill GR, et al. Dysregulated IL-18 is a key driver of immunosuppression and a possible therapeutic target in the multiple myeloma microenvironment. Cancer Cell PubMed PMID: 29551594. 2018;33(4):634–48e5. doi:10.1016/j.ccell.2018.02.007.
- Kusmartsev S, Gabrilovich DI. Immature myeloid cells and cancer-associated immune suppression. Cancer Immunol Immunother PubMed PMID: 12111117. 2002;51(6):293–298. doi:10.1007/s00262-002-0280-8.
- Nefedova Y, Huang M, Kusmartsev S, Bhattacharya R, Cheng P, Salup R, Jove R, Gabrilovich D. Hyperactivation of STAT3 is involved in abnormal differentiation of dendritic cells in cancer. J Immunol PubMed PMID: 14688356. 2004;172(1):464–474. doi:10.4049/jimmunol.172.1.464.
- Xu M, Zhao Z, Song J, Lan X, Lu S, Chen M, Wang Z, Chen W, Fan X, Wu F, et al. Interactions between interleukin-6 and myeloid-derived suppressor cells drive the chemoresistant phenotype of hepatocellular cancer. Exp Cell Res PubMed PMID: 28109867. 2017;351(2):142–149. doi:10.1016/j.yexcr.2017.01.008.
- Yu J, Wang Y, Yan F, Zhang P, Li H, Zhao H, Yan C, Yan F, Ren X. Noncanonical NF-κB activation mediates STAT3-stimulated IDO upregulation in myeloid-derived suppressor cells in breast cancer. J Immunol PubMed PMID: 25063873; PubMed Central PMCID: PMCPMC4719564. 2014;193(5):2574–2586. doi:10.4049/jimmunol.1400833.
- Liu Q, Zhu H, Zhang C, Chen T, Cao X. Small GTPase RBJ promotes cancer progression by mobilizing MDSCs via IL-6. Oncoimmunology PubMed PMID: 28197363; PubMed Central PMCID: PMCPMC5283632. 2017;6(1):e1245265. doi:10.1080/2162402X.2016.1245265.
- Chen MF, Kuan FC, Yen TC, Lu MS, Lin PY, Chung YH, Chen W-C, Lee K-D. IL-6-stimulated CD11b+ CD14+ HLA-DR- myeloid-derived suppressor cells, are associated with progression and poor prognosis in squamous cell carcinoma of the esophagus. Oncotarget PubMed PMID: 25238263; PubMed Central PMCID: PMCPMC4226716. 2014;5(18):8716–8728. doi:10.18632/oncotarget.2368.
- Dawod B, Liu J, Gebremeskel S, Yan C, Sappong A, Johnston B, Hoskin DW, Marshall JS, Wang J. Myeloid-derived suppressor cell depletion therapy targets IL-17A-expressing mammary carcinomas. Sci Rep PubMed PMID: 32770025; PubMed Central PMCID: PMCPMC7414122. 2020;10(1):13343. doi:10.1038/s41598-020-70231-7.
- Ma X, Wang M, Yin T, Zhao Y, Wei X. Myeloid-derived suppressor cells promote metastasis in breast cancer after the stress of operative removal of the primary cancer. Front Oncol. 2019;9:855. PubMed PMID: 31552179; PubMed Central PMCID: PMCPMC6746963. doi:10.3389/fonc.2019.00855.
- Di S, Zhou M, Pan Z, Sun R, Chen M, Jiang H, Shi B, Luo H, Li Z. Combined adjuvant of poly I:C improves antitumor effects of CAR-T cells. Front Oncol. 2019;9:241. PubMed PMID: 31058074; PubMed Central PMCID: PMCPMC6481273. doi:10.3389/fonc.2019.00241.
- Liu Y, Kosaka A, Ikeura M, Kohanbash G, Fellows-Mayle W, Snyder LA, Okada H. Premetastatic soil and prevention of breast cancer brain metastasis. Neuro Oncol PubMed PMID: 23595625; PubMed Central PMCID: PMCPMC3688013. 2013;15(7):891–903. doi:10.1093/neuonc/not031.
- Garcia-Mendoza MG, Inman DR, Ponik SM, Jeffery JJ, Sheerar DS, Van Doorn RR, Keely PJ. Neutrophils drive accelerated tumor progression in the collagen-dense mammary tumor microenvironment. Breast Cancer Res PubMed PMID: 27169366; PubMed Central PMCID: PMCPMC4864897. 2016;18(1):49. doi:10.1186/s13058-016-0703-7.
- Qu J, Liu L, Xu Q, Ren J, Xu Z, Dou H, Shen S, Hou Y, Mou Y, Wang T, et al. CARD9 prevents lung cancer development by suppressing the expansion of myeloid-derived suppressor cells and IDO production. Int J Cancer PubMed PMID: 31008530. 2019;145(8):2225–2237. doi:10.1002/ijc.32355.
- Chang CJ, Yang YH, Chiu CJ, Lu LC, Liao CC, Liang CW, Hsu CH, Cheng AL. Targeting tumor-infiltrating Ly6G(+) myeloid cells improves sorafenib efficacy in mouse orthotopic hepatocellular carcinoma. Int J Cancer PubMed PMID: 29266245. 2018;142(9):1878–1889. doi:10.1002/ijc.31216.
- Zheng Y, Xu M, Li X, Jia J, Fan K, Lai G. Cimetidine suppresses lung tumor growth in mice through proapoptosis of myeloid-derived suppressor cells. Mol Immunol PubMed PMID: 23220070. 2013;54(1):74–83. doi:10.1016/j.molimm.2012.10.035.
- Weiss JM, Subleski JJ, Back T, Chen X, Watkins SK, Yagita H, Sayers TJ, Murphy WJ, Wiltrout RH. Regulatory T cells and myeloid-derived suppressor cells in the tumor microenvironment undergo Fas-dependent cell death during IL-2/alphaCD40 therapy. J Immunol PubMed PMID: 24808361; PubMed Central PMCID: PMCPMC4048774. 2014;192(12):5821–5829. doi:10.4049/jimmunol.1400404.
- Nefedova Y, Fishman M, Sherman S, Wang X, Beg AA, Gabrilovich DI. Mechanism of all-trans retinoic acid effect on tumor-associated myeloid-derived suppressor cells. Cancer Res PubMed PMID: 18006848. 2007;67(22):11021–11028. doi:10.1158/0008-5472.CAN-07-2593.
- Hou C, Kong J, Liang Y, Huang H, Wen H, Zheng X, Wu L, Chen Y. HMGB1 contributes to allergen-induced airway remodeling in a murine model of chronic asthma by modulating airway inflammation and activating lung fibroblasts. Cell Mol Immunol PubMed PMID: 25152078; PubMed Central PMCID: PMCPMC4496537. 2015;12(4):409–423. doi:10.1038/cmi.2014.60.
- Wu T, Wang C, Wang W, Hui Y, Zhang R, Qiao L, Dai Y. Embelin impairs the accumulation and activation of MDSCs in colitis-associated tumorigenesis. Oncoimmunology PubMed PMID: 30377563; PubMed Central PMCID: PMCPMC6205065. 2018;7(11):e1498437. doi:10.1080/2162402X.2018.1498437.
- Pastushenko I, Blanpain C. EMT transition states during tumor progression and metastasis. Trends Cell Biol PubMed PMID: 30594349. 2019;29(3):212–226. doi:10.1016/j.tcb.2018.12.001.
- Xin J, Zhang Z, Su X, Wang L, Zhang Y, Yang R. Epigenetic component p66a modulates myeloid-derived suppressor cells by modifying STAT3. J Immunol PubMed PMID: 28193828. 2017;198(7):2712–2720. doi:10.4049/jimmunol.1601712.
- Gabrilovich DI. Myeloid-derived suppressor cells. Cancer Immunol Res PubMed PMID: 28052991; PubMed Central PMCID: PMCPMC5426480. 2017;5(1):3–8. doi:10.1158/2326-6066.CIR-16-0297.
- Abad C, Nobuta H, Li J, Kasai A, Yong WH, Waschek JA. Targeted STAT3 disruption in myeloid cells alters immunosuppressor cell abundance in a murine model of spontaneous medulloblastoma. J Leukoc Biol PubMed PMID: 24068730; PubMed Central PMCID: PMCPMC3896661. 2014;95(2):357–367. doi:10.1189/jlb.1012531.
- Ibrahim ML, Lu C, Klement JD, Redd PS, Yang D, Smith AD, Liu K. Expression profiles and function of IL6 in polymorphonuclear myeloid-derived suppressor cells. Cancer Immunol Immunother PubMed PMID: 32488308. 2020;69(11):2233–2245. doi:10.1007/s00262-020-02620-w.
- Li S, Feng J, Wu F, Cai J, Zhang X, Wang H, Fetahu IS, Iwanicki I, Ma D, Hu T, et al. TET2 promotes anti-tumor immunity by governing G-MDSCs and CD8(+) T-cell numbers. EMBO Rep PubMed PMID: 32929842; PubMed Central PMCID: PMCPMC7534639. 2020;21(10):e49425. doi:10.15252/embr.201949425.
- Audzevich T, Bashford-Rogers R, Mabbott NA, Frampton D, Freeman TC, Potocnik A, Kellam P, Gilroy DW. Pre/pro-B cells generate macrophage populations during homeostasis and inflammation. Proc Natl Acad Sci U S A PubMed PMID: 28461481; PubMed Central PMCID: PMCPMC5441795. 2017;114(20):E3954–E63. doi:10.1073/pnas.1616417114.
- Blin-Wakkach C, Wakkach A, Rochet N, Carle GF. Characterization of a novel bipotent hematopoietic progenitor population in normal and osteopetrotic mice. J Bone Miner Res PubMed PMID: 15176997. 2004;19(7):1137–1143. doi:10.1359/JBMR.040318.
- Zriwil A, Boiers C, Wittmann L, Green JC, Woll PS, Jacobsen SE, Sitnicka E. Macrophage colony-stimulating factor receptor marks and regulates a fetal myeloid-primed B-cell progenitor in mice. Blood PubMed PMID: 27207794; PubMed Central PMCID: PMCPMC5009960. 2016;128(2):217–226. doi:10.1182/blood-2016-01-693887.
- Dannaeus K, Johannisson A, Nilsson K, Jonsson JI. Flt3 ligand induces the outgrowth of Mac-1+B220+ mouse bone marrow progenitor cells restricted to macrophage differentiation that coexpress early B cell-associated genes. Exp Hematol PubMed PMID: 10560912. 1999;27(11):1646–1654. doi:10.1016/s0301-472x(99)00106-x.
- Rosborough BR, Mathews LR, Matta BM, Liu Q, Raich-Regue D, Thomson AW, Turnquist HR. Cutting edge: flt3 ligand mediates STAT3-independent expansion but STAT3-dependent activation of myeloid-derived suppressor cells. J Immunol PubMed PMID: 24639346; PubMed Central PMCID: PMCPMC3994403. 2014;192(8):3470–3473. doi:10.4049/jimmunol.1300058.
- Yu J, Li Y, Xing H, Pan Y, Sun H, Wan D, Liu Y, Xie X, Wang C, Sun L, et al. Clinical characteristics and outcome of biphenotypic acute leukemia: 10 case reports and literature review. Cancer Manag Res. PubMed PMID: 31802948; PubMed Central PMCID: PMCPMC6827437. 2019;11:9297–9306. doi:10.2147/CMAR.S226058.
- Roskopf CC, Braciak TA, Fenn NC, Kobold S, Fey GH, Hopfner KP, Oduncu FS. Dual-targeting triplebody 33-3-19 mediates selective lysis of biphenotypic CD19+ CD33+ leukemia cells. Oncotarget PubMed PMID: 26981773; PubMed Central PMCID: PMCPMC5008383. 2016;7(16):22579–22589. doi:10.18632/oncotarget.8022.
- Luger D, Yang YA, Raviv A, Weinberg D, Banerjee S, Lee MJ, Trepel J, Yang L, Wakefield LM. Expression of the B-cell receptor component CD79a on immature myeloid cells contributes to their tumor promoting effects. PLoS One PubMed PMID: 24146823; PubMed Central PMCID: PMCPMC3797715. 2013;8(10):e76115. doi:10.1371/journal.pone.0076115.