
ABSTRACT
Tumor infiltrating mast cells (TIMs), with pro- or anti-tumorigenic role in different types of malignancies, have been implicated in resistance to anti-PD1 therapy. Here, we aimed to identify the relevance of TIMs with the prognosis, immune contexture, and immunotherapy in high-grade serous ovarian cancer (HGSOC). Tissue microarrays containing 197 HGSOC patients were assessed by immunohistochemistry (IHC) for detecting the expression of mast cell tryptase and other immune markers. Kaplan-Meier curve, log-rank test, and Cox regression model were applied to perform survival analysis. Single-cell RNA-seq analysis and flow cytometric analysis were selected to characterize TIMs. Furthermore, short-term HGSOC organoids were employed to validate the effect of TIMs on anti-PD1 therapy. Abundance of stromal TIMs (sTIMs) predicted dismal prognosis and linked to immunoevasive subtype of HGSOC, characterized by increased infiltration of pro-tumor cells (Treg cells, M2-polarized macrophages, and neutrophils) and impaired anti-tumor immune functions. Intensive inter-cell interactions between TIMs and other immune cells were identified, suggesting potential cross-talks to foster an immunosuppressive microenvironment. Organoids derived from sTIMs-low patients were associated with increased response to anti-PD-1 treatment other than the presence of high sTIMs infiltration. A nomogram, constructed by combining FIGO stage, sTIMs, and PD-L1, with an area under the curve (AUC) for predicting 5-year overall survival of 0.771 was better than that of FIGO staging system of 0.619. sTIMs/PD-L1-based classifier has potential clinical application in predicting prognosis of patients with HGSOC. sTIMs-high tumors correlate with immunosuppressive tumor microenvironment (TME) and possess potential insensitivity to immunotherapy.
Introduction
High-grade serous ovarian cancer (HGSOC) accounts for the leading cause of ovarian cancer deaths, even after successful first-line treatment with cytoreductive surgery followed by combined chemotherapy.Citation1,Citation2 Immune checkpoint blockade (ICB) therapy has been proven to be a promising treatment strategy for a variety of malignancies through unleashing anti-tumor immunity.Citation3–5 Nevertheless, various clinical trials using anti-programmed cell death-1 (anti-PD-1), anti-programmed cell death ligand-1 (anti-PD-L1), or anti-cytotoxic-T-lymphocyte-associated protein 4 (anti-CTLA-4) antibodies have shown limited response rates of 10%-15% in patients with ovarian cancer.Citation6–8 However, these clinical trials were conducted in unstratified patients, as existing biomarkers for ICB response are controversial.Citation8,Citation9 Therefore, further stratification of patients with HGSOC for predicting response to ICB therapy is urgently needed.
Emerging researches highlight the complex relationship between ICB response and tumor-infiltrating immune cells.Citation10–15 For example, CD4+ memory T cells enrichment and tumor-infiltrating lymphocytes density at tumor invasive margin strongly correlated with better ICB efficacy.Citation13,Citation14 Conversely, Treg cells and tumor-associated macrophages were linked to poor ICB responsiveness.Citation16,Citation17 Tumor infiltrating mast cells (TIMs) were associated with resistance to anti-PD-1 therapy in a humanized mouse melanoma model, while depletion of TIMs significantly increased anti-PD-1 response.Citation18 However, the association between TIMs and survival as well as response to immune checkpoint blockade therapy in HGSOC remains elusive.
The role of TIMs in tumors still remains controversial, because TIMs may engender pro- or anti-tumor effects, depending on the context of tumor development.Citation19–24 For instance, high infiltration of TIMs is associated with longer survival of patients with colon cancer and shorter survival in clear cell renal cell carcinoma.Citation21,Citation24 A previous study showed that there was no relationship between the density of TIMs and the survival rate of advanced ovarian cancer.Citation25 However, the number of patients enrolled in the above study was small (serous adenocarcinomas, n = 33; others, n = 11). The correlation between TIMs and TME in HGSOC remains unclear to date.
In the present study, we observed the correlations between TIMs and overall survival of patients with HGSOC. In addition to the relationship between TIMs and the immunosuppressive TME, the predictive value of TIMs for ICB treatment would also be explored. The intercellular interactions among TIMs and other immune cells were studied in scRNA-seq dataset from HGSOC.
Materials and methods
Ethics approval and consent to participate
The study was approved by the Ethics Committee of Obstetrics and Gynecology Hospital, Fudan University (Kyy2016-49, Kyy2017-27) and the Ethics Committee of Suzhou Municipal Hospital. The study was performed in accordance with the Declaration of Helsinki. All patients in this study provided written informed consent for sample collection and data analysis.
Study population
The Discovery set included 120 patients with HGSOC who underwent primary surgery at our hospital between March 2013 and November 2015. The Validation set collected 79 patients with HGSOC at Suzhou Municipal Hospital from May 2013 to August 2018 and two patients were excluded from analysis due to unavailable tissue samples. Pathological staging was graded according to the FIGO (International Federation of Gynecology and Obstetrics) Classification (2018), and histological types were determined according to the current WHO (World Health Organization) Classification. Overall survival (OS) was determined from the date of surgery to death or last follow-up. All patients were followed up until March 2019. None of the patients received neo-adjuvant chemotherapy, radiation, or any other anti-tumor medicines before surgery. Fresh tumor tissues from 30 patients with HGSOC were applied to organoids culture (n = 23), and paired with autologous peripheral blood (n = 9). The characteristics of all participants were shown in Supplementary Table S1.
Immunohistochemistry and evaluation
Tissue microarrays (TMAs) were established and immunohistochemistry (IHC) staining was performed as previously described.Citation26 Briefly, all specimens were reviewed with hematoxylin and eosin staining, and two 2.0-mm diameter tissue cores of the rich tumor area were punched out from each sample to construct TMAs. To perform IHC, the TMA sections were deparaffinized in xylene and rehydrated to distilled water, and the endogenous peroxidase was quenched in 3% hydrogen peroxide in methanol for 30 minutes. Subsequently, antigen retrieval was performed with citrate buffer for 10 minutes in a water bath. Sections were incubated with 10% normal goat serum for 30 minutes to block nonspecific staining, without being washed, then were incubated with primary antibodies (listed in Supplementary Table S2) overnight at 4°C. After washing, sections were incubated with polymer reinforce followed enzyme labeled anti-mouse/rabbit polymer (PV-9000, Beijing ZSGB Co., Ltd., Beijing, China) and visualized with 3ʹ3-diaminobenzidine DAB (Cell Signaling Technology, Danvers, MA). Immunoglobulin isotype (IgG) was used as a negative control. Images were taken on Nikon Eclipse 80i microscope (Nikon Instruments, NY). The representative images were shown in Supplementary Figures S1–3. TMAs were independently reviewed by two investigators (M.Y. and Y.W.) who were blind to clinical information. The positive cells were enumerated from three representative view of sections in high-power field (HPF) at a magnification of 200X (area: 0.4 mm2) and an average number was adopted. PD-L1 was scored as positive or negative for using a threshold of ≥1 positive cells in any representative fields.Citation27
Definition of cutoff value
The optimal cutoff values of TIMs, sTIMs, and iTIMs were calculated by X-tile (version 3.6.1) with the minimum P value. The cutoff value of TIMs was nine cells per HPF (×200 magnification), the cutoff value of sTIMs was 7.3 cells per HPF (×200 magnification), the cutoff value of iTIMs was 1.5 cells per HPF (×200 magnification), and the cutoff value of TIMs in TCGA was 5.3 (fractions by CIBERSORT).
Preparation of single cell suspension from HGSOC tissues
Fresh tissues were washed with cold phosphate buffer saline (PBS) which contained 1% fetal bovine serum (FBS) for three times. The specimens were minced into small pieces and collected in RPMI-1640 medium containing 1 mg/mL collagenase IV and 10 mg/mL deoxyribonuclease I and mechanically dissociated using MACS Dissociator (Miltenyi BioTech). Dissociated cell suspensions were further incubated for 1 h at 37°C under continuous rotation. The cell suspensions were then filtered through a 100 μm cell strainer (BD Labware) and washed once with PBS.
Flow cytometry
Single cell suspensions from tumor tissues and peripheral blood cells were blocked with Fc-receptor blocking reagent (Biolegend). The cells were subsequently stained with fluorochrome-conjugated antibodies against cell surface markers for 30 min at 4°C in the dark. Before intracellular and intranuclear staining, samples were treated with FOXP3/Transcription Factor Staining Buffer Set (Invitrogen). Parallel cells were stained with isotype-matched control antibodies to control for background staining. Dead cells were excluded by Zombie Aqua™ Fixable Viability Kit (Biolegend). Fluorescence was measured by flow cytometry with a CytoFLEX flow cytometer (Beckmann Coulter) and analyzed using FlowJo software version 10.08 (Tree Star). Specific information of antibodies was listed in Supplementary Table S3.
Single-cell RNA-seq analysis
ScRNA-seq profiling from primary (n = 3; GSE158937) and metastatic (n = 2; GSE147082) HGSOC without neoadjuvant therapy was merged via R package ‘Seurat’. For each sample, genes that were expressed in less than 3 cells and cells that expressed less than 200 genes were excluded. Furthermore, the data was filtered to include cells that expressed not more than 6000 genes and less than 25% of mitochondrial transcripts. After quality control, we obtained 11560 cells in total. After data normalization, principal component analysis, and Uniform Manifold Approximation and Projection (UMAP), 18 clusters were identified and defined by canonical cell markers. R package ‘CellChat’ was used to infer intercellular communication networks through a database of interactions among ligands, receptors, and their cofactors.Citation28
Ex vivo analysis
To recapitulate the tumor faithfully from their derivation and test the sensitivity to PD-1 blockade, we developed HGSOC short-term organoids culture.Citation29 The single cell suspension was incubated in 1× Red Blood Cell Lysis buffer (Biolegend) for five minutes at room temperature, and spun for three minutes at 1500 RPM. The lysis buffer was aspirated and resuspended in RPMI-1640 (10% FBS, and 1% Pen/Strep). The appropriate cell number of single cell suspension was diluted to a concentration of 6 × 10⁶ cells/mL in RPMI-1640, 10% FBS, 1% Pen/Step, and 30 ng/mL of IL-2 (Peprotech) mixed with 15% Matrigel (Corning). 40 μL of suspension was added per well of 48 well plate. Anti-PD-1 antibody and isotype control antibody (Bioxcell) were used at a final concentration of 10 μg/mL in RPMI-1640, 10% FBS, 1% Pen/Strep, and 30 ng/mL of IL-2 for 72 hours. Protein transporter inhibitor (Invitrogen) was added to the media at a concentration of 1:500 and incubated for 2 hours prior to being harvested for flow cytometry analysis.
External data source and computational analysis
Transcriptomic, mutation, and clinical data of TCGA-OV were downloaded from the GDC Data Portal (https://portal.gdc.cancer.gov/) in Dec 2019. The RNA-seq data were normalized via transcripts per million (TPM). 316 cases conformed the following criteria: (a) available for mRNA expression data, (b) available for clinical data and follow-up information, (c) serous ovarian cancer and grade ≥ 3. According to these criteria, data of RNA-seq and response to PD-1 blockade therapy (GSE93157) in patients with melanoma were obtained from Gene Expression Omnibus (https://www.ncbi.nlm.nih.gov/geo/). The fraction of TIMs was calculated by CIBERSORT algorithm (LM22 signature and 1000 permutations) and its abundance was equal to the sum of mast cell resting and mast cell activated.Citation30,Citation31 Gene Set Enrichment Analysis (GSEA) was conducted in GSEA software (http://software.broadinstitute.org/gsea/). R package ‘limma’ was used to identify differential expressed genes (DEG, |FoldChange| > 2 and adjust.P < .05) between patients with high and low TIMs infiltration. Immune checkpoint signature and antigen presenting machinery signature, defined from previous studies, were viewed as biomarkers for ICB therapy in various solid tumors and scored as the average of related genes expression (Supplementary Table S4). R packages ‘rms’ and ‘survival’ were used for constructing nomogram. Time-dependent AUC analysis and time-dependent ROC curves were computed with ‘survival’ and ‘timeROC’ packages.
Statistical analysis
Student’s t-test and paired t-test were used for two group differential analysis. Spearman’s correlation test was used for correlation analysis. Pearson’s chi-square test and Fisher’s exact test were used to compare variables. For univariable survival analysis, survival curves were estimated by the Kaplan–Meier method and log-rank test were performed to compare the difference between two survival curves in software Medcalc 15. Relevant variables in univariable analysis with a P < .2 were included in the multivariable Cox analysis. Statistical analyses were conducted using IBM SPSS Statistics (version 21.0), Graph Pad Prism Software (version 8.0), and Medcalc software (version 15.2.2). The significant value was defined as P < .05, and all tests were two-sided.
Results
Stromal infiltrating mast cells correlate with tumor progression in HGSOC
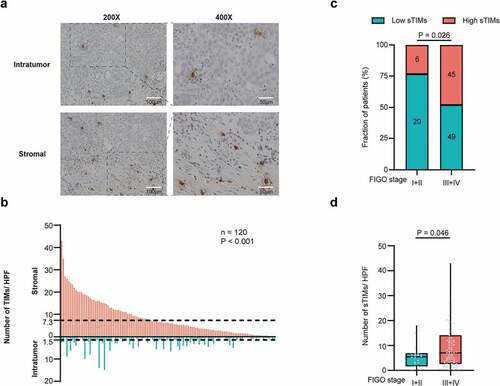
Tumor-infiltrating mast cells (TIMs) were quantified in HGSOC (). Compared with intratumor tissues, stromal tissues showed significantly higher infiltration of TIMs (). The optimal cutoff value of stromal infiltrating TIMs (sTIMs) and intratumor infiltrating TIMs (iTIMs) were 7.3 cells/HPF and 1.5 cells/HPF, respectively (). Consequently, we predominantly focused on sTIMs in the following study. sTIMs were positively correlated with FIGO stage (P = .026, ; P = .046, ), while no significant difference was observed in iTIMs (Supplementary Figure S4a), indicating that sTIMs correlate with tumor progression.
Figure 1. Evaluation of TIMs by IHC in patients with HGSOC. a Representative IHC staining images of TIMs in different tumor tissue compartments. Magnification at 200X and 400X. b Numbers of TIMs per HPF were compared between intratumor and stromal tissues (n = 120) and cutoff value of sTIMs and iTIMs were 7.3 cells/HPF and 1.5 cells/HPF respectively. P-value (paired t test). c Relative portion of high and low sTIMs according to FIGO stage. Figures at each box indicated the number of corresponding patients. P-value (pearson’s chi-square test). d Association between sTIMs and FIGO stage. P-value (student’s t test)
Increased infiltration of sTIMs is associated with poor prognosis of HGSOC
To further investigate the clinical significance of sTIMs in HGSOC, we applied Kaplan-Meier curve and log-rank test to compare the OS between high and low sTIMs subgroups. In both Discovery set and Validation set, higher infiltration of sTIMs predicted poorer OS (HR = 2.252, 95% confidence interval [CI], 1.339–3.790, P = .001, and HR = 2.978, 95%CI, 1.231–4.201, P = .018, respectively) (). In TCGA set, higher fraction of TIMs associated with dismal prognosis (HR = 1.489, 95%CI, 1.022–2.168, P = .018) (). Multivariate Cox regression analysis indicated that sTIMs could serve as a potential independent prognostic factor for OS in Discovery set, while TIMs could serve as an independent prognostic factor of OS in TCGA set (). Meanwhile TIMs were also associated with poorer OS in both sets (Supplementary Figure S4b, S4c), but no relationship was observed between iTIMs and OS (Supplementary Figure S4d, S4e).
Figure 2. sTIMs predicts poor prognosis in HGSOC. a-b Kaplan-Meier curve was established according to different sTIMs level in Discovery set and Validation set. The overall survival (OS) was compared between patients with high sTIMs and low sTIMs infiltration. Log-rank test was performed for Kaplan-Meier curves. c Kaplan-Meier curve and log-rank test were conducted according to different TIMs level in TCGA set. OS was compared between patients with high TIMs and low TIMs infiltration. Log-rank test was performed for Kaplan-Meier curves. d Univariate and multivariate cox regression for TIMs and clinic-pathological variables in Discovery set (n = 120) and TCGA set (n = 316). HR, hazard ratio; CI, confidence interval; Pos., positive; Neg., negative; LN metastasis, lymph nodes metastasis; SD, stable disease; PD, progressive disease; CR, complete remission; PR, partial remission. Significant P values (P < .05) are bolded
Consistently, we found that the presence of PD-L1 was associated with favorable prognosis in multivariate analysis ().Citation27 Furthermore, we investigated the correlations between tumor infiltrating immune cells (CD3, CD4, CD8, Th1, Th2, Treg, B, NK, Macrophages, M2 polarized macrophages, neutrophils, TIMs, and sTIMs) and OS in univariate and multivariate analysis in both Discovery and TCGA set. M2-polarized macrophages and neutrophils served as an independent poor OS predictor consistently in both sets (Supplementary Table S5, Table S6).
sTIMs enrichment correlate with immunoevasive tumor microenvironment
We investigated whether sTIMs were associated with the tumor microenvironment which plays important roles in clinical outcomes and immunotherapeutic response.Citation32 Tumor associated immune cells and effector molecules were evaluated by IHC and the representative IHC images were presented in Supplementary Figures S1–3. sTIMs were positively correlated with Treg cells, M2-polarized macrophages, and neutrophils (, Supplementary Figure S5a). When regarding sTIMs as a dichotomous data, the numbers of Treg cells, M2-polarized macrophages, and neutrophils were significantly higher in sTIMs high group than those in sTIMs low group (). Furthermore, sTIMs were negatively correlated with granzyme B (GZMB), perforin 1 (PRF1), T cell immunoglobulin-and mucin domain-containing protein 3 (Tim-3) and programmed cell death 1 (PD-1), while positively correlated with interleukin-10 (IL-10) and tumor growth factor (TGF)-β (, Supplementary Figure S5b). Consistently, compared with sTIMs low group, the number of GZMB, PRF1, TNF-α, Tim-3, and PD-1 positive cells was significantly lower while the number of IL-10 and TGF-β positive cells was significantly higher in sTIMs high group (). These results were also confirmed in Validation set (Supplementary Figure 5c, S5d).
Figure 3. sTIMs link to immunoevasive subtype of HGSOC. a Heat map displayed scaled expression of various immune cells between high (n = 51) and low (n = 69) sTIMs groups and numbers in left boxes indicated the spearman correlation coefficients with corresponding immune cells (**, P < .01; ***, P < .001). b Comparison of the various immune cells between high (n = 51) and low (n = 69) sTIMs groups. P-value (student’s t test). c Heat map displayed scaled expression of various immune molecules between high (n = 51) and low (n = 69) sTIMs groups and numbers in left boxes indicated the spearman correlation coefficients with corresponding molecules (*, P < .05, **, P < .01; ***, P < .001). d Comparison of the various immune molecules between high (n = 51) and low (n = 69) sTIMs groups. P-value (student’s t test). e Proportion of different immune cells of HGSOC specimens with low (n = 18) and high (n = 12) sTIMs level. P-value (student’s t test). f Proportion of immune effector molecules (GZMB, PRF1, and IFN-γ) in CD8+ T cells of HGSOC specimens with low (n = 18) and high (n = 12) sTIMs level. P-value (student’s t test). g Proportion of immune checkpoint molecules (CTLA-4, Tim-3, PD-1, and LAG-3) in CD8+ T cells of HGSOC specimens with low (n = 18) and high (n = 12) sTIMs level. P-value (student’s t test)
Flow cytometry analysis illustrated that more Treg, CD206+macrophages, and neutrophils in tumors with high sTIMs (). Furthermore, we investigated the functional phenotype of CD8+ T cells between sTIMs high/low subgroups. Notably, the expression of effector molecules (GZMB and PRF1) and immune checkpoint PD-1 in CD8+ T cells was marginally decreased in tumors with high sTIMs (). Consistently, tumors with high fraction of TIMs down-regulated expression of anti-tumor immune response genes as well as signaling pathways involved in “antigen processing and presentation”, “natural killer cell mediated cytotoxicity” and “T cell receptor signaling pathway” (Supplementary Figure S6a, S6b). These findings suggest sTIMs could contribute to the establishment of immunosuppressive tumor microenvironment.
TIMs and other immune cells crosstalk in the tumor microenvironment of HGSOC
To better characterize the role of TIMs in the establishment of immunosuppressive tumor microenvironment, we identified and visualized 18 clusters using the UMAP method in the integrated scRNA-seq profiling from primary (n = 3) and metastatic (n = 2) HGSOC (). According to the expression of PTPRC (CD45), cells were divided into nonimmune cells (10 clusters) and immune cells (8 clusters) (Supplementary Figure S7a). Immune cells included myeloid cells (LYZ and C1QB), cytotoxic T cells (CD3D, CD8A, GZMA, and PRF1), naïve T cells (CD3D, CCR7, and IL7R), Treg cells (FOXP3 and IL2RA), B cells (MS4A1 and CD79A), plasma cells (MZB1 and CD38), plasmacytoid DC (pDC; TCF4, LILRA4, and GZMB), and mast cells (TPSAB1 and CD117) (). Differentially expressed gene analysis indicated that TPSAB1 and CD117 ranked the top upregulated genes in mast cells (Supplementary Figure S7b, S7 c). Gene Ontology (GO) term enrichment analysis of DEGs revealed that in addition to mast cell degranulation, positive regulation of type I hypersensitivity, and Fc-epsilon receptor signaling pathway, mast cells also have the potential to reshape the immune microenvironment, such as positive regulation of macrophage differentiation and immune response (Supplementary Table S7). We calculated the mean of normalized expression of top 30 marker genes (ranked by FoldChange) to represent the relative abundance of TIMs. Consistently, high TIMs score also linked to poor prognosis (Supplementary Figure S7d and Supplementary table S4).
Figure 4. Integrated scRNA-seq analysis of patients with HGSOC. a UMAP plot shows the annotation and color codes for cell clusters (n = 18) in HGSOC. b Heatmap of Z-scored expression of the top canonical cell markers of each immune cell populations. The depth of color from red to yellow represents low to high expression. c Inferred interactions of immune cells. The arrow width is the sum of interaction values between two clusters. L-R pairs with a value >10 and P < .05 are shown. d Inferred interactions between mast cells and other immune cells. The arrow width is the sum of interaction values between two clusters. L-R pairs with a value >10 and P < .05 are shown. e Bubble plot shows selected L-R pairs between mast cells and other immune cells. The depth of color from blue to red represents low to high communication probability. The size of the bubble represents corresponding P values. Commun. Prob, communication probability. f Dot plot illustrates the fraction of PD-L1+ Mast cells, in 9 matched tissue and blood samples. Two dimensional FACs plots shows PD-L1+ mast cells from HGSOC tumor tissue (top right panel) and peripheral blood (down right panel). Pb, peripheral blood. g Dot plot illustrates the fraction of TGF-β+ Mast cells, in 9 matched tissue and blood samples. Two dimensional FACs plots shows TGF-β+ mast cells from HGSOC tumor tissue (top right panel) and peripheral blood (down right panel). Pb, peripheral blood
Next, we focused on cell-cell interaction network in HGSOC. Although myeloid cells harbored the most ligand-receptor interactions, several potential interactions among mast cells and other immune cells were identified (). Mast cells were predicted to interact with myeloid cells via TGFB1-(TGFBR1+ TGFBR2) axis and CSF1-CSF1R axis, suggesting that mast cells could promote proliferation and differentiation of macrophages. CCL4-CCR5 interactions was inferred between mast cells and Treg cells, suggesting that mast cells could attract Treg cells in HGSOC. Cell-cell communication result also indicated that mast cells might employ CLEC2B/C-KLRB1 axis and PD-L1-PD-1 axis to inhibit the anti-tumor function of T cells (). Compared with peripheral mast cells (n = 9), TIMs in HGSOC (n = 9) expressed higher level of TGF-β and PD-L1, which further supported the inferred interactions ().
Stratification of patients based on sTIMs predicts immune checkpoint blockade therapy response and prognosis in HGSOC
Given that TIMs could contribute to anti-PD-1 resistance in tumor mice models, we explored the relationship between sTIMs and ICB response in patients with HGSOC. Tumors with low sTIMs exhibited more of PD-L1 protein and mRNA expression than tumors with high sTIMs in Discovery and TCGA set (). In addition, scores of immune checkpoint signature and antigen-presenting machinery signature were significantly more accumulated in tumors with low fraction of TIMs in TCGA set (Supplementary Figure S8a, S8b). Compared with organoids derived from high sTIMs tumors, organoids from low sTIMs tumors exhibited enhanced effector function of CD8+T cells in response to anti-PD-1 antibody (). Intriguingly, melanoma patients failing to response to immune checkpoint blockade therapy tended to have increased fraction of TIMs compared with patients benefited from immune checkpoint therapy ().
Figure 5. Low sTIMs were associated with better ICB response. a Relative portion of PD-L1 positive rate according to sTIMs level (sTIMs-low group, n = 69; sTIMs-high group, n = 51). PD-L1 positive rate was higher in low sTIMs group. Figures at each box indicated the number of corresponding patients. P-value (pearson’s chi-square test). Pos., positive; Neg., negative. b Comparison of mRNA expression of PD-L1 between HGSOC with high(n = 62) and low(n = 254) TIMs in TCGA set. TPM, transcripts per million. P-value (student’s t test). c Proportion of immune effector molecules (GZMB, and IFN-γ) in CD8+ T cells of 23 HGSOC organoids (low sTIMs, n = 11; high sTIMs, n = 12) in control group and anti-PD-1 group. P-value (paired t test). d Fraction of TIMs between response (n = 20; CR, complete remission; PR, partial remission; SD, stable disease) and nonresponse (n = 5; PD, progressive disease) group in patients with melanoma. P-value (student’s t test). e Nomogram based on FIGO stage, PD-L1, and sTIMs was developed for predicting 3-year survival probability and 5-year survival probability. f Time-dependent ROC curve was established to show the detailed AUC at 3 years (n.s., not significant). g Time-dependent ROC curve was established to show the detailed AUC at 5 years (***, P < .001)
Based on the significant variables in the multivariable analysis, we developed a nomogram to predict OS with sTIMs, PD-L1, and FIGO stage (). The area under the receiver operating characteristic curve (AUC) of 0.727 for predicting 3-year survival and 0.771 for 5-year survival were better than FIGO stage alone (AUC of 0.648 for 3-year survival and 0.619 for 5-year survival) in Discovery set ( and 5g). These findings were also confirmed in Validation set (Supplementary Figure 8 c, 8d). Conclusively, high infiltration of sTIMs could be associated with less sensitive to ICB therapy, and in combination with FIGO stage and PD-L1 could be a reliable prognostic model in HGSOC.
Discussion
While immunotherapy is proven to be a promising treatment strategy for certain indications, the response rate is relatively limited in HGSOC and the variability in effectiveness is not completely clarified. Better understanding of TME composition is viewed as a worth exploring method to promote the benefit of immunotherapy of cancer and personalized treatment.Citation33 In our study, we identified the predictive value of sTIMs in prognosis and ICB response and explored the potential effect on TME.
Mast cells express various receptors, such as c-Kit (CD117), Toll-like receptors, IgE receptor, cytokine receptor, and chemokine receptors and interact with other cells by releasing mediators and/or direct contact.Citation19 Accumulation of mast cells in normal or pathological tissues depends on recruitment of mast cells and/or proliferation of tissue-resident mast cells and mast cells progenitors. Previous studies showed that TIMs can be recruited by tumor-derived stem cell factor (SCF), vascular endothelial growth factor (VEGF), angiopoietin 1 (Ang1), plasminogen activator inhibitor-1 (PAI-1), and chemokines (CCL2, CXCL1, CXCL8, CXCL10, and CXCL12) according to different tumor types.Citation34–37 However, there is no sufficient evidence pointing out that tumor cells could directly contribute to the proliferation of tissue-resident mast cells and mast cells progenitors.
Currently, several researches have shed light on the role of TIMs in modulating TME. TLR2-activated mast cells were able to hinder tumor growth via IL-6 mediated recruitment of NK and T cells,Citation23 while TIMs can also participate in the process of immune evasion via directly suppressing T cells and NK cells, promoting the expansion of Treg cells and myeloid-derived suppressor cells, and releasing a variety of immunomodulatory mediators (IL-10, TGF-β, histamine, and adenosine).Citation34,Citation38–40 In gastric cancer, tumor-derived TNF-α could induce mast cell expression of PD-L1 to suppress T cell immunity.Citation41 Our results are in line with this. Compared with peripheral mast cells, TIMs expressed more TGF-β and PD-L1. Another key finding of our study lies in that we dissected the potential mechanism of how TIMs interact with other immune cells. TIMs could promote macrophage proliferation and M2 polarization via TGF-β-TGF-βR axis and CSF1-CSF1R axis. In addition to PD-L1-PD-1 interaction, TIMs might suppress T cell immune by CLEC2B/C− KLRB1 axis.Citation42 Cell-cell contact results also suggested that TIMs could recruit Treg cells through CCL4-CCR5 axis.Citation43 These observations further support the idea that TIMs possess functional plasticity and exert pro- or anti-tumor effect on different types of malignancy; however, in HGSOC, TIMs tended to exhibit immunosuppressive and pro-tumor phenotype.
Besides mast cells, our previous study also found that tumor-associated neutrophils (TANs), recruited by CXCL8, linked to immune evasion microenvironment and unfavorable survival.Citation44 Likely, mast cells can release CXCL8 and be recruited and activated by CXCL8.Citation35,Citation45,Citation46 Our IHC and flow cytometry results also confirmed the association between sTIMs and TANs. Like TANs with a functional bias in N1 and N2 phenotypes, our study suggested that sTIMs have a unique phenotype and might be a potential subset of TIMs.
In addition to remodeling TME, mast cells may also regulate the therapy efficacy of tumors. In inflammatory breast cancer, TIMs were significantly correlated with poor response to neoadjuvant chemotherapy.Citation47 In pancreatic cancer, TIMs contributed to drug resistance of gemcitabine (GEM)/nabpaclitaxel (NAB) by activating the TGF-β signaling.Citation48 Recent research revealed that targeting mast cells could improve anti-PD-1 treatment, suggesting the critical role of TIMs in anti-PD-1 resistance.Citation18 In our study, the fraction of PD-L1+ cells and expression of immune checkpoint molecule (PD-1 and Tim-3) were expanding in sTIMs-low group. Furthermore, after being treated with anti-PD-1, organoids from sTIMs-low patients showed significantly increased proportions of GZMB+ CD8 T cells and IFN-γ+ CD8 T cells. This finding suggested that anti-PD-1 therapy tends to reinvigorate the dysfunctional CD8+ T cells in sTIMs-low patients. Thus, sTIMs enrichment could contribute to PD-1 blockade resistance and serves as a novel biomarker for ICB therapy even for combined blockade in HGSOC.
Existing prognostic models for patients with HGSOC are mainly based on FIGO staging system and identified gene signature expression.Citation49–51 However, patients with the same FIGO stage might have quite different clinical outcome and calculating score of gene signature is less convenient in clinical work. In this study, we identified sTIMs as an independent predictive marker for overall survival in HGSOC. Previous study revealed that PD-L1 level can also be an independent prognostic factor for HGSOC, which was validated in our result.Citation27 Therefore, a novel prognostic scoring model based on FIGO stage, sTIMs, and PD-L1 was developed, which provides more accurate prediction than only using FIGO stage and could stratify patients suitable for ICB therapy simultaneously.
There were also several limitations worth noting in our study. First, the cohort size in this retrospective study is relatively small. Second, the mechanism of mast cells exhibiting immunosuppressive and promoting-tumor phenotype in HGSOC remains to be further explored. Third, further researches are needed to clarify the mechanism that how mast cells influence immunotherapy in HGSOC. Fourth, large size and multi-center studies about HGSOC are required to further validate the role of mast cells in predicting response to ICB therapy.
To conclude, we reported that sTIMs were associated with dismal prognosis while iTIMs failed to be a prognosticator in HGSOC. Enrichment of sTIMs linked to immunosuppressive tumor microenvironment and impaired anti-tumor immune. The study not only provides a high-resolution depiction of characterization of TIMs, but also highlights the cross-talk between TIMs and immune cells may contribute to shaping the TME of HGSOC. Surprisingly, our findings suggested that sTIMs could serve as a novel biomarker for ICB therapy. Apart from these, the nomogram, combining FIGO stage, sTIMs, and PD-L1, possessed increased accuracy than conventional staging system. These findings might promote personalized treatment and accurate prognosis prediction for patients with HGSOC.
Author’ contributions
J.L. and L.H. performed study concept, design, and acquisition. L.H. provided study supervision and funding. H.L., K.C., and G.Z. performed development of methodology and writing. K.C. and G.Z. performed IHC experiments, bioinformatics analysis, and interpretation of data. Z.X., M.Y., Y.W., and M.H. provided technical and material support. All authors read and approved the final manuscript.
Data availability
The datasets used and/or analyzed during the current study are available from the corresponding author on reasonable request.
Supplemental Material
Download ()Acknowledgment
This work was supported by the Shanghai Key Laboratory of Female Reproductive Endocrine Related Diseases and the Obstetrics and Gynecology Hospital, Fudan University.
Disclosure statement
The authors report no conflict of interest.
Supplementary material
Supplemental data for this article can be accessed on the publisher’s website
Additional information
Funding
References
- Bowtell DD, Böhm S, Ahmed AA, Aspuria P-J, Bast RC, Beral V, Berek JS, Birrer MJ, Blagden S, Bookman MA, et al. Rethinking ovarian cancer II: reducing mortality from high-grade serous ovarian cancer. Nat Rev Cancer. 2015;15:668–12. doi:10.1038/nrc4019.
- Matulonis UA, Sood AK, Fallowfield L, Howitt BE, Sehouli J, Karlan BY. Ovarian cancer. Nat Revi Dis Primers. 2016;2:16061. doi:10.1038/nrdp.2016.61
- Wei SC, Duffy CR, Allison JP. Fundamental mechanisms of immune checkpoint blockade therapy. Cancer Discov. 2018;8(9):1069–1086. doi:10.1158/2159-8290.Cd-18-0367.
- Hellmann MD, Callahan MK, Awad MM, Calvo E, Ascierto PA, Atmaca A, Rizvi NA, Hirsch FR, Selvaggi G, Szustakowski JD, et al. Tumor mutational burden and efficacy of nivolumab monotherapy and in combination with ipilimumab in small-cell lung cancer. Cancer Cell. 2019;35(2):329. doi:10.1016/j.ccell.2019.01.011.
- Li P, Xiao J, Zhou B, Wei J, Luo J, Chen W. SYNE1 mutation may enhance the response to immune checkpoint blockade therapy in clear cell renal cell carcinoma patients. Aging (Albany N Y). 2020;12:19316–19324. doi:10.18632/aging.103781
- Hamanishi J, Mandai M, Ikeda T, Minami M, Kawaguchi A, Murayama T, Kanai M, Mori Y, Matsumoto S, Chikuma S, et al. Safety and antitumor activity of anti-PD-1 antibody, nivolumab, in patients with platinum-resistant ovarian cancer. J. Clin. Oncol. 2015;33:4015–4022. doi:10.1200/jco.2015.62.3397.
- Nishio S, Matsumoto K, Takehara K, Kawamura N, Hasegawa K, Takeshima N, Aoki D, Kamiura S, Arakawa A, Kondo E, et al. Pembrolizumab monotherapy in Japanese patients with advanced ovarian cancer: subgroup analysis from the KEYNOTE-100. Cancer Sci. 2020;111:1324–1332. doi:10.1111/cas.14340.
- Matulonis UA, Shapira-Frommer R, Santin AD, Lisyanskaya AS, Pignata S, Vergote I, Raspagliesi F, Sonke GS, Birrer M, Provencher DM, et al. Antitumor activity and safety of pembrolizumab in patients with advanced recurrent ovarian cancer: results from the phase II KEYNOTE-100 study. Ann. Oncol. 2019;30:1080–1087. doi:10.1093/annonc/mdz135.
- Zamarin D, Burger RA, Sill MW, Powell DJ, Lankes HA, Feldman MD, Zivanovic O, Gunderson C, Ko E, Mathews C, et al. Randomized phase II trial of nivolumab versus nivolumab and ipilimumab for recurrent or persistent ovarian cancer: an NRG oncology study. J. Clin. Oncol. 2020;38:1814–1823. doi:10.1200/jco.19.02059.
- Fridman WH, Zitvogel L, Sautès–Fridman C, Kroemer G. The immune contexture in cancer prognosis and treatment. Nat Rev Clin Oncol. 2017;14(12):717–734. doi:10.1038/nrclinonc.2017.101.
- Coffelt SB, de Visser KE. Immune-mediated mechanisms influencing the efficacy of anticancer therapies. Trends Immunol. 2015;36(4):198–216. doi:10.1016/j.it.2015.02.006.
- Havel JJ, Chowell D, Chan TA. The evolving landscape of biomarkers for checkpoint inhibitor immunotherapy. Nat Rev Cancer. 2019;19:133–150. doi:10.1038/s41568-019-0116-x.
- Tumeh PC, Harview CL, Yearley JH, Shintaku IP, Taylor EJM, Robert L, Chmielowski B, Spasic M, Henry G, Ciobanu V, et al. PD-1 blockade induces responses by inhibiting adaptive immune resistance. Nature. 2014;515(7528):568–571. doi:10.1038/nature13954.
- Sade-Feldman M, Yizhak K, Bjorgaard SL, Ray JP, De Boer CG, Jenkins RW, Lieb DJ, Chen JH, Frederick DT, Barzily-Rokni M, et al. Defining T cell states associated with response to checkpoint immunotherapy in melanoma. Cell. 2018;175(4):998–1013.e1020. doi:10.1016/j.cell.2018.10.038.
- Mlecnik B, Bindea G, Angell HK, Maby P, Angelova M, Tougeron D, Church SE, Lafontaine L, Fischer M, Fredriksen T, et al. Integrative Analyses of Colorectal Cancer Show Immunoscore Is a Stronger Predictor of Patient Survival Than Microsatellite Instability. Immunity. 2016;44(3):698–711. doi:10.1016/j.immuni.2016.02.025.
- Charoentong P, Finotello F, Angelova M, Mayer C, Efremova M, Rieder D, Hackl H, Trajanoski Z. Pan-cancer Immunogenomic Analyses Reveal Genotype-Immunophenotype Relationships and Predictors of Response to Checkpoint Blockade. Cell Rep. 2017;18(1):248–262. doi:10.1016/j.celrep.2016.12.019.
- Neubert NJ, Schmittnaegel M, Bordry N, Nassiri S, Wald N, Martignier C, Tillé L, Homicsko K, Damsky W, Maby-El Hajjami H, et al. T cell-induced CSF1 promotes melanoma resistance to PD1 blockade. Sci Transl Med. 2018;10. doi:10.1126/scitranslmed.aan3311.
- Somasundaram R, Connelly T, Choi R, Choi H, Samarkina A, Li L, Gregorio E, Chen Y, Thakur R, Abdel-Mohsen M, et al. Tumor-infiltrating mast cells are associated with resistance to anti-PD-1 therapy. Nat Commun. 2021;12(1):346. doi:10.1038/s41467-020-20600-7.
- Derakhshani A, Vahidian F, Alihasanzadeh M, Mokhtarzadeh A, Lotfi Nezhad P, Baradaran B. Mast cells: a double-edged sword in cancer. Immunol. Lett. 2019;209:28–35. doi:10.1016/j.imlet.2019.03.011.
- Mao Y, Feng Q, Zheng P, Yang L, Zhu D, Chang W, Ji M, He G, Xu J. Low tumor infiltrating mast cell density confers prognostic benefit and reflects immunoactivation in colorectal cancer. Int J Cancer. 2018;143:2271–2280. doi:10.1002/ijc.31613.
- Mehdawi L, Osman J, Topi G, Sjolander A. High tumor mast cell density is associated with longer survival of colon cancer patients. Acta Oncol. 2016;55(12):1434–1442. doi:10.1080/0284186X.2016.1198493.
- Ma Y, Hwang RF, Logsdon CD, Ullrich SE. Dynamic mast cell-stromal cell interactions promote growth of pancreatic cancer. Cancer Res. 2013;73:3927–3937. doi:10.1158/0008-5472.CAN-12-4479.
- Oldford SA, Haidl ID, Howatt MA, Leiva CA, Johnston B, Marshall JS. A critical role for mast cells and mast cell-derived IL-6 in TLR2-mediated inhibition of tumor growth. J. Immunol. 2010;185:7067–7076. doi:10.4049/jimmunol.1001137.
- Xiong Y, Liu L, Xia Y, Qi Y, Chen Y, Chen L, Zhang P, Kong Y, Qu Y, Wang Z, et al. Tumor infiltrating mast cells determine oncogenic HIF-2alpha-conferred immune evasion in clear cell renal cell carcinoma. Cancer Immunol. Immunother. 2019;68:731–741. doi:10.1007/s00262-019-02314-y.
- Chan JK, Magistris A, Loizzi V, Lin F, Rutgers J, Osann K, DiSaia PJ, Samoszuk M. Mast cell density, angiogenesis, blood clotting, and prognosis in women with advanced ovarian cancer. Gynecol. Oncol. 2005;99:20–25. doi:10.1016/j.ygyno.2005.05.042.
- Yang M, Lu J, Zhang G, Wang Y, He M, Xu Q, Xu C, Liu H. CXCL13 shapes immunoactive tumor microenvironment and enhances the efficacy of PD-1 checkpoint blockade in high-grade serous ovarian cancer. J Immunother Cancer. 2021;9(1):e001136. doi:10.1136/jitc-2020-001136.
- Webb JR, Milne K, Kroeger DR, Nelson BH. PD-L1 expression is associated with tumor-infiltrating T cells and favorable prognosis in high-grade serous ovarian cancer. Gynecol Oncol. 2016;141:293–302. doi:10.1016/j.ygyno.2016.03.008.
- Jin S, Guerrero-Juarez CF, Zhang L, Chang I, Ramos R, Kuan C-H, Myung P, Plikus MV, Nie Q. Inference and analysis of cell-cell communication using CellChat. Nat Commun. 2021;12(1):1088. doi:10.1038/s41467-021-21246-9.
- Wan C, Keany MP, Dong H, Al-Alem LF, Pandya UM, Lazo S, Boehnke K, Lynch KN, Xu R, Zarrella DT, et al. Enhanced efficacy of simultaneous PD-1 and PD-L1 immune checkpoint blockade in high grade serous ovarian cancer. Cancer Res. 2020. doi:10.1158/0008-5472.Can-20-1674.
- Tian X, Xu W, Wang Y, Anwaier A, Wang H, Wan F, Zhu Y, Cao D, Shi G, Zhu Y, et al. Identification of tumor-infiltrating immune cells and prognostic validation of tumor-infiltrating mast cells in adrenocortical carcinoma: results from bioinformatics and real-world data. Oncoimmunology. 2020;9(1):1784529. doi:10.1080/2162402x.2020.1784529.
- Newman AM, Liu CL, Green MR, Gentles AJ, Feng W, Xu Y, Hoang CD, Diehn M, Alizadeh AA. Robust enumeration of cell subsets from tissue expression profiles. Nat Methods. 2015;12(5):453–457. doi:10.1038/nmeth.3337.
- Gajewski TF, Schreiber H, Fu YX. Innate and adaptive immune cells in the tumor microenvironment. Nat Immunol. 2013;14:1014–1022. doi:10.1038/ni.2703.
- Hegde PS, Chen DS. Top 10 Challenges in Cancer Immunotherapy. Immunity. 2020;52(1):17–35. doi:10.1016/j.immuni.2019.12.011.
- Huang B, Lei Z, Zhang G-M, Li D, Song C, Li B, Liu Y, Yuan Y, Unkeless J, Xiong H, et al. SCF-mediated mast cell infiltration and activation exacerbate the inflammation and immunosuppression in tumor microenvironment. Blood. 2008;112(4):1269–1279. doi:10.1182/blood-2008-03-147033.
- Varricchi G, Galdiero MR, Loffredo S, Marone G, Iannone R, Marone G, Granata F. Are mast cells masters in cancer? Front Immunol. 2017;8:424. doi:10.3389/fimmu.2017.00424.
- Roy A, Coum A, Marinescu VD, Põlajeva J, Smits A, Nelander S, Uhrbom L, Westermark B, Forsberg-Nilsson K, Pontén F, et al. Glioma-derived plasminogen activator inhibitor-1 (PAI-1) regulates the recruitment of LRP1 positive mast cells. Oncotarget. 2015;6(27):23647–23661. doi:10.18632/oncotarget.4640.
- Põlajeva J, Sjösten AM, Lager N, Kastemar M, Waern I, Alafuzoff I, Smits A, Westermark B, Pejler G, Uhrbom L, et al. Mast cell accumulation in glioblastoma with a potential role for stem cell factor and chemokine CXCL12. PLoS One. 2011;6(9):e25222. doi:10.1371/journal.pone.0025222.
- Komi DEA, Redegeld FA. Role of mast cells in shaping the tumor microenvironment. Clin Rev Allergy Immunol. 2020;58:313–325. doi:10.1007/s12016-019-08753-w.
- Maltby S, Khazaie K, McNagny KM. Mast cells in tumor growth: angiogenesis, tissue remodelling and immune-modulation. Biochim Biophys Acta. 2009;1796:19–26. doi:10.1016/j.bbcan.2009.02.001.
- Danelli L, Frossi B, Gri G, Mion F, Guarnotta C, Bongiovanni L, Tripodo C, Mariuzzi L, Marzinotto S, Rigoni A, et al. Mast cells boost myeloid-derived suppressor cell activity and contribute to the development of tumor-favoring microenvironment. Cancer Immunol Res. 2015;3(1):85–95. doi:10.1158/2326-6066.Cir-14-0102.
- Lv Y, Zhao Y, Wang X, Chen N, Mao F, Teng Y, Wang T, Peng L, Zhang J, Cheng P, et al. Increased intratumoral mast cells foster immune suppression and gastric cancer progression through TNF-α-PD-L1 pathway. J Immunother Cancer. 2019;7(1):54. doi:10.1186/s40425-019-0530-3.
- Mathewson ND, Ashenberg O, Tirosh I, Gritsch S, Perez EM, Marx S, Jerby-Arnon L, Chanoch-Myers R, Hara T, Richman AR, et al. Inhibitory CD161 receptor identified in glioma-infiltrating T cells by single-cell analysis. Cell. 2021;184(5):1281–1298 e1226. doi:10.1016/j.cell.2021.01.022.
- Fujimoto H, Saito Y, Ohuchida K, Kawakami E, Fujiki S, Watanabe T, Ono R, Kaneko A, Takagi S, Najima Y, et al. Deregulated mucosal immune surveillance through gut-associated regulatory T cells and PD-1+ T cells in human colorectal cancer. J. Immunol. 2018;200:3291–3303. doi:10.4049/jimmunol.1701222.
- Yang M, Zhang G, Wang Y, He M, Xu Q, Lu J, Liu H, Xu C. Tumour-associated neutrophils orchestrate intratumoural IL-8-driven immune evasion through Jagged2 activation in ovarian cancer. Br J Cancer. 2020;123:1404–1416. doi:10.1038/s41416-020-1026-0.
- Sammarco G, Varricchi G, Ferraro V, Ammendola M, De Fazio M, Altomare DF, Luposella M, Maltese L, Currò G, Marone G, et al. Mast cells, angiogenesis and lymphangiogenesis in human gastric cancer. Int J Mol Sci. 2019;20. doi:10.3390/ijms20092106.
- Visciano C, Liotti F, Prevete N, Cali’ G, Franco R, Collina F, de Paulis A, Marone G, Santoro M, Melillo RM, et al. Mast cells induce epithelial-to-mesenchymal transition and stem cell features in human thyroid cancer cells through an IL-8-Akt-Slug pathway. Oncogene. 2015;34:5175–5186. doi:10.1038/onc.2014.441.
- Reddy SM, Reuben A, Barua S, Jiang H, Zhang S, Wang L, Gopalakrishnan V, Hudgens CW, Tetzlaff MT, Reuben JM, et al. Poor response to neoadjuvant chemotherapy correlates with mast cell infiltration in inflammatory breast cancer. Cancer Immunol Res. 2019;7(6):1025–1035. doi:10.1158/2326-6066.Cir-18-0619.
- Porcelli L, Iacobazzi R, Di Fonte R, Serratì S, Intini A, Solimando A, Brunetti O, Calabrese A, Leonetti F, Azzariti A, et al. CAFs and TGF-β signaling activation by mast cells contribute to resistance to gemcitabine/nabpaclitaxel in pancreatic cancer. Cancers (Basel). 2019;11(3):330. doi:10.3390/cancers11030330.
- Millstein J, Budden T, Goode EL, Anglesio MS, Talhouk A, Intermaggio MP, Leong HS, Chen S, Elatre W, Gilks B, et al. Prognostic gene expression signature for high-grade serous ovarian cancer. Ann. Oncol. 2020;31:1240–1250. doi:10.1016/j.annonc.2020.05.019.
- Jones WD, Michener CM, Biscotti C, Braicu I, Sehouli J, Ganapathi MK, Ganapathi RN. RNA immune signatures from pan-cancer analysis are prognostic for high-grade serous ovarian cancer and other female cancers. Cancers (Basel). 2020;12(3):620. doi:10.3390/cancers12030620.
- Kim SI, Jung M, Dan K, Lee S, Lee C, Kim HS, Chung HH, Kim JW, Park NH, Song YS, et al. Proteomic discovery of biomarkers to predict prognosis of high-grade serous ovarian carcinoma. Cancers (Basel). 2020;12. doi:10.3390/cancers12040790