
ABSTRACT
Targeted and immunotherapy regimens have revolutionized the treatment of advanced melanoma patients. Despite this, only a subset of patients respond durably. Recently, combination strategies of BRAF/MEK inhibitors with immune checkpoint inhibitor monotherapy (α-CTLA-4 or α-PD-1) have increased the rate of durable responses. Based on evidence from our group and others, these therapies appear synergistic, but at the cost of significant toxicity. We know from other treatment paradigms (e.g. hematologic malignancies) that combination strategies with multi-drug regimens (>4 drugs) are associated with more durable disease control. To better understand the mechanism of these improved outcomes, and to identify and prioritize new strategies for testing, we studied several multi-drug regimens combining BRAF/MEK targeted therapy and immunotherapy combinations in a Braf-mutant murine melanoma model (BrafV600E/Pten−/−). Short-term treatment with α-PD-1 and α-CTLA-4 monotherapies were relatively ineffective, while treatment with α-OX40 demonstrated some efficacy [17% of mice with no evidence of disease, (NED), at 60-days]. Outcomes were improved in the combined α-OX40/α-PD-1 group (42% NED). Short-term treatment with quadruplet therapy of immunotherapy doublets in combination with targeted therapy [dabrafenib and trametinib (DT)] was associated with excellent tumor control, with 100% of mice having NED after combined DT/α-CTLA-4/α-PD-1 or DT/α-OX40/α-PD-1. Notably, tumors from mice in these groups demonstrated a high proportion of effector memory T cells, and immunologic memory was maintained with tumor re-challenge. Together, these data provide important evidence regarding the potential utility of multi-drug therapy in treating advanced melanoma and suggest these models can be used to guide and prioritize combinatorial treatment strategies.
Introduction
Immune checkpoint inhibitors specific to CTLA-4 (e.g.: ipilimumab) or PD-1 (e.g.: nivolumab, pembrolizumab) can induce long-term disease responses in melanoma.Citation1–3 In a large phase 3 clinical trial of patients with unresectable stage III or stage IV melanoma, ipilimumab and nivolumab produced durable responses in the majority of patients who achieved an objective radiologic response, leading to 5-year overall survival (OS) of 26% and 44% as single agents, respectively.Citation4 In addition to improved survival rates, treatment with nivolumab resulted in fewer grade III/IV adverse events compared to ipilimumab (22% vs 28%). Combining anti-CTLA-4 and anti-PD-1 treatments has worked well in murine models and demonstrated clinical utility in the CheckMate 067 trial.Citation5,Citation6 While initial objective response rates in the combination group were numerically superior to single agent therapy (58% vs 45% vs 19%, respectively), five-year overall survival was only marginally improved compared to nivolumab alone (52% vs 44%).Citation4 This marginally improved survival was at the expense of increased grade III/IV toxicities (59% vs 22%).Citation4,Citation6 Thus, despite the progress these results represent, there remains a strong rationale and need to identify additional combination treatment regimens that can achieve durable responses, particularly for patients with features that are associated with lower responsiveness to immunotherapy (i.e. low tumor mutation burden). This task becomes increasingly difficult as the number of treatments for advanced melanoma increases, dose reduction strategies are explored, and the number of combinatorial strategies increases. Here we demonstrate the ability of pre-clinical models to act as guideposts to guide and prioritize current and future combinatorial treatment regimens.
The prospect of combining MAP-kinase inhibition with immune checkpoint blockade has been explored by our group and others in both preclinical and clinical settings.Citation1–3,Citation7,Citation8 In melanoma, MAP-kinase pathway inhibition not only inhibits tumor cell proliferation and improves survival, but also aids the anti-tumor immune response through various mechanisms. This includes: inhibition of JNK and p38 leading to downregulation of the immunosuppressive cytokine IL-10 in human monocytes;Citation9 increased antigen expression and presentation;Citation10,Citation11 neutralization of myeloid-derived suppressor cells (MDSCs);Citation12 decrease in Tregs;Citation13,Citation14 and ultimately increased intra-tumoral T cell infiltration and cytotoxicity.Citation15,Citation16 Accordingly, combined MAP-kinase inhibition with single agent anti-PD-1 or adoptive cell therapy improves therapeutic success in in vivo pre-clinical models.Citation17–19 Although randomized clinical trials combining MAP-kinase inhibitors with anti-PD-(L)1 in untreated, advanced melanoma patients have reported mixed results, the arms containing triplet therapy induced high objective response rates (63%-78%). This did not universally result in reaching pre-specified improvements in progression free survival (PFS) endpoints. In the case of IMspire150, the addition of atezolizumab to targeted therapy (vemurafenib and cobimetinib) improved median progression free survival in BRAF mutated unresectable melanoma from 10.6 to 15.1 months and led to the FDA approval of this regimen.Citation7 Notably, these trials were conducted in the untreated stage IV melanoma setting. A critical need remains in identifying therapeutic strategies in patients with both primary and secondary resistance to anti-PD1 therapy.
The clinical success of targeting CTLA-4 and PD-1 has driven the development and testing of agonist antibodies targeting co-stimulatory receptors to enhance anti-tumor T cell activity. OX40 is a member of the TNFR superfamily of T cell co-receptors and promotes survival and effector functions of CD4+ and CD8 + T cells.Citation20 Agonist antibodies targeting OX40 have demonstrated efficacy in a range of tumor models and are currently in clinical trials as single agents, and in combination with immune checkpoint inhibitors.Citation21 Thus, it is an intriguing candidate for combinatorial treatment strategies.
While combination therapies of immune checkpoint blockade agents are associated with increased immune-related adverse events compared to either single agent therapy, analyses of randomized trials showed that patients who discontinued therapy due to toxicity received similar long-term benefits as those without toxicity who received more prolonged treatment.Citation6 This suggests that even short-term combination treatment may be beneficial, particularly for those patients who are resistant to current therapies. We therefore studied combinations of immune checkpoint blockade (anti-PD-1, anti-CTLA-4) and an OX40 agonist, with and without concurrent BRAF and MEK inhibitor targeted therapy, to evaluate the ability of short-term treatments to achieve long-term disease control and immune memory. We also performed molecular and immune profiling to characterize the tumor-immune microenvironment during therapy. In order to maximize clinical relevance, we used a BrafV600E Pten−/− (BP) murine melanoma model, as it recapitulates genetic phenotypes (i.e.: PTEN loss, low overall mutation burden) associated with poor outcomes with current immunotherapies.Citation22,Citation23 We anticipate these murine models will prove useful in identifying optimal combinatorial strategies in overcoming resistance to immune checkpoint blockade while also aiding in the development of more personalized selection of combination therapy. This will become increasingly important as new agents continue to be developed.
Results
Combination α-PD-1/α-OX40 immunotherapy results in durable responses in BrafV600E/Pten−/− (BP) melanoma models
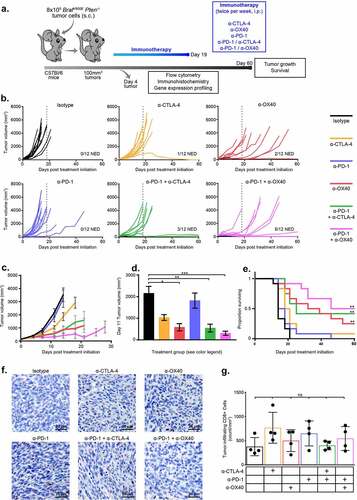
To evaluate the efficacy of checkpoint modulators alone or in combination, we treated BP tumor-bearing, syngeneic mice twice weekly by intraperitoneal (ip) injection for 19 days with single-agent α-CTLA-4, α-PD-1, α-OX40 or isotype IgG control, or with the immunotherapy combinations α-CTLA-4/α-PD-1 or α-OX40/α-PD-1 ()). When measured at the time that vehicle-treated tumors first reached the maximum allowable size (D11 post initial treatment, minimum tumor size 100 g), significantly reduced tumor volumes were observed in animals treated with α-CTLA-4 and α-OX40 but not with α-PD-1 (p = .011, <0.0001, 0.90 respectively) (). α-OX40 significantly improved survival (median OS 35.5 days) versus isotype control treatment (median OS 14 days), but α-CTLA-4 (median OS 19.5 days) and α-PD-1 (median OS 16 days) did not (p = .0015, 0.29, 1, respectively) ()). All mice (11/12) in the α-CTLA-4 and α-PD-1 treatment groups had measurable tumor 60 days after commencing therapy compared with 10/12 (83%) following α-OX40 treatment. Combination immunotherapy with α-CTLA-4/α-PD-1 and α-PD-1/α-OX40 showed greater tumor control, with significantly reduced tumor volumes at D11 versus isotype control (p = <0.0001 for both groups) and improved survival (median 25 days and 53 days, respectively; p < .0015 for both) ()). Combination immunotherapy treated groups also had more tumor-free mice at day 60, with 3/12 (25%) in the α-CTLA-4/α-PD-1 group and 5/12 (42%) in the α-PD-1/α-OX40 group (). These findings were demonstrated in mice treated with the same treatment regimen after allowing for greater tumor sizes prior to first treatment (200 g minimum tumor size, Supplementary Figure S1a, 500 g minimum tumor size, Supplementary Figure S1b)
Figure 1. Combination immunotherapies are superior to single agents when dosed concurrently. C57BL/6 mice with BP tumors were treated with 6 doses of anti-CTLA-4, anti-OX40, anti-PD-1 or combinations including anti-PD-1 and either anti-CTLA-4 or anti-OX40. a. Schematic of study design. b. Individual tumor growth curves from start of therapy (D0) to D60 for each treatment group after tumors were allowed to reach 100 g in size. c. Mean tumor growth curves for each treatment group until the first death in each group. d. Mean tumor volume at D11, the day of the first death in the Isotype treated group. e. Kaplan-Meier survival analysis of each treatment group until D60 post initiation of therapy. f. Representative CD8 IHC images from each treatment group at D4 on therapy (after 2 doses of antibodies). G. CD8 IHC summary data at D4. * = p < .05, ** = p < .005, *** = p < .0005
Improved response to combination immunotherapy is associated with distinct gene expression profiles
To investigate the mechanisms associated with improved response to combination checkpoint immunotherapy, we performed immunohistochemistry (IHC) to quantify CD3+ and CD8+ infiltrates in early on-treatment tumor samples. Though we observed modest increases in CD3+ and CD8+ infiltrates in individual tumors (mean number of CD3+/CD8+ cells were 578/378 per mm2 in vehicle treated tumors vs 1019/547 in α-PD-1/α-OX40 treated tumors), this difference was not statistically significant compared to mice treated with isotype antibody control alone (, Supplementary Figure S2). To identify phenotypic or functional differences in the immune infiltrates, we performed flow cytometry for markers of cytotoxicity and memory cell differentiation. No differences were observed in the frequency of interferon-γ (IFN-γ) and tumor necrosis factor alpha (TNF-α) positive CD8+ cells, while the frequency of CD8+ effector memory cells (CD62L-CD44+) decreased, and CD8+ effector cells (CD62L-CD44-) increased, in groups that received either α-CTLA-4 alone or in combination with α-PD-1 (), Supplementary Figure S2).
Figure 2. Different immune therapies illicit distinct transcriptomic profiles. RNA isolated from bulk tumor at D4 was analyzed with NanoString pan-cancer immune kit and sequenced by Affymetrix. a. NanoString undirected global significance scores from each treatment group representing variation in gene expression across gene sets vs isotype treated tumors. b. Directed NanoString global significance scores representing a net positive or negative direction to the overall variation in gene expression in a geneset. Gene sets cluster into that differentiate combination immunotherapies are labeled 1–3: Cluster 1 includes gene sets with positive directed global significance scores in both combinations. Cluster 2 includes gene sets with negative scores in both combinations. Cluster 3 includes gene sets with positive scores in α-CTLA-4/α-PD-1 and negative in α-PD-1/α-OX40 treated tumors c. Leading edge metagene analysis from Affymetrix representing gene sets represented by the metagenes associated with combination therapy vs isotype treated tumors. d. Summary flow cytometry analysis of tumor infiltrating CD8 T cell memory subsets
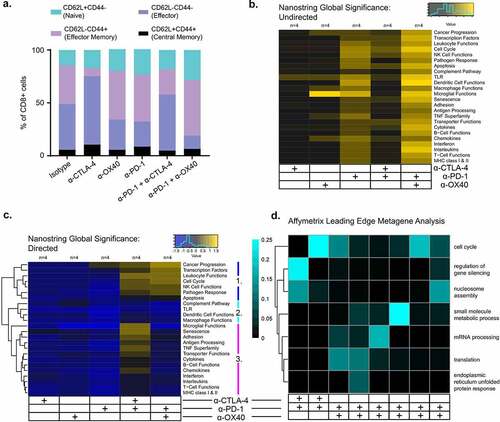
We next profiled RNA isolated on day 10 for expression of 770 tumor- and immune-related genes. Though no genes were significantly differentially expressed between any of the immunotherapy treatment groups after multiple-comparison adjustment (Supplementary Figure S3), analysis of immune gene sets, defined in the NanoString nCounter® PanCancer immune panel, showed distinct gene expression profiles associated with different treatment groups (). Overall, a combination of total variation in gene expression and directionality of gene expression characterizes each treatment group. Specifically, total variation of gene expression, measured by undirected global significance scores for each gene set, were broadly highest amongst α-PD-1 and α-PD-1/α-OX40 treated tumors. Directed global significance scores, a measure of the net direction of variation in a gene set, clearly separated the single agent – from the combination-treated tumors, with negative global significance scores indicative of gene set downregulation in almost every gene set in monotherapy tumors. The combination-treated tumors also had distinct patterns of directed global significance scores, with three clusters of gene sets defined by positive directed global significance scores in both combinations (cluster 1: Cancer Progression, Transcription Factors, Leukocyte Functions, Cell Cycle, NK Cell Functions, Pathogen Response, Apoptosis), negative in both combinations (cluster 2: Complement Pathway, TLR, Dendritic Cell Functions, Macrophage Functions) or positive in α-CTLA-4/α-PD-1 and negative in α-PD-1/α-OX40 treated tumors (cluster 3: Microglial Functions, Senescence, Adhesion, Antigen Processing, TNF Superfamily, Transporter Functions, Cytokines, B Cell Functions, Chemokines, Interferon, Interleukins, T Cell Functions, MHC class I & II) ()). Finally, to address potential systems-level coordinate gene regulation of functional relevance to immunotherapy response, we performed transcriptomic analysis of whole tumor lysates using the Affymetrix ClariomTM D pico assay, focusing on the effects of combination checkpoint immunotherapies (i.e., α-CTLA-4/α-PD-1 and α-OX40/α-PD-1). Leading edge metagene analysis, which can identify co-regulated groups of genes (“metagenes”), revealed 8 distinct metagenes for combination checkpoint immunotherapies compared to isotype controls ()). Gene ontology analysis of these metagenes identified distinct molecular profiles of the various immunotherapy combinations. Differences in cell cycle and nucleosome assembly genes were shared by both immunotherapy combinations compared to control treatment. The α-CTLA-4/α-PD-1 treatment also significantly altered genes involved in the regulation of gene silencing. Moreover, α-OX40/α-PD-1 treatment significantly affected genes involved in small molecule metabolic processes, mRNA processing, translation and endoplasmic reticulum unfolded protein response ()).
Combination targeted therapy and immune checkpoint blockade eradicates BP melanoma tumors and provides effective anti-tumor immunological memory
We next evaluated the impact of combining short-term BRAF and MEK inhibitor (dabrafenib and trametinib, respectively; “DT”) treatment with the same immunotherapies. DT was administered daily for 19 days and then stopped. DT alone was effective in controlling tumor growth with 12/12 (100%) mice with NED after 19 days of treatment. However, only 4/12 (33%) of mice remained tumor-free by day 60 ()). In contrast, 10/12 (83%) mice achieved sustained (>60 days) NED when treated for 19 days with either DT/α-CTLA-4 or DT/α-PD-1 (). Quadruple combinations of DT with α-CTLA-4/α-PD-1 or α-PD-1/α-OX40 demonstrated complete cures at day 60 in all mice (12/12, 100% NED in each group), without any incidence of toxicity (). DT treatment was tested again among mice with larger tumor sizes prior to initiation of therapy (200 g minimum, Supplementary Figure S4a and 500 g, Supplementary Figure S4b). DT again was shown to be effective at limiting tumor growth and combination therapy, particularly quadruple therapy with combinations of DT with α-CTLA-4/α-PD-1 or α-PD-1/α-OX40 demonstrated longer disease free survival, although less pronounced in mice with large tumors.
Figure 3. DT treatment dramatically improves the efficacy of immunotherapies when dosed concurrently. C57BL/6 mice with BP tumors were treated for 19 Days with DT in addition to 6 doses of anti-CTLA-4, anti-OX40, anti-PD-1 or combinations including anti-PD-1 and either anti-CTLA-4 or anti-OX40. a. Individual tumor growth curves from start of therapy (D0) to D60 for each treatment group. b. Mean tumor growth curves for each treatment group until the first death in each group. c. Kaplan-Meier survival analysis of each treatment group until D60 post initiation of therapy. d. Representative CD8 IHC images from each treatment group at D4 on therapy (after 2 doses of antibodies). e. CD8 IHC summary data at D4. f. Summary flow cytometry analysis of tumor infiltrating CD8 T cell cytokine expression. g. Summary flow cytometry analysis of tumor infiltrating CD8 T cell memory subsets. * = p < .05, ** = p < .005
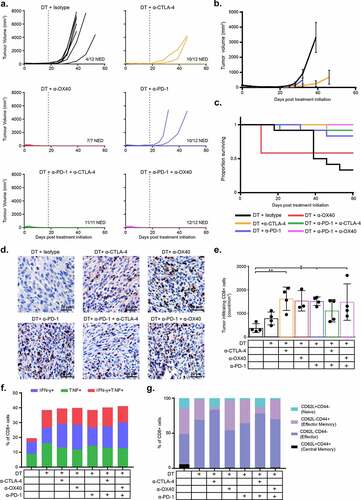
In mice treated with DT/α-OX40, 5/12 mice were found dead on the morning after the third dose of α-OX40 (D10); the remaining 7/12 mice completed therapy with no incident and achieved sustained NED. To investigate the toxicological profile of this combination we performed a comprehensive pathological analysis of tumor-bearing mice after 10 days of therapy. We performed a full necropsy on mice receiving the DT/α-PD-1/α-OX40 quadruple therapy, as well as mice receiving DT, DT/α-PD-1, DT/α-OX40 and isotype controls. We analyzed 9 organs per animal (brain, lung, liver, kidney, intestine, bone marrow, heart, spleen and tumor) and found no significant alterations indicative of toxicity. We also analyzed serum cytokine levels with the BioLegend LEGENDplex inflammatory panel and observed significantly elevated serum IL-6 levels in the DT/α-OX40 mice compared to isotype control (454 vs 26 pg/ml, respectively; p = .015). Interestingly, while IL-6 levels were elevated in the quadruple DT/α-PD-1/α-OX40 treated mice, the magnitude was lower than in the triplet DT/α-OX40 treated mice and did not reach statistical significance (222 pg/ml; p = .44) (Supplementary Figure S5).
Mice with NED at day 60 after initial therapy were re-challenged with BP tumors. No tumor growth was observed, regardless of which prior therapy they received, suggesting the development of effective anti-tumor immunological memory (Supplementary Figure S6).
Improved response to combination targeted- and immunotherapy is associated with increased immune and antigen presenting function
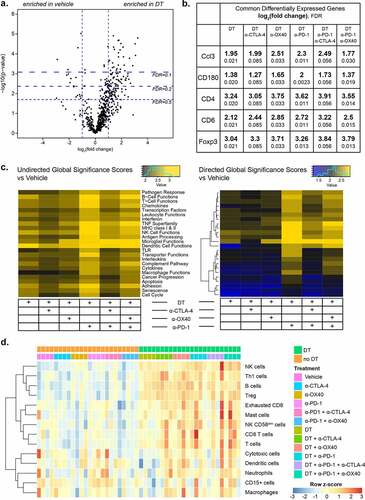
To study the mechanisms associated with response to combined targeted and immune therapy, we first performed immunohistochemistry for CD3 and CD8. While the density of CD8+ cells increased upon DT treatment alone (mean 790 vs 378 CD8+ cells/mm2), this was not statistically significant (p = .62) compared with vehicle treatment. When DT was combined with α-CTLA-4, α-OX40, α-PD-1 or the α-PD-1/α-OX40 combination, the magnitude of CD8+ infiltration was increased and statistically significant versus vehicle treated tumors (p = .0041, 0.014, 0.0086, 0.011, respectively) (). Additional characterization of CD8 + T cells by flow cytometry showed increased production of cytokines with DT, with approximately 40% of CD8 + T cells expressing IFN-γ, TNF-α, or both in all six DT treated groups, in contrast with only 20% in the absence of DT ()). CD8 + T cells also showed decreased expression of LAG-3, and TIM-3, suggesting a less dysfunctional phenotype in the presence of DT (Supplementary Figure S7). Furthermore, a shift in the frequency of CD8+ CD44-CD62L+ and CD8+ CD44+ CD62L+ naive and central memory cells toward CD8+ CD44-CD62L- effector cells was detected in the presence of DT, suggesting a change in phenotype and function caused by this combination regimen that was not observed in the presence of immunotherapy alone ()). Gene expression analysis on bulk tumor using the NanoString PanCancer immune profiling panel revealed 38 differentially expressed genes in DT treated tumors compared to vehicle control. Of these, Ccl3, CD180, CD4, CD6 and Foxp3 were overexpressed in every DT combination (). NanoString gene set analysis also demonstrated substantial increases in diverse modules of immune-related functions across all DT-containing treatment groups. This general enrichment of immune-related genes was noted to parallel the density of immune infiltrates by IHC ()), showing numerically lower scores for the DT alone and DT/α-CTLA-4/α-PD-1 groups relative to the other combinations ()). Finally, we analyzed Affymetrix transcriptomic data using CIBERSORT to estimate tumor-infiltrating immune cell populations. We identified an increase in the transcriptomic signatures of B cells, NK cells, Th1 cells, Tregs and T cells in all treatment groups that included DT ()).Citation24
Figure 4. DT transforms the tumor-immune microenvironment to a more favorable, inflamed phenotype. a. Volcano plot of differentially expressed genes measured by NanoString in DT vs vehicle treated tumors. b. Commonly differentially expressed genes shared by all treatment groups that incorporate DT vs vehicle treated tumors. c. NanoString undirected global significance scores (left) from each treatment group representing variation in gene expression across gene sets vs isotype treated tumors, and directed NanoString global significance scores (right) representing a net positive or negative direction to the overall variation in gene expression in a geneset. d. CIBERSORT analysis of Affymetrix data from all treatment groups, showing the prevalence of gene signatures from a large set of immune cell types
Discussion
In these studies, we evaluated short-term treatment with checkpoint therapies alone and in combination with BRAF/MEK inhibitors in an anti-PD-1-resistant, BRAF-mutant, PTEN-null murine melanoma model (BP). This work demonstrates the ability to identify multi-agent therapies capable of achieving long-term disease control and effective immune memory. Notably, the BP melanoma model utilized in these studies is characterized by genetic features (low total mutation burden, loss of PTEN) associated with frequent primary resistance to checkpoint inhibitors in metastatic melanoma patients, as the development of effective treatments for such patients remains a critical unmet need.Citation22,Citation23 While these specific findings apply to a subset of BRAF mutated melanoma patients, in whom targeted therapies exist, the results of these experiments provide new strategies to consider for prioritization for clinical testing in the rapidly evolving therapeutic landscape in this disease. Specifically these support the rationale for evaluation of 4-drug combinations in those patients with refractory disease or potentially as up-front therapy in those with poor prognostic markers associated with primary resistance.
We observed superior efficacy of combined immune checkpoint blockade (α-PD-1/α-CTLA-4 and α-PD-1/α-OX40) over single-agent immunotherapy, with α-OX40/α-PD-1 demonstrating the high rates of durable tumor control. The addition of dabrafenib and trametinib (DT) to immunotherapy improved tumor control in all groups as compared to DT alone or various immune regiments alone; with 100% of mice having NED after combined DT/α-CTLA-4/α-PD-1 or DT/α-OX40/α-PD-1. This high response rate is important, as short-term treatments that result in long-term NED with combination targeted therapy and checkpoint blockade may result in meaningful clinical benefit and deepen the anti-tumor response. Similar observations have been made in the long-term follow-up to the Keynote-022 trial. While this trial failed to show a statistically significant improvement in PFS at its primary endpoint of 12 months there was significantly improved PFS at 24 months.Citation25 Even regimens with moderate or high rates of adverse events could therefore be clinically valuable, particularly for patients with primary or secondary resistance to currently approved immunotherapies. Beyond this, dose reduction strategies have been shown to potentially reduce adverse effects while maintaining efficacy.Citation26 Once clinical corollaries and markers have been defined these models can be utilized for pre-clinical optimization of therapies.
Intriguingly, the efficacy of the evaluated immunotherapies without concurrent DT did not appear to be dependent on a large expansion or recruitment of T cells in the tumor microenvironment. Instead, we identified pathway level gene expression differences in a range of immune ontologies between treatment groups, indicating that each therapy had a particular impact on the broader tumor-immune microenvironment that may underlie the observed differences in response. These findings can be reconciled with our understanding that expression of each immune checkpoint molecule varies across immune subsets in the tumor microenvironment, and that ligation of each molecule results in activation or inhibition of different cell types by different mechanisms.Citation18,Citation27 Recent work has demonstrated the importance of the interplay of a variety of immune cell types and the interplay of both T and B cells via tertiary lymphoid structures in driving anti-tumor activity enhanced by checkpoint blockade.Citation28,Citation29 The enhancement of immune infiltrates across immune cell types speaks to the complexity of these interactions. Additionally, the timing of therapeutic engagement of inhibitory or activating immune checkpoints within a dynamic tumor microenvironment may be relevant to the resulting immune fate. Interestingly, both α-PD-1/α-CTLA-4 and α-PD-1/α-OX40 combinations demonstrated increased leukocyte and NK cell gene expression, and the combination of α-CTLA-4/α-PD-1 demonstrated increased cytokine and B cell gene expression, which may have contributed to their respectively enhanced efficacy. Recent studies have shown sequential treatment may be preferable over concomitant treatment in the case of α-OX40 and α-PD-1 agents, due to competing pharmacodynamic effects of the distinct immune checkpoint agents.Citation30,Citation31 However, we did not observe any attenuation of α-OX40 efficacy when combined with concurrent α-PD-1 in our model. Differences in mouse strain and gender, number of cells injected, tumor types and cell lines, as well as treatment schedules, injection sites and clones may all contribute to the diversity of outcomes reported.
We observed improvement in outcomes for all immunotherapies regimens with the addition of DT. While we observed almost complete tumor regression in most mice treated with BRAF and MEK targeted therapy alone, this was only a temporary effect and residual tumor was able to grow out after targeted therapy ceased. Similar to what has been described in previous studies, BRAF and MEK inhibitors increased the expression of several inflammatory markers including CD8 + T cell infiltration and markers of CD8 + T cell activation and memory T cell formation, as well as increased expression of immune related transcripts by NanoString analysis.Citation17–19,Citation32 The impact of combining targeted and immune checkpoint blockade in this model proved marked, with both quadruple combination regimens rendering all mice disease-free and resistant to tumor re-challenge. A previous study demonstrated improved efficacy of adoptive cell therapy in a murine melanoma model when combined with BRAF and MEK inhibition, associated with diverse favorable immunomodulatory effects, including PD-L1 upregulation that also conferred improved responses to combined targeted and anti-PD-1 therapy.Citation18 The superiority of DT-containing regimens we observed may be consequent to multiple factors: 1) increased magnitude of CD8+ infiltration; 2) decrease in CD8 + T cell exhaustion, as evidenced by decreased expression of PD-1, LAG-3, and TIM-3; 3) a shift in the frequency of naive and central memory CD8 + T cells toward an effector cell phenotype, suggesting a functional effect of the DT-containing combination regimens that was not observed in the presence of immunotherapy alone; 4) increase in transcriptomic signatures of B cells, NK cells, Th1 cells, Tregs and T cells in all treatment group that included DT, indicating a broadening of immune cell population content that may have further contributed to synergy of DT with immunotherapies; 5) rapid reduction in tumor size, given associations between improved outcomes with smaller tumors in immunotherapy treatment.Citation33
With the accumulation of approved treatments for melanoma patients, combination strategies have proven to be the most clinically effective. Combined CTLA-4 and PD-1 checkpoint blockade has increased objective response rates and PFS compared to either monotherapy, likely due to their non-redundant roles in naïve T cell priming and effector T cell function.Citation34,Citation35 In vivo studies of agonist antibodies specific for the immune co-stimulatory molecule OX40 have demonstrated anti-tumor activity and agents targeting OX40 are currently being studied in several ongoing (e.g.: NCT03092856, NCT03336606, NCT02528357, NCT03447314) or recently completed clinical trials (e.g.: NCT01644968, NCT01303705, NCT02318394). However, results from certain trials have raised issues concerning the toxicity of OX40 agonists. For instance, a clinical trial involving the OX40 agonist MEDI6469 (NCT02205333: A Phase 1b/2 Safety and Tolerability Study of MEDI6469 in Combination with Therapeutic Immune Agents or Monoclonal Antibodies) was terminated early because of fatal outcomes reported in multiple arms of the study. This is a danger reflected by the deaths in our DT/α-OX40 treated mice and the large concentrations of serum IL-6 we detected. However, the DT/α-PD-1/α-OX40 treated mice did not suffer the same toxicity, suggesting that if this effect is indeed treatment-related, it may be context dependent and potentially avoidable. Furthermore, the large variation in serum IL-6 levels in treated mice suggests that individuals susceptible to severe toxicity may be identified serologically and treatment discontinued before adverse events present clinically or could potentially be managed with anti-IL-6 antibodies.Citation36 Therefore, the combination of DT with α-PD-1/α-CTLA-4 agents may be preferred for future clinical development, although different OX40 agents and different scheduling under current evaluation may prove to be less toxic.
Our data supports the continued development and refinement of multi-modality combinations for the treatment of melanoma but is not without multiple limitations. First, our murine experiments were conducted with only one dosing regimen rather than comparing concomitant versus sequential injections. The sequence of treatment, particularly with radiotherapy, has been shown to significantly impact antitumor activity across multiple cancer types, including breast,Citation37 renal cell carcinoma,Citation38 prostateCitation39 and malignant brain tumors (atypical teratoid rhabdoid and glioblastoma).Citation40 Given the complexity of the four-drug regimen, we felt additional experiments on dosing would further complicate our study findings and optimal timing of treatment is an area of active investigation of our group. Second, all our studies were completed in C57BL/6 mice with BP tumors which may not completely recapitulate the tumor heterogeneity commonly seen in patients. Despite this, we feel our mouse model is accurate enough to provide a foundation for investigating a 4-drug treatment combination. Further work evaluating 4-drug treatment combinations in pre-clinical models is warranted including the evaluation of multiple dosing schedules among multiple different mouse models. Our findings do provide a rationale for the clinical evaluation of 4-drug combination regimens in high risk patients, potentially for only a short period of time or perhaps with planned treatment cessation once a maximal therapeutic response (i.e.: tumor burden nadir) has been achieved. Our results exemplify the ability of pre-clinical models to select and prioritize combinatorial therapies before they are brought into the clinical setting. Finally, careful evaluation of the specific immune cell subpopulations influenced by each immune checkpoint agent, and their temporal dynamics, will be critical to guiding the selection of optimal combinations and dosing schedules, whilst minimizing potential toxicity.
Methods
Cell lines
BP cells (BrafV600E/Pten−/−) derived from Tyr-Cre(ER)T2, BrafCA, and Ptenlox/lox mice were used for this study as previously described.Citation17 Cells were cultured at 37°C, 5%CO2 in DMEM supplemented with 10% FBS and 1% penicillin/streptomycin.
Mice
C57BL/6 mice were purchased from Jackson Laboratories (Bar Harbor, ME). Mice were injected subcutaneously with 8 × 10⁵ BP cells suspended in 200 μl PBS and tumors were monitored by caliper twice a week until they reached a size of 100 mm3 (or 400 mm3 for flow cytometric assessment). Mice were then treated with immunotherapies or isotype controls twice weekly for 3 weeks by intraperitoneal injection. Checkpoint modulators included 200 μg in 50 μl of PBS per mouse of α-CTLA-4 (Syrian Hamster IgG, clone 9H10), α-PD-1 (Rat IgG2a, clone RMP1-14), α-OX40 (Rat IgG1, clone OX86) and combination α-CTLA-4/α-PD-1 and α-PD-1/α-OX40, or respective isotype control MPC-11 (Mouse IgG2b lot # 4700/0314) HRPN (Rat IgG1 lot #5339/1014) 2A3 (Rat IgG2a lot # 5054/1213) all from BioXCell (West Lebanon, NH). For targeted therapies, mice were treated for 19 days orally by gavage QD with 30 mg/kg dabrafenib and 1 mg/kg trametinib in 0.5% hydroxypropylmethylcellulose and 0.2% Tween 80 in distilled water pH 8.0 vehicle. Mice received 6 doses of checkpoint modulators over three weeks and/or 19 days of concurrent targeted therapy. Rechallenge studies for mice that were NED at the completion of treatment were compared to mice without previous xenograft exposure BP cell lines implanted were derived from a common batch. End point limits on protocol was 2 cm x 2 cm tumor size, 4mm3 ulcerated tumor, 20% body weight loss or 60 days after initial drug dose. All animal procedures were conducted following the approval of the Institutional Animal Care and Use Committee (IACUC) of the University of Texas MD Anderson Cancer Center under protocol 00000884RN01.
Gene expression profiling – NanoString
RNA was extracted from frozen tumor tissue using the RNeasy kit (Qiagen). 1 µg of RNA was analyzed using the nCounter® PanCancer Immune Profiling Panel (NanoString, Seattle, WA), a codeset including 770 immune- and cancer-associated genes. Analysis was performed using the nSolver software (NanoString, Seattle, WA).
Microarray
RNA was extracted using the Total RNA Purification Kit (Norgen Biotek Corp), and gene expression was evaluated using the Gene Expression WT Pico Kit according to the manufacturer’s recommendations (Affymetrix, Santa Clara, Ca).
Gene Expression Analysis
Statistical analyses for Affymetrix gene expression profiling data were conducted in R version 3.4.2.Citation41 Data were processed using the “affy” package and converted to gene level data using the custom CDF ClariomDMouse_Mm_ENTREZG_22.0.0 from Brainarray (url: http://brainarray.mbni.med.umich.edu/Brainarray/Database/CustomCDF/22.0.0/entrezg.asp).Citation42,Citation43 Differential expression analysis was conducted using a linear model in the “limma” package,Citation44 with model terms for each of the treatment groups and the batch (3 samples from each treatment group were in the first batch, 1 from each group was in the second batch). Statistical significance was assessed using the empirical Bayes method, and the method of Benjamini and Hochberg was used to control for false discovery.Citation45,Citation46 Immune cell infiltration was estimated using CIBERSORT with the included LM22 signature, and differential immune cell infiltration was assessed similarly using limma.Citation24
Pathway analysis for each comparison (CTLA-4 vs. Vehicle, etc.) was conducted using Fast Gene Set Enrichment Analysis (the “fgsea” package in R), using the Hallmark and Reactome gene sets downloaded from the Molecular Signatures Database.Citation47–49 The t-statistic calculated by limma for each comparison was used to form the ranked list as input to fgsea. Gene sets with 10 to 500 members were included in the fgsea analysis, and 10,000 permutations were used to evaluate statistical significance. Leading edge genes from these analyses were sorted into metagenes using the Leading Edge Metagenes approach.Citation50,Citation51 Nonnegative matrix factorization (with the “NMF” package in R) was used to identify the number of metagenes that optimizes the cophenetic coefficient and other recommended factors, and these metagenes were then identified.Citation52 A gene ontology overlap analysis using topGO identified the molecular functions most associated with each metagene, and the overlap between terms was calculated using the Jaccard index.Citation53
Immunohistochemistry
Tumors were embedded in formalin and fixed in paraffin (FFPE) and sectioned into 4 μm thick slices and mounted onto slides. Slides were then stained for CD3 (clone CD3-12, AbD Serotec, Raleigh, North Carolina), CD8 (4SM15 eBioscience, Waltham, MA), pS6 (Polyclonal, Cell Signaling Technology), and DAB and counterstained with hematoxylin before being coverslipped. Slides were then scanned with an Aperio Slide Scanner and quantified digitally by measuring the average of 5 representative 1 mm2 regions within the tumor to get a score in counts/mm2.Citation54
Flow cytometry
Tumors were digested into single-cell suspensions as follows: Tumors were cut into small pieces using a scalpel and needle, and incubated in 40 mL digest media comprising RPMI-1640 with 2 mg/mL collagenase A (Roche, Cat. No. 11088793001) and 40units/mL DNase-I (Sigma-Aldrich, Cat. No. D5025) at 37°C with agitation for 1 hour. Tumor digests were then filtered through a 70 μm cell strainer (BD Falcon) and resuspended in FACS buffer (PBS + 2% FBS + 1 mM EDTA) for staining. Spleens were mashed through a 70 μm cell strainer and resuspended in FACS buffer for staining. Antibodies included CD3 (clone 145–2 C11), CD4 (RM4-R), CD8 (53–6.7), CD44 (IM7), CD62L (MEL-14), TIM-3 (B8.2 C12), LAG-3 (C9B7W), PD-1 (29 F.1A12), IFN-γ (XMG1.2), and TNF (MP6-XT22), all from BioLegend (San Diego, CA). Samples were acquired on an Accuri C6 Flow Cytometer (BD Biosciences) and analyzed with the FlowJo software (version 10.4). For cytokine assessment, digested cells were plated at 106 cells/mL in a 96 well round bottom plate with Cell Activation Cocktail (BioLegend) overnight prior to intracellular staining, as recommended by the manufacturer using Fixation Buffer (BioLegend) and Intracellular Staining Permeabilization Wash Buffer 10X (BioLegend). Gating strategy is shown in Supplementary Figure S6.
Statistical analysis
GraphPad Prism 6.0 (La Jolla, CA) was used to generate plots. Tumor volume comparison were performed using 1-way ANOVA with Tukey’s multiple comparison test. Tumor survival analysis were performed by constructing Kaplan-Meier survival curves and analyzed using the Mantel-Cox log rank test with Bonferroni correction for multiple comparisons.
Health and safety
All mandatory laboratory health and safety procedures have been complied with in the course of conducting this experimental work.
Acknowledgments
This work was supported by a grant from the Cancer Prevention Research Institute of Texas (CPRIT grant RP150030) and by the generous philanthropic contributions to The University of Texas MD Anderson Cancer Center Melanoma Moon Shots ProgramTM from the Lyda Hill Foundation. MAD is supported by the Dr. Miriam and Sheldon G. Adelson Medical Research Foundation, the AIM at Melanoma Foundation, the NIH/NCI (1 P50 CA221703-02 and 1U54CA224070-03; MAD), the American Cancer Society and the Melanoma Research Alliance, Cancer Fighters of Houston, the Anne and John Mendelsohn Chair for Cancer Research, and philanthropic contributions to the Melanoma Moon Shots Program of MD Anderson. MCA is supported by a National Health and Medical Research Council of Australia CJ Martin Early Career Fellowship (#1148680; MCA). AR was supported by the Kimberley Clark Foundation Award for Scientific Achievement provided by MD Anderson’s Odyssey Fellowship Program. MGW is supported by National Institutes of Health T32 CA 009599 and the MD Anderson Cancer Center support grant (P30 CA016672). MGW was supported by National Institutes of Health (T32CA009599; MGW) and the MD Anderson Cancer Center support grant (P30 CA016672; MGW). POG was supported by the Fonds de Recherche Québec–Santé’s (FRQS) Resident Physician Health Research Career Training Program (32667; POG). J.A.W. is supported by the National Institutes of Health (1R01CA219896-01A1; JAW), the Melanoma Research Alliance (4022024), American Association for Cancer Research Stand Up To Cancer (SU2C-AACR-IRG-19-17; JAW), and the MD Anderson Melanoma Moonshot Program. The funders had no role in study design, data collection and analysis, decision to publish or preparation of the manuscript. Finally, the authors would like to thank Jennifer McQuade for her helpful discussions and input.
Supplemental Material
Download ()Disclosure statement
MCA reports advisory board participation and honoraria from Merck Sharp and Dohme, outside the submitted work. MAD has been a consultant to Roche/Genentech, Array, Novartis, BMS, GlaxoSmithKline (GSK), Sanofi-Aventis, Vaccinex and Apexigen, and he has been the PI of research grants to UT MD Anderson by Roche/Genentech, GSK, Sanofi-Aventis, Merck, Myriad, and Oncothyreon. JEG reports advisory board participation with Merck, Regeneron, BMS, Novartis, and Syndax. AJL reports personal fees from BMS, Novartis, Genentech/Roche, and Merck; personal fees and non-financial support from ArcherDX and Beta-Cat; grants and non-financial support from Medimmune/AstraZeneca and Sanofi; grants, personal fees and non-financial support from Janssen, all outside the submitted work. MTT reports personal fees from Myriad Genetics, Seattle Genetics and Novartis, all outside the submitted work. ZAC is currently an employee of AstraZeneca outside the submitted work. JAW reports speaker fees from Imedex, Dava Oncology, Omniprex, Illumina, Gilead, MedImmune and BMS; consultant/advisor roles or advisory board membership for Roche-Genentech, Novartis, AstraZeneca, GSK, BMS, Merck/MSD, Biothera Pharma, and Microbiome DX; and receives clinical trial support from GSK, Roche-Genentech, BMS, and Novartis, all outside the current work. The remaining authors declare no competing interests.
Supplementary material
Supplemental data for this article can be accessed on the publisher’s website.
Additional information
Funding
References
- Dummer R, Arance Fernández AM, Hansson J, Larkin JMG, Long GV, Gasal E, Kaper M, Upalawanna A, Mookerjee B, Atkinson V, et al. Preliminary findings from part 1 of COMBI-i: a phase III study of anti–PD-1 antibody PDR001 combined with dabrafenib (D) and trametinib (T) in previously untreated patients (pts) with advanced BRAF V600-mutant melanoma. J Clin Oncol. 2018;36(5_suppl):189. doi:10.1200/JCO.2018.36.5_suppl.189.
- Ribas A, Algazi A, Ascierto PA, Butler MO, Chandra S, Gordon M, Hernandez-Aya L, Lawrence D, Lutzky J, Miller WH, et al. PD-L1 blockade in combination with inhibition of MAPK oncogenic signaling in patients with advanced melanoma. Nat Commun. 2020;11(1):6262. doi:10.1038/s41467-020-19810-w.
- Ascierto PA, Di Giacomo AM, Svane I, Lotem M, Bar-Sela G, Couture F, Schachter J, Queirolo P, Long GV, Di Giacomo AM, et al. 1244OKEYNOTE-022 Part 3: phase II randomized study of 1L dabrafenib (D) and trametinib (T) plus pembrolizumab (Pembro) or placebo (PBO) for BRAF-mutant advanced melanoma. Ann Oncol. 2018;29(suppl_8):viii442. doi:10.1093/annonc/mdy289.
- Larkin J, Chiarion-Sileni V, Gonzalez R, Jj G, Rutkowski P, Lao CD, Cowey CL, Schadendorf D, Wagstaff J, Dummer R, et al. Five-year survival with combined nivolumab and ipilimumab in advanced melanoma. N Engl J Med. 2019;381(16):1535–12. doi:10.1056/NEJMoa1910836.
- Curran MA, Montalvo W, Yagita H, Allison JP. PD-1 and CTLA-4 combination blockade expands infiltrating T cells and reduces regulatory T and myeloid cells within B16 melanoma tumors. Proc Natl Acad Sci U S A. 2010;107(9):4275–4280. doi:10.1073/pnas.0915174107.
- Hodi FS, Chiarion-Sileni V, Gonzalez R, Grob JJ, Rutkowski P, Cowey CL, Lao CD, Schadendorf D, Wagstaff J, Dummer R, et al. Nivolumab plus ipilimumab or nivolumab alone versus ipilimumab alone in advanced melanoma (CheckMate 067): 4-year outcomes of a multicentre, randomised, phase 3 trial. Lancet Oncol. 2018;19(11):1480–1492. doi:10.1016/S1470-2045(18)30700-9.
- Gutzmer R, Stroyakovskiy D, Gogas H, Robert C, Lewis K, Protsenko S, Pereira RP, Eigentler T, Rutkowski P, Demidov L, et al. Atezolizumab, vemurafenib, and cobimetinib as first-line treatment for unresectable advanced BRAF(V600) mutation-positive melanoma (IMspire150): primary analysis of the randomised, double-blind, placebo-controlled, phase 3 trial. Lancet. 2020;395(10240):1835–1844. doi:10.1016/S0140-6736(20)30934-X.
- Nathan RD, Long GV, Ascierto PA, Tawbi HA, Robert C, Rutkowski P, Leonov O, Dutriaux C, Mandala M, Lorigan P, et al. Spartalizumab plus dabrafenib and trametinib (Sparta-DabTram) in patients (pts) with previously untreated BRAF V600–mutant unresectable or metastatic melanoma: results from the randomized part 3 of the phase III COMBI-i trial. Ann Oncol. 2020;31:S1142–S215.
- Dobreva ZG, Miteva LD, Stanilova SA. The inhibition of JNK and p38 MAPKs downregulates IL-10 and differentially affects c-Jun gene expression in human monocytes. Immunopharmacol Immunotoxicol. 2009;31(2):195–201. doi:10.1080/08923970802626276.
- Boni A, Cogdill AP, Dang P, Udayakumar D, Njauw CN, Sloss CM, Ferrone CR, Flaherty KT, Lawrence DP, Fisher DE, et al. Selective BRAF V600E inhibition enhances T-cell recognition of melanoma without affecting lymphocyte function. Cancer Res. 2010;70(13):5213–5219. doi:10.1158/0008-5472.CAN-10-0118.
- Frederick DT, Piris A, Cogdill AP, Cooper ZA, Lezcano C, Ferrone CR, Mitra D, Boni A, Newton LP, Liu C, et al. BRAF inhibition is associated with enhanced melanoma antigen expression and a more favorable tumor microenvironment in patients with metastatic melanoma. Clin Cancer Res. 2013;19(5):1225–1231. doi:10.1158/1078-0432.CCR-12-1630.
- Schilling B, Paschen A. Immunological consequences of selective BRAF inhibitors in malignant melanoma: neutralization of myeloid-derived suppressor cells. Oncoimmunology. 2013;2(8):e25218. doi:10.4161/onci.25218.
- Knight DA, Ngiow SF, Li M, Parmenter T, Mok S, Cass A, Haynes NM, Kinross K, Yagita H, Koya RC, et al. Host immunity contributes to the anti-melanoma activity of BRAF inhibitors. J Clin Invest. 2013;123(3):1371–1381. doi:10.1172/JCI66236.
- Ho PC, Meeth KM, Tsui YC, Srivastava B, Bosenberg MW, Kaech SM. Immune-based antitumor effects of BRAF inhibitors rely on signaling by CD40L and IFNgamma. Cancer Res. 2014;74(12):3205–3217. doi:10.1158/0008-5472.CAN-13-3461.
- Liu C, Peng W, Xu C, Lou Y, Zhang M, Wargo JA, Chen JQ, Li HS, Watowich SS, Yang Y, et al. BRAF inhibition increases tumor infiltration by T cells and enhances the antitumor activity of adoptive immunotherapy in mice. Clin Cancer Res. 2013;19(2):393–403. doi:10.1158/1078-0432.CCR-12-1626.
- Reddy SM, Reuben A, Wargo JA. Influences of BRAF inhibitors on the immune microenvironment and the rationale for combined molecular and immune targeted therapy. Curr Oncol Rep. 2016;18(7):42. doi:10.1007/s11912-016-0531-z.
- Cooper ZA, Juneja VR, Sage PT, Frederick DT, Piris A, Mitra D, Lo JA, Hodi FS, Freeman GJ, Bosenberg MW, et al. Response to BRAF inhibition in melanoma is enhanced when combined with immune checkpoint blockade. Cancer Immunol Res. 2014;2(7):643–654. doi:10.1158/2326-6066.CIR-13-0215.
- Hu-Lieskovan S, Mok S, Homet Moreno B, Tsoi J, Robert L, Goedert L, Pinheiro EM, Koya RC, Graeber TG, Comin-Anduix B, et al. Improved antitumor activity of immunotherapy with BRAF and MEK inhibitors in BRAF V600E melanoma. Sci Transl Med. 2015;7(279):279ra41. doi:10.1126/scitranslmed.aaa4691.
- Ebert PJR, Cheung J, Yang Y, McNamara E, Hong R, Moskalenko M, Gould SE, Maecker H, Irving BA, Kim JM, et al. MAP kinase inhibition promotes T cell and anti-tumor activity in combination with PD-L1 checkpoint blockade. Immunity. 2016;44(3):609–621. doi:10.1016/j.immuni.2016.01.024.
- Aspeslagh S, Postel-Vinay S, Rusakiewicz S, Soria JC, Zitvogel L, Marabelle A. Rationale for anti-OX40 cancer immunotherapy. Eur J Cancer. 2016;52:50–66. doi:10.1016/j.ejca.2015.08.021.
- Linch SN, McNamara MJ, Redmond WL. OX40 agonists and combination immunotherapy: putting the pedal to the metal. Front Oncol. 2015;5:34. doi:10.3389/fonc.2015.00034.
- Peng W, Chen JQ, Liu C, Malu S, Creasy C, Tetzlaff MT, Xu C, McKenzie JA, Zhang C, Liang X, et al. Loss of PTEN promotes resistance to T Cell–Mediated immunotherapy. Cancer Discov. 2016;6(2):202–216. doi:10.1158/2159-8290.CD-15-0283.
- Hugo W, Zaretsky JM, Sun L, Song C, Moreno BH, Hu-Lieskovan S, Berent-Maoz B, Pang J, Chmielowski B, Cherry G, et al. Genomic and transcriptomic features of response to Anti-PD-1 therapy in metastatic melanoma. Cell. 2016;165(1):35–44. doi:10.1016/j.cell.2016.02.065.
- Newman AM, Liu CL, Green MR, Gentles AJ, Feng W, Xu Y, Hoang CD, Diehn M, Alizadeh AA. Robust enumeration of cell subsets from tissue expression profiles. Nat Methods. 2015;12(5):453–457. doi:10.1038/nmeth.3337.
- Ferrucci PF, Di Giacomo AM, Del Vecchio M, Atkinson V, Schmidt H, Schachter J, Queirolo P, Long GV, Stephens R, Svane IM, et al. KEYNOTE-022 part 3: a randomized, double-blind, phase 2 study of pembrolizumab, dabrafenib, and trametinib in BRAF-mutant melanoma. J Immunother Cancer. 2020;8(2):e001806. doi:10.1136/jitc-2020-001806.
- Long GV, Atkinson V, Cebon JS, Jameson MB, Fitzharris BM, McNeil CM, Hill AG, Ribas A, Atkins MB, Thompson JA, et al. Standard-dose pembrolizumab in combination with reduced-dose ipilimumab for patients with advanced melanoma (KEYNOTE-029): an open-label, phase 1b trial. Lancet Oncol. 2017;18(9):1202–1210. doi:10.1016/S1470-2045(17)30428-X.
- Gubin MM, Zhang X, Schuster H, Caron E, Ward JP, Noguchi T, Ivanova Y, Hundal J, Arthur CD, Krebber W-J, et al. Checkpoint blockade cancer immunotherapy targets tumour-specific mutant antigens. Nature. 2014;515(7528):577–581. doi:10.1038/nature13988.
- Cabrita R, Lauss M, Sanna A, Donia M, Skaarup Larsen M, Mitra S, Johansson I, Phung B, Harbst K, Vallon-Christersson J, et al. Tertiary lymphoid structures improve immunotherapy and survival in melanoma. Nature. 2020;577(7791):561–565. doi:10.1038/s41586-019-1914-8.
- Helmink BA, Reddy SM, Gao J, Zhang S, Basar R, Thakur R, Yizhak K, Sade-Feldman M, Blando J, Han G, et al. B cells and tertiary lymphoid structures promote immunotherapy response. Nature. 2020;577(7791):549–555. doi:10.1038/s41586-019-1922-8.
- Shrimali RK, Ahmad S, Verma V, Zeng P, Ananth S, Gaur P, Gittelman RM, Yusko E, Sanders C, Robins H, et al. Concurrent PD-1 blockade negates the effects of OX40 agonist antibody in combination immunotherapy through inducing T-cell apoptosis. Cancer Immunol Res. 2017;5(9):755–766. doi:10.1158/2326-6066.CIR-17-0292.
- Messenheimer DJ, Jensen SM, Afentoulis ME, Wegmann KW, Feng Z, Friedman DJ, Gough MJ, Urba WJ, Fox BA. Timing of PD-1 blockade is critical to effective combination immunotherapy with anti-OX40. Clin Cancer Res. 2017;23(20):6165–6177. doi:10.1158/1078-0432.CCR-16-2677.
- Loi S, Dushyanthen S, Beavis PA, Salgado R, Denkert C, Savas P, Combs S, Rimm DL, Giltnane JM, Estrada MV, et al. RAS/MAPK activation is associated with reduced tumor-infiltrating lymphocytes in triple-negative breast cancer: therapeutic cooperation between MEK and PD-1/PD-L1 immune checkpoint inhibitors. Clin Cancer Res. 2016;22(6):1499–1509. doi:10.1158/1078-0432.CCR-15-1125.
- Joseph RW, Elassaiss-Schaap J, Kefford R, Hwu WJ, Wolchok JD, Joshua AM, Ribas A, Hodi FS, Hamid O, Robert C, et al. Baseline tumor size is an independent prognostic factor for overall survival in patients with melanoma treated with pembrolizumab. Clin Cancer Res. 2018;24(20):4960–4967. doi:10.1158/1078-0432.CCR-17-2386.
- Buchbinder EI, Desai A. CTLA-4 and PD-1 pathways: similarities, differences, and implications of their inhibition. Am J Clin Oncol. 2016;39(1):98–106. doi:10.1097/COC.0000000000000239.
- Wolchok JD, Chiarion-Sileni V, Gonzalez R, Rutkowski P, Grob JJ, Cowey CL, Lao CD, Wagstaff J, Schadendorf D, Ferrucci PF, et al. Overall survival with combined nivolumab and ipilimumab in advanced melanoma. N Engl J Med. 2017;377(14):1345–1356. doi:10.1056/NEJMoa1709684.
- Tanaka T, Narazaki M, Kishimoto T. Immunotherapeutic implications of IL-6 blockade for cytokine storm. Immunotherapy. 2016;8(8):959–970. doi:10.2217/imt-2016-0020.
- Petroni G, Buqué A, Yamazaki T, Bloy N, Liberto MD, Chen-Kiang S, Formenti SC, Galluzzi L. Radiotherapy delivered before CDK4/6 inhibitors mediates superior therapeutic effects in ER + breast cancer. Clin Cancer Res. 2021;27(7):1855. doi:10.1158/1078-0432.CCR-20-3871.
- De Wolf K, Vermaelen K, De Meerleer G, Lambrecht BN, Ost P. The potential of radiotherapy to enhance the efficacy of renal cell carcinoma therapy. Oncoimmunology. 2015;4(10):e1042198. doi:10.1080/2162402X.2015.1042198.
- Eke I, Makinde AY, Aryankalayil MJ, Sandfort V, Palayoor ST, Rath BH, Liotta L, Pierobon M, Petricoin EF, Brown MF, et al. Exploiting radiation-induced signaling to increase the susceptibility of resistant cancer cells to targeted drugs: AKT and mTOR inhibitors as an example. Mol Cancer Ther. 2018;17(2):355–367. doi:10.1158/1535-7163.MCT-17-0262.
- Hashizume R, Zhang A, Mueller S, Prados MD, Lulla RR, Goldman S, Saratsis AM, Mazar AP, Stegh AH, Cheng SY, et al. Inhibition of DNA damage repair by the CDK4/6 inhibitor palbociclib delays irradiated intracranial atypical teratoid rhabdoid tumor and glioblastoma xenograft regrowth. Neuro Oncol. 2016;18(11):1519–1528.
- Team RC. R: a language and environment for statistical computing. R Foundation for Statistical Computing. Vienna (Austria); 2016.
- Dai M, Wang P, Boyd AD, Kostov G, Athey B, Jones EG, Bunney WE, Myers RM, Speed TP, Akil H, Watson SJ. Evolving gene/transcript definitions significantly alter the interpretation of GeneChip data. Nucleic Acids Res. 2005;33(20):e175. doi:10.1093/nar/gni179.
- Gautier L, Cope L, Bolstad BM, Irizarry RA. Affy--analysis of affymetrix geneChip data at the probe level. Bioinformatics. 2004;20(3):307–315. doi:10.1093/bioinformatics/btg405.
- Ritchie ME, Silver J, Oshlack A, Holmes M, Diyagama D, Holloway A, Smyth GK. A comparison of background correction methods for two-colour microarrays. Bioinformatics. 2007;23(20):2700–2707. doi:10.1093/bioinformatics/btm412.
- Benjamini Y, Hochberg Y. Controlling the false discovery rate: a practical and powerful approach to multiple testing. J Royal Stat Soc Series B (Methodol). 1995;57(1):289–300. doi:10.1111/j.2517-6161.1995.tb02031.x.
- Smyth GK. Linear models and empirical Bayes methods for assessing differential expression in microarray experiments. Stat Appl Genet Mol Biol. 2004;3(1):1–25. doi:10.2202/1544-6115.1027.
- Joshi-Tope G, Gillespie M, Vastrik I, D’Eustachio P, Schmidt E, De Bono B, Jassal B, Gopinath GR, Wu GR, Matthews L, Lewis S. Reactome: a knowledgebase of biological pathways. Nucleic Acids Res. 2005;33(Database issue):D428–32. doi:10.1093/nar/gki072.
- Sergushichev AA, Loboda AA, Jha AK, Vincent EE, Driggers EM, Jones RG, Pearce EJ, Artyomov MN. GAM: a web-service for integrated transcriptional and metabolic network analysis. Nucleic Acids Res. 2016;44(W1):W194–200. doi:10.1093/nar/gkw266.
- Subramanian A, Tamayo P, Mootha VK, Mukherjee S, Ebert BL, Gillette MA, Paulovich A, Pomeroy SL, Golub TR, Lander ES, et al. Gene set enrichment analysis: a knowledge-based approach for interpreting genome-wide expression profiles. Proc Natl Acad Sci U S A. 2005;102(43):15545–15550. doi:10.1073/pnas.0506580102.
- Godec J, Tan Y, Liberzon A, Tamayo P, Bhattacharya S, Butte AJ, Mesirov J, Haining W. Compendium of immune signatures identifies conserved and species-specific biology in response to inflammation. Immunity. 2016;44(1):194–206. doi:10.1016/j.immuni.2015.12.006.
- Tan Y, Godec J, Wu F, Tamayo P, Mesirov JP, Haining WN. A method for downstream analysis of gene set enrichment results facilitates the biological interpretation of vaccine efficacy studies. bioRxiv. 2016;043158.
- Gaujoux R, Seoighe C. A flexible R package for nonnegative matrix factorization. BMC Bioinform. 2010;11(1):367. doi:10.1186/1471-2105-11-367.
- Alexa A, Rahnenfuhrer J. TopGO: enrichment analysis for gene ontology. R package version 2.34.0. 2018.
- Chen PL, Roh W, Reuben A, Cooper ZA, Spencer CN, Prieto PA, Miller JP, Bassett RL, Gopalakrishnan V, Wani K, et al. Analysis of immune signatures in longitudinal tumor samples yields insight into biomarkers of response and mechanisms of resistance to immune checkpoint blockade. Cancer Discov. 2016;6(8):827–837. doi:10.1158/2159-8290.CD-15-1545.