
Abstract
The evolution of modern wireless communications systems has dramatically increased the demand for antenna arrays. An antenna array with certain radiation characteristics is often desired. However, the actual radiation pattern of an antenna array changes when faults are introduced in the array. In this paper a statistical fault detection methodology based on the exponentially weighted moving average (EWMA) control scheme is proposed to detect possible faulty radiation patterns in linear antenna arrays. The proposed method detects the faults based on deviation in the radiation pattern from the desired ones. The difference between synthesized radiation pattern obtained using the Minimax algorithm and the measured pattern can be used as an indicator about the existence or absence of faults. To assess the fault detection abilities of the EWMA control scheme, three case studies are considered, one involving a complete failure in one element in the array, one involving partial failure in two elements, and one involving degradation caused by random noise due to interference and other factors. The simulation results for all cases show the effectiveness of the proposed EWMA fault detection method.
1. Introduction
Over the past few years, the evolution of telecommunications and modern wireless communication systems, such as satellites and radars, has significatively increased the demand for antennas, which have become an indispensable tool in several applications. For example, microstrip antennas have became a suitable choice for several communication systems in a variety of applications due to their low profile structure, light weight, and low manufacturing cost (Garg, Citation2001; Pozar & Schaubert, Citation1995). They are particularly adaptable to mobile equipments and can be embedded in portable devices which helps their utilization in wireless land mobiles or terrestrial-satellite networks. Moreover, their flexibility helps them become conformable to planar and non-planar surfaces, which makes them very well suited for applications such as cellular phones, planes, satellites, navigation systems, and many others. Microstrip antennas have proven their effectiveness, and thus could replace traditional antennas in various applications. However, a microstrip antenna has limited radiation characteristics that can be improved using antenna arrays. Antenna arrays can be used to synthesize radiation characteristics that cannot be achieved using a single antenna such as depointing, electronic scanning, and rejection of the jammer. Since antenna arrays with certain radiation requirements are often needed, the antenna arrays’ synthesis problem has become a hot research topic. The main objective behind synthesis of antenna array is to determine the appropriate excitation amplitudes, phase and/or locations of its elements that yield the desired radiation patterns. Of course, the problem of designing antenna arrays can be characterized by different requirements (e.g. controllable beam width, lower side lobes level, directivity, noise sensitivity, and robustness) that need to be satisfied. Several approaches have been proposed in the literature for designing the antenna arrays, and can be classified into two main categories: deterministic and stochastic. The deterministic approaches include analytical methods and semi-analytical methods. Examples of deterministic techniques include the well-known Taylor method (Balanis, Citation1982; Ma, Citation1974), the Chebyshev method (Balanis, Citation1982), the Minimax algorithm (Bouyeddou, Harrou, Djennas, & Merad, 2009), and others. Unfortunately, using the deterministic methods, it is easy to get trapped in local minima. The stochastic optimization-based methods, on the other hand, have been getting more and more popular over the last decade. They include neural networks (NN) (Guney & Sarikaya, Citation2007; Merad, Bendimerad, Meriah, & Jennas, Citation2007), genetic algorithm (GA) (Harrou, Tassadit, & Bouyeddou, Citation2010; Tennant, Dawoud, & Anderson, Citation1994; Yan & Lu, Citation1997), simulated annealing (SA) (Ferreira & Ares, Citation1997), tabu search (Akdagli & Guney, Citation2003; Merad, Bendimerad, & Meriah, Citation2008), controlled random search algorithm (Merad, Bendimerad, & Meriah, Citation2006), chaotic particle swarm optimization (PSO) algorithm (Mandal, Das, Bhattacharjee, Bhattacharjee, & Ghoshal, 2010; Wang & Feng, 2010), pattern search (PSearch) (Güneş & Tokan, Citation2010), bees algorithm (Guney & Onay, Citation2010), and harmony search algorithm (Guney & Onay, Citation2011).
Many applications such as radar surveillance and satellite antenna require high-performance antenna array systems. In practice, if any element in the array is not functioning properly, the radiation characteristics of the antenna array will deviate from the required radiation pattern. Thus, monitoring antenna arrays is essential for their proper and safe operation. Practically, the sought supervisory system is expected to detect and isolate faulty measurement sources, and then remove them before they affect the system performance (Isermann, Citation2006). In this paper, however, the focus will be on fault detection only. The task of developing monitoring techniques that can accurately and quickly detect abnormal situations (or faults) has greatly attracted the attention of researchers and engineers. Two kinds of faults are usually encountered in an antenna array. The first kind of fault that is widely encountered in practical instances is the so-called on–off fault, in which an element in the array stops working, i.e. does not radiate at all. The second kind of fault can be due to interferences and other factors that cause the degradation of the radiation pattern.
When a fault occurs in an antenna array, the radiation pattern of the array deviates significantly from the desired pattern indicating the presence of a new condition that is significantly distinguishable from the desired faultless working mode. The residuals, which is the difference between desired synthesized radiation pattern (nominal pattern) and the measured pattern can be used as an indicator about the existence or absence of faults. When the monitored array is under normal operating conditions (no faults exist), the residuals are zero or close to zero (in cases of modeling uncertainties and measurement noise). However, when a fault occurs, the residuals deviate significantly from zero indicating the presence of a fault that changed the normal faultless working mode of the antenna. The problem of antenna monitoring has been addressed by several researchers. Over the past few decades, many monitoring techniques have been proposed for the detection of faults in radiation patterns of antenna arrays, which are based on Bayesian compressive sensing (Oliveri, Paolo, & Massa, Citation2012), NN (Castaldi, Pierro, & Pinto, Citation2000; Rawat, Yadav, & Shrivastava, Citation2012; Vakula & Sarma, Citation2009), GA (Rodriguez, Ares, Palacios, & Vassal'lo, Citation2000; Yeo & Lu, Citation1999), case-based reasoning (Iglesias et al., Citation2008), bacteria foraging optimization (Acharya, Patnaik, & Choudhury, 2011), exhaustive searches (Rodriguez-Gonzalez, Ares-Pena, Fernandez-Delgado, Iglesias, & Barro, Citation2009), support vector machine (Rajagopalan, Joshi, & Gudla), and distributional approach (Buonanno, D'Urso, Cicolani, & Mosca, Citation2009).
In the present work, the exponentially weighted moving average (EWMA) control scheme (Hunter, Citation1986; Lucas & Saccucci, Citation1990) is adopted to detect the presence of possible faults in linear antenna arrays. First, the well-known Minimax algorithm is used to synthesize a linear antenna array, under normal operating conditions (fault-free), to obtain a radiation pattern that approximates a desired radiation diagram having a specified form, such as Gaussian function. Then, the EWMA control scheme is utilized to monitor the designed antenna array to make sure it follows the desired pattern.
The remainder of the paper is organized as follows. Section 2 presents basic theory on the design of antenna arrays. Then, a description of the EWMA monitoring scheme is presented in Section 3, followed by a description of how EWMA can be used to detect abnormalities in antenna arrays in Section 4. Finally, concluding remarks are presented in Section 5.
2. Antenna array design
Let us consider a linear antenna array () with an even number (2N) of isotropic elements within a radiation pattern f(θ). If the elements are symmetrically placed and conjugate symmetrically excited about the center of a linear array, the normalized radiation pattern of this array can be written as (Balanis, Citation1982)
Fig. 1. Geometry of the 2N-element symmetric linear array placed along the x-axis.
In antenna synthesis, it is sought to design antenna arrays with a directivity diagram that matches the desired radiation pattern Fd(θ) as close as possible by acting on the feed law ( and
). The desired radiation pattern Fd(θ) can vary widely depending on the application. It can be defined as a pattern shape or a function, such as a Gaussian function. Thus, the synthesis problem seeks to minimize the following quadratic error objective (or cost) function:
In order to obtain a linear antenna array with the desired pattern, the cost function shown in Equation (2) is minimized using the well-known Minimax algorithm, which is described in the following section.
2.1. The Minimax algorithm
In this section, we pose the array antenna synthesis problem as one that determines the feed law of the radiant elements that lead to a radiation pattern which suitably approximates a desired pattern. The antenna pattern design algorithm used in this paper is the Minimax algorithm (Hwang & Grados, 2008a, 2008b; Schjaer-Jacobsen & Madsen, Citation1979), which is a local optimization algorithm that seeks to design filters that are used in the impulse compression radar systems (Schjaer-Jacobsen & Madsen, Citation1979). The Minimax algorithm proves its effectiveness in several other applications, such as the exploration of game graphs and artificial intelligence (Charon, Germa, & Hudry, Citation1996). In this paper, the Minimax algorithm is used to determine the optimum synthesis of a 2N-element linear array pattern that provides a radiation pattern that approximates the desired pattern. The Minimax algorithm is a gradient search algorithm (Hwang & Grados, 2008a, 2008b; Schjaer-Jacobsen & Madsen, Citation1979) that iteratively minimizes the maximum absolute value of the cost function shown in Equation (2) starting with an arbitrary initial state. This algorithm optimizes the parameter values that minimize the maximum of the cost function. In other words, the Minimax algorithm works by iteratively modifying the excitation weights of the radiant elements until the maximum cost is minimized. More details about the Minimax algorithm can be found in Hwang and Grados (2008b) and Qian, Jen, Aliyazicioglu, and Hwang (2011). The Minimax algorithm flowchart is schematically illustrated in .
Fig. 2. Flowchart of the Minimax algorithm used in the synthesis of microstrip antenna arrays.
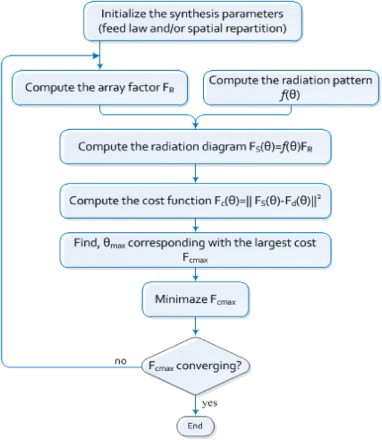
Even though various optimization algorithms can be used to solve this antenna synthesis problem, the Minimax algorithm is used in this work because of its effectiveness and simplicity in implementation. The synthesized radiation pattern obtained using the Minimax algorithm (which describes the normal or required antenna array operation) will be used in monitoring the antenna in this work by detecting any deviations from this normal operation.
3. Fault detection in linear antenna arrays
3.1. Faults in antenna arrays
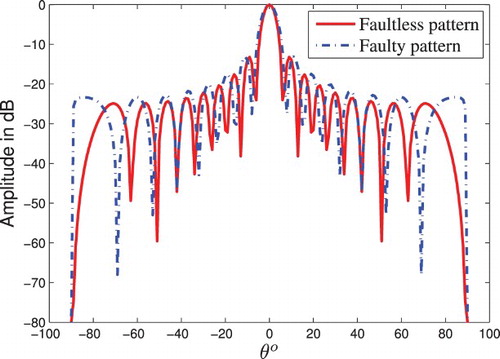
The radiation pattern of a synthesized antenna array changes as faults are introduced in the array. Therefore, the radiation pattern of the synthesized antenna array deviates from the desired one by changing the magnitude and phase of the antenna elements. Two different kinds of faults can be distinguished: on–off faults and partial faults. In an array with on–ff faults, the faulty elements do not radiate at all (i.e. fail completely), which is equivalent to assuming that their relative excitations are zero. However, in an array with partial failures, the faulty elements do not fail completely, i.e. their effective excitation is a fraction of its original value, but not zero. Partial faults can be due to noise, interferences, or other factors. shows the degradation in the radiation pattern as a result of a failure in a single element of the array; as more elements fail, the pattern gets degraded further. Generally, the faulty elements in antenna arrays can distort the directivity of the antenna pattern, which also increases the levels of the side lobes of the radiation pattern (Carlin, Oliveri, & Massa, Citation2011; Oliveri et al., Citation2012). Therefore, it is clear that fault detection of antenna arrays is crucial to maintain their proper and safe operation under normal operating conditions. In this work, this objective is achieved using the EWMA fault detection scheme. A brief introduction to the basic principles of EWMA, and how it can be used in fault detection is presented next.
Fig. 3. Radiation pattern of a 12-element linear antenna array.
3.2. EWMA control scheme
Statistical control charts have been widely used in quality engineering as a monitoring tool to detect the presence of possible faults in the mean or variance of system measurements. Control charts play a crucial role in detecting whether a system is working under the normal operation conditions (usually termed “in-control”) or not “out-of-control”. Numerous control charts have been developed to monitor the mean of system measurements over time, and include the Shewhart chart, cumulative summation (CUSUM) chart (Page, Citation1954), and the EWMA chart (Crowder & Hamilton, Citation1992; Hawkins & Olwell, Citation1998; Hunter, Citation1986; Lucas & Saccucci, Citation1990). Nowadays, the application of control charts has been extended to many areas, such as economics, medicine, environment, and others (Biau, Dessolle, & Porcher, Citation2011; Frisén, Citation2009; Heffernan et al., Citation2004). The traditional Shewhart control charts are very popular in statistical process control. They are appropriate to detect large shifts or changes in the system measurements (Human, Chakraborti, & Smit, Citation2010). A key disadvantage of the Shewhart charts is that they only use the last measured data sample, and thus they do not carry a memory of the previous data. Consequently, these charts are relatively insensitive to small changes in the system variables (Montgomery, Citation2005). This shortcoming motivated the use of other alternatives, such as the EWMA and CUSUM charts. The CUSUM charts, however, assume normal data, and are sensitive to violations of this assumption (Hawkins & Olwell, Citation1998).
In the EWMA control scheme, the moving average is calculated by multiplying the historical observations by a weight that decays exponentially with time (Montgomery, Citation2005). Monitoring the mean using the EWMA control scheme can be performed for individual observations as well as for the averages of rational subgroups. For individual observations, the EWMA decision function, zt, can be calculated recursively as follows:
To demonstrate that the EWMA zt is a weighted average of all previous sample, we may substitute the definition of zi−1 in the right-hand side of Equation (3) to obtain
Employing Equation (3) recursively, we find that the EWMA is a linear combination of all previous observations, i.e.
The EWMA control chart declares a fault when zt exceeds control limits that are expressed by means of multiples of the asymptotic standard deviation of zt. In other words, the procedure consists of plotting the EWMA statistic zt versus the sample number on a control chart with center line CL=μ0, which is the mean of the nominal fault-free data, and the upper and lower control limits, UCL and LCL, respectively. If the observations yt are uncorrelated, the control limit for the EWMA statistic, zt, can be calculated as follows (Montgomery, Citation2005):
3.3. Fault detection in the linear antenna array using the EWMA fault detection strategy
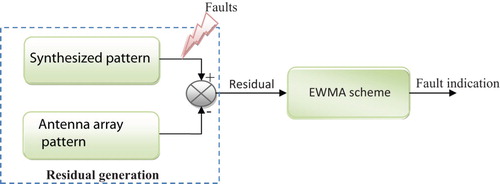
The goal of statistical process monitoring is to detect the existence of faults that can cause a system to deviate from its desired operation. The EWMA control scheme is a useful statistical process monitoring technique, especially when it is of interest to detect faults with small magnitudes. In this paper, the EWMA control scheme will be used to detect mean faults in a linear antenna array. The synthesized radiation pattern obtained using the Minimax algorithm will be used as a reference radiation pattern that describes the required antenna's operation, which is then used to detect faults in the measured radiation pattern. The residuals, which are the difference between the synthesized radiation pattern and the measured radiation pattern of a linear antenna array, can be used as an indicator about the existence or absence of faults. Fault detection in a linear antenna array using the EWMA control scheme involves the following steps, which are schematically illustrated in : (1) the generation of residuals based on the use of a synthesized radiation pattern, (2) the evaluation of these residuals by computing the EWMA statistic and the upper and lower control limits, and (3) the declaration of faults when measurements exceed the control limits.
Fig. 4. A schematic diagram of the EWMA fault detection method and its application to monitor antenna arrays.
The difference between the synthesized radiation pattern, Fd(θ), obtained using the Minimax algorithm and the measured one, Fs(θ), represents the residual vector, , which can be used to detect possible faulty radiation patterns. The residual for each zenith angle θj, i.e. can be computed as
,
. Then, the EWMA decision function based on the residuals can be computed as follows:
Since the EWMA control scheme is applied on the residuals vector, only one EWMA decision function will be computed to monitor the linear antenna array. However, this approach can only detect the presence of faults, i.e. it cannot determine their locations.
4. Simulation results
In this section, the fault detection abilities of the EWMA control scheme will be assessed through its application to monitor a linear antenna array. First, the Minimax algorithm will be used in the synthesis of a linear array, and then the EWMA control scheme will be used to monitor the synthesized array.
4.1. Linear antenna array synthesis
In this antenna synthesis simulated example, optimization is performed to determine the excitation weights of the radiant elements so that the global diagram approaches as possible an optimal (desired) diagram having the form of a Gaussian function. The radiation diagram, f(θ), used in this simulated example is the same as the one given by Damiano (Citation1989). This diagram is determined for a substrate with a permittivity equal to 2.2, thickness equal to 0.152 cm, a square patch with a dimension of 1.89 cm, and working at a frequency of 5 GHz. The Minimax algorithm was utilized for the synthesis of a uniformly spaced linear array consisting of 12 rectangular microstrip antennas by optimizing amplitude excitation.
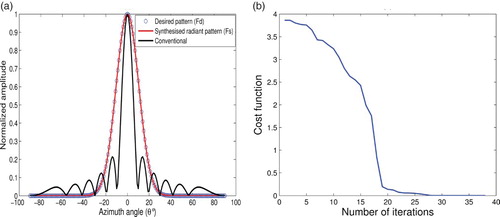
(a) presents the result of the linear antenna array synthesis by optimizing the amplitude excitation coefficients using the Minimax algorithm. It can be clearly seen that the radiation pattern obtained using the Minimax algorithm meets the desired pattern. (b) shows the evolution of the cost function versus the iteration number. It can be seen that the Minimax algorithm converges quickly to a minimum value of the cost function. The optimized values of the excitation amplitudes for the various elements are given in . When a synthesized radiation pattern with the desired performance is obtained, it can be used as a reference pattern for detecting unusual conditions (such as on–off faults and partial faults) in the antenna array.
Table 1. Amplitude excitation using the Minimax algorithm.
Fig. 5. (a) Radiation pattern of 12 elements λ/2 spaced array optimized with the Minimax algorithm with respect to amplitudes, compared with conventional array and (b) convergence curve of the Minimax algorithm.
4.2. Fault detection in the linear antenna array with the EWMA control scheme
In this section, the performance of the EWMA fault detection technique will be assessed through its utilization to monitor the operation of a linear antenna array. Three different cases of faults will be considered. In the first case, it is assumed that the linear array synthesized using the Minimax algorithm contains one completely failing element (case A). In the second case, the array is assumed to contain two partially failing elements (case B). In the third case, the radiation pattern of the synthesized linear array is assumed to be corrupted by additive Gaussian noise (case C).
4.2.1. Case A: detection of a complete failing element in the array
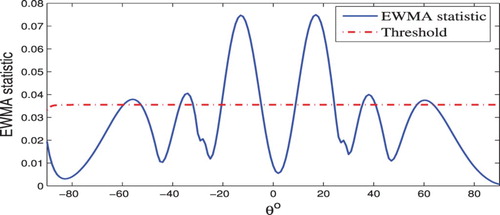
Here, we consider the case where the array contains one completely failing element (shown in ), which is equivalent to assuming that its relative excitation is zero. The synthesized and faulty radiation patterns are compared in . The difference between these two patterns (residual) is used by the EWMA for detection purposes. The parameters used in the EWMA control scheme (smoothing parameter (λ) and control limit width (L)) are λ=0.3 and L=3. The EWMA statistic for this case , which is plotted in , clearly shows the successful detection of such a fault using the EWMA control scheme through the violation of the control limit in more than one location (angle). Note also from that the computed EWMA statistic is a positive signal because it was calculated using the absolute value of the residual.
Fig. 6. Example of a linear antenna array with one element completely failing.
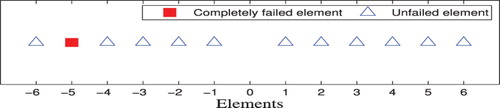
Fig. 7. Synthesized pattern of a fault-free array (solid line) and faulty pattern of the monitored array with one element completely failing.
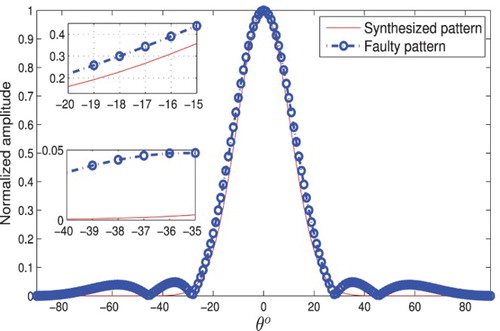
Fig. 8. The evolution of the EWMA statistic in the presence of an on–off fault in the synthesized linear antenna array.
4.2.2. Case B: detection of two elements with partial failures
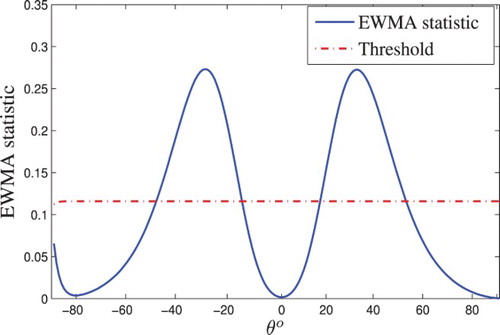
In this case, we consider the case where two elements in the array have partial failures (see ). It is assumed that the excitations of the partially failing elements are half of the original ones. First, the excitations of the original elements are modified to simulate these partial failures. shows the reference pattern and the faulty one. Then, the EWMA control scheme is used to detect the presence of such failures. As in the first case, the values of λ and L are assumed to be 0.3 and 3, respectively. The EWMA statistic for this case is plotted in , which shows the effectiveness of the EWMA fault detection scheme in detecting these partial failures.
Fig. 9. Example of linear antenna array with two partially failing elements.
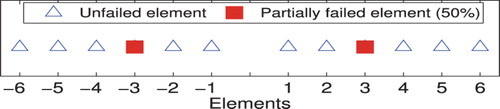
Fig. 10. Synthesized pattern of a fault-free array (solid line) and faulty pattern of the monitored array with two partially failing elements.
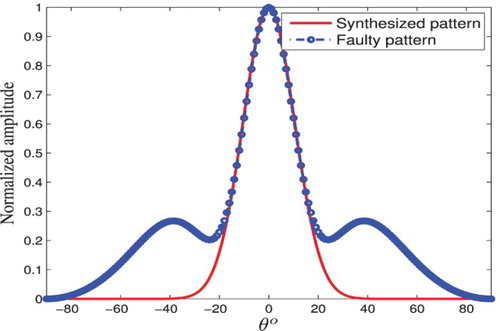
Fig. 11. The evolution of the EWMA statistic in the presence of a partial failure in two elements of the synthesized linear antenna array.
Note that, in the case of a fault, the radiation pattern can be restored with a minimal loss of quality (without replacing the defective element) by re-optimizing the excitations of the unfaulty elements of the antenna array. Several compensation (re-optimizing) techniques have been developed in the literature including machine learning optimization (Xu, Christodoulou, Barbin, & Martínez-Ramón, Citation2007), conjugate gradient-based algorithm (Peters, Citation1991), GA (Yeo & Lu, Citation1999), SA technique (Rodriguez & Ares, Citation1998), and many others.
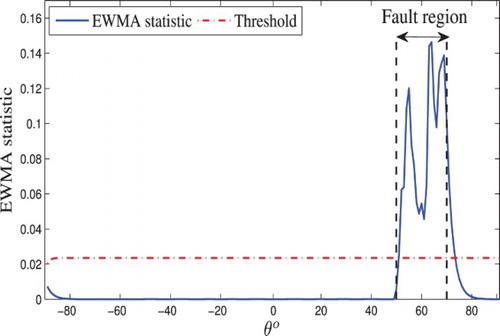
4.2.3. Case C: detection of array pattern degradation caused by noise
In this case, the radiation pattern of the synthesized linear array is corrupted by additive Gaussian noise with a magnitude of 5% to the radiation pattern within the angle range of . shows the synthesized radiation pattern of fault-free antenna array (solid line) and the distorted pattern (dashed line with circular markers). Again, the parameters used in the EWMA control scheme are λ=0.3 and L=3. , which plots the value of the EWMA statistic, shows that this fault is detected by exceeding the threshold value without any false alarms.
Fig. 12. Synthesized pattern of a fault-free array (solid line) and faulty pattern corrupted by interfering signal in direction θ=[50° 70°].
![Fig. 12. Synthesized pattern of a fault-free array (solid line) and faulty pattern corrupted by interfering signal in direction θ=[50° 70°].](/cms/asset/d5a58f4b-a934-47bf-b439-6ae88a22b8c0/tssc_a_913821_f0012_c.jpg)
Fig. 13. The evolution of the EWMA statistic in the presence of a additive noise within a specific range of angles.
The EWMA control scheme is not only effective in detecting the presence of interfering signals in the radiation pattern, but it can also be used to determine the angle of arrival of the interfering signal from which the location of the interference source can be deduced. The excitation of array elements can be re-optimized to produce a pattern with minimal loss of quality with respect to the desired one. On other hand, to guarantee reliable performances, noises intervening in one or more direction of the radiation pattern of the linear array can be rejected by numerically finding a new set of excitations of the perturbed array that optimizes some objective functions.
5. Conclusion
The presence of faults in antenna arrays can cause their radiation patterns to significantly deviate from their desired patterns, which affect their performance. In this paper, the problem of fault detection in linear antenna arrays has been addressed from a statistical point of view. Specifically, the EWMA control scheme has been used to achieve this objective by assessing the residuals between the desired and actual radiation patterns for the monitored array. The performance of the EWMA fault detection method is assessed using three case studies, one involving a complete failure in one element in the array, one involving partial failures in two elements in the array, and one involving degradation cause by additive noise. The results in all cases show the effectiveness of the EWMA control scheme in monitoring the linear antenna array.
The authors gratefully acknowledge financial support from Texas A&M University at Qatar.
REFERENCES
- Acharya, O., Patnaik, A., & Choudhury, B. (2011, 28–30 January). Fault finding in antenna arrays using bacteria foraging optimization technique. 2011 national conference on IEEE communications (NCC), Bangalore, pp. 1–5.
- Akdagli, A., & Guney, K. (2003). Shaped beam pattern synthesis of equally and unequally spaced linear antenna arrays using modified tabu search algorithm. Microwave and Optical Technology Letters, 36(1), 16–20. doi: 10.1002/mop.10657
- Balanis, C. (1982). Antenna theory: Analysis and design. New York: Wiley.
- Biau, D., Dessolle, L., & Porcher, R. (2011). Applications and experiences of quality control to surgical and interventional procedures. In O. Ivanov, (Ed.) Applications and experiences of quality control p. 27–44). Intech.
- Bouyeddou, B., Harrou, F., Djennas, S. A., & Merad, L. (2009, 23–27 March). Synthesis and optimization of microstrip antennas array using minimax method. 3rd European conference on IEEE antennas and propagation, Berlin, 2009, EuCAP 2009, pp. 1142–1146.
- Buonanno, A., D'Urso, M., Cicolani, M., & Mosca, S. (2009). Large phased arrays diagnostic via distributional approach. Progress in Electromagnetics Research, 92 153–166. doi: 10.2528/PIER09031704
- Carlin, M., Oliveri, G., & Massa, A. (2011). On the robustness to element failures of linear ads-thinned arrays. IEEE Transactions on Antennas and Propagation, 59(12), 4849–4853. doi: 10.1109/TAP.2011.2165510
- Castaldi, G., Pierro, V., & Pinto, I. (2000). Efficient faulty element diagnostics of large antenna arrays by discrete mean field neural nets. Progress in Electromagnetics Research, 25 53–76. doi: 10.2528/PIER99041602
- Charon, I., Germa, A., & Hudry, O. (1996). Méthodes d'optimisation combinatoire. Paris: Masson.
- Crowder, S. V., & Hamilton, M. D. (1992). An EWMA for monitoring a process standard deviation. Journal of Quality Technology, 24(1), 12–21.
- Damiano, J. P. (1989). Contribution à l’étude des antennes microrubans multicouches à éléments superposés ou décalés (Ph.D. dissertation), Thèse de Docteur essciences, Université de Nice-Sophia Antipolis, Nice, France.
- Ferreira, J. A., & Ares, F. (1997). Pattern synthesis of conformal arrays by the simulated annealing technique. Electronics Letters, 33(14), 1187–1189. doi: 10.1049/el:19970838
- Frisén, M. (2009). Optimal sequential surveillance for finance, public health, and other areas. Sequential Analysis, 28(3), 310–337. doi: 10.1080/07474940903041605
- Garg, R. (2001). Microstrip antenna design handbook. Norwood, MA: Artech House Publishers.
- Güneş, F., & Tokan, F. (2010). Pattern search optimization with applications on synthesis of linear antenna arrays. Expert Systems with Applications, 37(6), 4698–4705. doi: 10.1016/j.eswa.2009.11.012
- Guney, K., & Onay, M. (2010). Bees algorithm for interference suppression of linear antenna arrays by controlling the phase-only and both the amplitude and phase. Expert Systems with Applications, 37(4), 3129–3135. doi: 10.1016/j.eswa.2009.09.072
- Guney, K., & Onay, M. (2011). Optimal synthesis of linear antenna arrays using a harmony search algorithm. Expert Systems with Applications, 38(12), 15455–15462. doi: 10.1016/j.eswa.2011.06.015
- Guney, K., & Sarikaya, N. A. (2007). Hybrid method based combining artificial neural network and fuzzy inference system for simultaneous computation of resonant frequencies of rectangular, circular, and triangular microstrip antennas. IEEE Transactions on Antennas and Propagation, 55(3), 659–668. doi: 10.1109/TAP.2007.891566
- Harrou, F., Tassadit, A., & Bouyeddou, B. (2010). Analysis and synthesis of rectangular microstrip antenna. Journal of Modelling and Simulation of Systems, 1(1), 34–39.
- Hawkins, D. M., & Olwell, D. H. (1998). Cumulative sum charts and charting for quality improvement. New York: Springer Verlag.
- Heffernan, R., Mostashari, F., Das, D., Karpati, A., Kulldorff, M., Weiss, D., et al. (2004). Syndromic surveillance in public health practice, New York city. Emerging Infectious Diseases, 10(5), 858–864. doi: 10.3201/eid1005.030646
- Human, S. W., Chakraborti, S., & Smit, C. F. (2010). Shewhart-type control charts for variation in phase i data analysis. Computational Statistics & Data Analysis, 54(4), 863–874. doi: 10.1016/j.csda.2009.09.026
- Hunter, J. S. (1986). The exponentially weighted moving average. Journal of Quality Technology, 18(4), 203–210.
- Hwang, H. K., & Grados, R. (2008a, 10–12 June). Multibeam antenna and antenna beam shaping using the minimax algorithm. 26th AIAA communications and satellite systems conference, San Diego, CA.
- Hwang, H. K., & Grados, R. (2008b, 10–12 June). Filter design/antenna pattern design based on minimax algorithm. 26th AIAA communications and satellite systems conference, San Diego, CA.
- Iglesias, R., Ares, F., Delgado, M., Rodriguez, J., Bregains, J., & Barro, S. (2008). Element failure detection in linear antenna arrays using case-based reasoning. IEEE Antennas and Propagation Magazine, 50(4), 198–204. doi: 10.1109/MAP.2008.4653709
- Isermann, R. (2006). Fault-diagnosis systems: An introduction from fault detection to fault tolerance. Darmstadt: Springer.
- Lucas, J., & Saccucci, M. (1990). Exponentially weighted moving average control schemes: Properties and enhancements. Technometrics, 32 1 1–12. doi: 10.1080/00401706.1990.10484583
- Ma, M. (1974). Theory and application of antenna arrays. New York: Wiley.
- Mandal, D., Das, S., Bhattacharjee, S., Bhattacharjee, A., & Ghoshal, S. (2010, 3–5 October). Linear antenna array synthesis using novel particle swarm optimization. In 2010 IEEE symposium on industrial electronics & applications (ISIEA), Penang, Malaysia, pp. 311–316.
- Merad, L., Bendimerad, F. T., & Meriah, S. M. (2006). Controlled random search optimization for linear antenna arrays. Radioengineering, 15 3 10–14.
- Merad, L., Bendimerad, F. T., & Meriah, S. M. (2008). Design of linear antenna arrays for side lobe reduction using the tabu search method. Radioengineering, 5 3 219–222.
- Merad, L., Bendimerad, F. T., Meriah, S. M., & Jennas, S. A. (2007). Neural networks for synthesis and optimization of antenna arrays. Radioengineering, 16 1 23–30.
- Montgomery, D. C. (2005). Introduction to statistical quality control. New York: John Wiley & Sons.
- Oliveri, G., Paolo, R., & Massa, A. (2012). Reliable diagnosis of large linear arrays – A Bayesian compressive sensing approach. IEEE Transactions on Antennas and Propagation, 60 10 4627–4636. doi: 10.1109/TAP.2012.2207344
- Page, E. S. (1954). Continuous inspection schemes. Biometrika, 41(1–2), 100–115. doi: 10.1093/biomet/41.1-2.100
- Peters, T. (1991). A conjugate gradient-based algorithm to minimize the sidelobe level of planar arrays with element failures. IEEE Transactions on Antennas and Propagation, 39 10 1497–1504. doi: 10.1109/8.97381
- Pozar, D. M., & Schaubert, D. H. (1995). Microstrip antennas: The analysis and design of microstrip antennas and arrays. Hoboken: John Wiley & Sons.
- Qian, M., Jen, J., Aliyazicioglu, Z., & Hwang, H. (2011, 24–27 October). Phase array antenna pattern design using the minimax algorithm. Proceedings of 2011 IEEE CIE international conference on radar, Chengdu, Vol. 1, pp. 342–346. doi: 10.1109/CIE-Radar.2011.6159547
- Rabhu, S., & Runger, G. (1997). Designing a multivariate EWMA control chart. Journal of Quality Technology, 29 1 8–15.
- Rajagopalan, S., Joshi, M., & Gudla, V. (2009). Detection of faults in antenna arrays using svm. Stanford, CA: Stanford University.
- Rawat, A., Yadav, R., & Shrivastava, S. (2012). Neural network applications in smart antenna arrays: A review. AEU-International Journal of Electronics and Communications, 66 11 903–912. doi: 10.1016/j.aeue.2012.03.012
- Rodriguez, J., & Ares, F. (1998). Optimization of the performance of arrays with failed elements using the simulated annealing technique. Journal of Electromagnetic Waves and Applications, 12 12 1625–1638. doi: 10.1163/156939398X00566
- Rodriguez, J., Ares, F., Palacios, H., & Vassal'lo, J. (2000). Finding defective elements in planar arrays using genetic algorithms. Progress in Electromagnetics Research, 29, 25–37. doi: 10.2528/PIER00011401
- Rodriguez-Gonzalez, J. A., Ares-Pena, F., Fernandez-Delgado, M., Iglesias, R., & Barro, S. (2009). Rapid method for finding faulty elements in antenna arrays using far field pattern samples. IEEE Transactions on Antennas and Propagation, 57 6 1679–1683. doi: 10.1109/TAP.2009.2019915
- Schjaer-Jacobsen, H., & Madsen, K. (1979). Algorithms for worst-case tolerance optimization. IEEE Transactions on Circuits and Systems, 26 9 775–783. doi: 10.1109/TCS.1979.1084700
- Tennant, A., Dawoud, M. M., & Anderson, A. P. (1994). Array pattern nulling by element position perturbations using genetic algorithm. IEEE Electronics Letters, 30 3 174–176. doi: 10.1049/el:19940139
- Vakula, D., & Sarma, N. (2009). Fault diagnosis of planar antenna arrays using neural networks. Progress in Electromagnetics Research M, 6, 35–46. doi: 10.2528/PIERM09011204
- Wang, W., & Feng, Q. (2010, 12–13 Jun). Pattern synthesis for antenna arrays using chaotic PSO algorithm. 2010 international conference on IEEE computer and communication technologies in agriculture engineering (CCTAE), Chengdu, Vol. 3, pp. 360–363.
- Xu, N., Christodoulou, C., Barbin, S., & Martínez-Ramón, M. (2007). Detecting failure of antenna array elements using machine learning optimization. 2007 IEEE antennas and propagation society international symposium, pp. 5753–5756.
- Yan, K., & Lu, Y. (1997). Sidelobe reduction in array pattern synthesis using genetic algorithms. IEEE Transactions on Antennas and Propagation, 45 7 1117–1122. doi: 10.1109/8.596902
- Yeo, B., & Lu, Y. (1999). Array failure correction with a genetic algorithm. IEEE Transactions on Antennas and propagation, 47 5 823–828. doi: 10.1109/8.774136