
ABSTRACT
An attractive transportation system which is also efficient has to include series of factors which are fast, repeatable, predictable and comfortable, simultaneously. In this paper, it has been tried to study one of transportation system problems related to vehicles’ traffic in Tehran specifically in one of the urban bottleneck in Resalat tunnel. The data of this study has been collected via Resalat tunnel’s cognitive system and it has been tried to compare situation before Bus Rapid Transit (BRT) construction and after it. At first, in order to give an appropriate solution, all data have been converted to distribution functions by fitness test and then three different scenarios helped improving the situation, each scenario has been run 18 times by Taguchi test. In conclusion, the BRT route construction made an improvement of 30%. In order to ensure about accuracy of subject, all steps of before and after construction have been made by simulation software and compared with the real world. Simulation software result shows that after BRT route construction, expected traffic volume in terms of waiting time improved by 30% and it makes urban transportation system efficient regarding vehicles traffic and transportation speed.
1. Introduction
A transportation system is attractive and efficient when it owns a series of factors which are simultaneously fast, repeatable, predictable and comfortable.
In densely populated cities, high speed can only be provided by separate infrastructures and routes, convenience of users is also important in the use of high-quality vehicles and stations. Predictability of the transportation system requires great control and support in dealing with affecting external factors.
These are characteristics found in modern subways and light rail systems; rail transportation system needs specific infrastructure, vehicles and high level of control. In contrast, the traditional bus fleet does not need anything but ordinary vehicles to transportation passengers. But ordinary bus system does not pay enough attention to comfort, trip time, density and controlling affecting factors on transportation. BRT is a transportation system bringing the benefits of rail system with low cost and more flexibility plus the benefits of bus system simultaneously.
2. Literature review
BRT system in many countries underwent rapid changes in terms of unique index of this public transportation (Deng & Nelson, Citation2013). In China, BRT has been adopted as a key strategy to reduce traffic problems. In this paper, performance and effects of BRT in Beijing has been studied as a first complete BRT system in China. This in turn is showing the role of Intelligent Transportation Systems technology on operational efficiency, technical performance and cost related topics regarding BRT. Effects of BRT in changing trip behaviour, traffic environment and properties development of Beijing have been studied in this paper (Deng & Nelson, Citation2013). The first phase of the BRT system in Johannesburg city in South Africa called Rea Vaya implemented between 2009 and 2011. In this paper, in addition to elaborating the traffic characteristics of transportation in Johannesburg, unofficial transportation system (Minibus, Taxi) has been stated as a saturated and limited system always has been controversial in terms of political considerations in several aspects. In this paper approaches regarding management and planning of a BRT system have been discussed in order to maximize potential solutions to overcome problems facing organizing informal users (taxi driver – irresponsible) in South Africa and other developing countries using analysis and studying the life cycle (Venter, Citation2011). In a research (Ancora, Nelli, & Petrelli, Citation2012), a new model of dynamic micro-simulating using Arena Racol software has been used to simulate and evaluate the BRT system. Validation will give you a comparison between model results and what is concluded through analytical model. Finally, the model has been used in a real case study for implementation of a new BRT lane in Rome. In a study aiming to help the performance evaluation of BRT systems in Delhi, a quantitative performance method using micro-simulating technique has been offered (Sekhar & Velmurugan, Citation2013).
The performance of this system has been evaluated by trip time index and traffic speed. The mean speed of vehicles obtained from VISSIM is compared with a mean speed of vehicles and buses in normal routes of project area in terms of delay time and speed (Gautam Raj et al., Citation2013). A BRT system of Jakarta has been started to work with allocating motorcycles and vehicles to high speed bus route. In this paper index of air pollution in the project area has been evaluated and it has been shown that after BRT lane construction, pollutant gases (NOx, CO, PM10) have been reduced in comparing with before construction specifically in this lane (Nugroho, Fujiwara, and Zhang, Citation2010). Istanbul BRT network (Metro bus) includes 42 km route (Alpkokin & Ergun, Citation2012). Its other properties consisting three main parts have been completed till the year 2009 in dense traffic areas. After opening, while the system has the capacity of transporting about 24,000 people in one hour in one way and 620,000 passengers in a day and this system attracts so many passengers of private vehicles and public transportation. In a paper on literature review of BRT planning (Henke, Citation2001), and its function of planning, and in addition to development of sustainable development of Istanbul’s traffic has been studied. BRT can be described as an improved traditional bus transportation system with combination of desirable operational characteristics of rail transportation, including separated routes from traffic network, modern stations, traffic priority in crowded junctions, smart techniques of faire receiving, strong navigation and smart transportation system (Sekhar & Velmurugan, Citation2013).
The terms of BRT are used all over the world in order to describe a bus transportation system which has a special lane for traffic even though it does not include other elements of BRT. Effects of BRT system implementation directly depend on local system design and its extension. Although BRT lane construction has many benefits, but without considering first studies about the implementation and routing, it will have unclear effects on other traffic methods.
In recent years, so many BRT systems have been implemented all around the world. Although it seems that transportation system still does not have any appropriate methodological tools for planning and evaluating BRT system (Levinson & Mentor, Citation2003). In order to solve this problem using simulation in before construction researches have been become so prevalent.
Computer simulation provided a very strong tool for analyzing dynamic and complex problems such as ones with transportation and traffic (Burghout, Citation2005). Great numbers of papers in the field of modelling and implementing BRT system have been used computer simulation as an appropriate method to make an image of after construction situation which will be more like the reality (Nugroho et al., Citation2010).
Some simulation software, which are wildly used in simulating transportation networks are as follows: PARAMICS, SYNCHRO, DYNAMIT, VISSIM, COMMUTER, TRANSYT.
There are three groups of scales in simulation including Microscopic, Mesoscopic and Macroscopic each of them has their own goals, indexes also its pros and cons.
Macroscopic simulation tries to model traffic in a general level and normally using aggregated traffic flows (Cré, Rupprecht, and Bührmann, Citation2012). These models describe traffic evaluation on time and spacing using series of differential equations. In general, microscopic simulation describes traffic at the highest level of detail. While macroscopic models consider traffic as a flow, microscopic models tend to explain the behaviour of each vehicle separately and analysis occurred interactions in the network. Third group acts as the median of the last two groups which uses general state of macroscopic and vehicle interactions in microscopic models. In recent years, many case studies regarding implementing, analysis and route planning of BRT have been done in world different cities (Zhongyi and Guangchuan, Citation2013). In this paper, some tools are offered for simulating a bus network that has the ability to be analysed and evaluated in different times and places with considering behaviours of entities (buses, passengers) for solving four problems – traffic flow disorderliness, long-distance transportation, long waiting times for buses and heavy traffic in Beijing. Using micro-simulating software VISSIM solutions such as construct specific lane, shortening trip distances, increasing bus numbers have been offered in this paper.
For overcoming traffic problems at Nicosia city in Cyprus improved a microscopic simulation model (Hu & Papageorgiou, Citation2013). In order to evaluate BRT efficiency it is needed to study this method’s effect on other transportation methods considering the appropriate level of details. This requires recording the interactions between changes in the transportation system and thus the behaviour of passengers (Hu & Papageorgiou, Citation2013). Regarding heavy traffic of Resalat highway in Tehran in before Resalat tunnel, Tehran municipal decided to construct a specific BRT route for Bus in past years and 10 stations have been constructed in this route before reaching the Resalat traffic axis in the direction of east to west. The complex traffic situation of this axis makes forecasting effects of this specific lane construction on traffic indexes such as vehicles queue length, vehicles and buses and passengers waiting time hard and that caused the stopping project construction.
Hence, in this research, comparing the traffic flow of this axis before and after BRT construction using enterprise dynamics (ED) simulating software has been studied. Then, in the case of constructing specific lane for reducing possible traffic three scenarios is presented and examined.
3. Resalat tunnel’s location
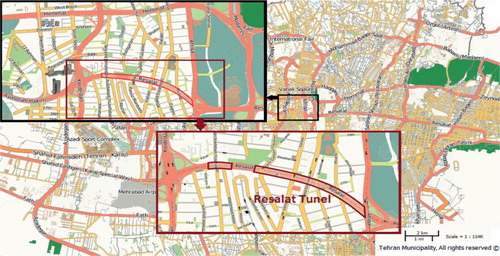
Resalat tunnel with a length of approximately one kilometre is located between Africa and Kurdistan highways in the northern edge of the Tehran Traffic Control Plan and it is included heavy traffic volume of vehicles on the parallel axes. Resalat tunnel is comprised two travelling tunnel with three lane. This is the first intelligent tunnel in Iran, which is used in it a set of control systems in order to provide the ideal conditions for the safe passage of vehicles. Figure shows Resalat tunnel geographically.
Figure 1. Resalat tunnel’s location.
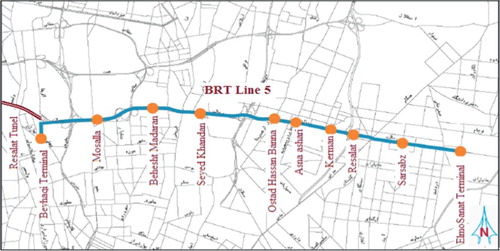
To facilitate the movement of passengers from east to west and vice versa, reducing travel time and streamline traffic, it is decided to establish a BRT route from the terminus of Science and Technology University in east highway to west Hakim highway, but due to the unknown impact of the passes through route in Resalat tunnel, the implementation of BRT bus route before the end of the tunnel has been stopped and the route has been diverted to the Beyhaghi terminal. BRT route 5 from Science and Technology University to the Beyhaghi terminal is presented in Figure .
Figure 2. Opened BRT route 5 from Science and Technology University to the Beyhaghi terminal.
3.1. Conceptual model
In this study, we have tried to use data from approximate of Resalat tunnel and from varied sources in order to compare traffic conditions before and after construction BRT on east to west route of Resalat tunnel by means of the ED simulation software program. This comparison is based on passenger vehicle queue length and waiting time for passengers.
As, it is mentioned, before the tunnel, current route has three main routes and a route which is tardy in high-density mode for up to five vehicles moving together. Tunnel entrance also has three normal routes and there is a route in case of emergency. Passing through the emergency route in normal time is not allowed except the ambulance, police and firefighters. Meanwhile, speed limitation for vehicles is 60 km/h and redirection in the whole of the tunnel is restricted. All of them are under the control by camera recorder and offensive vehicles will be fined online by it. It means that in whole of tunnel three vehicles are able to move. Conversion of five lanes to three lanes and speed limitation make the long queues of vehicles before the tunnel.
However, by constructing a particular route (for the BRT buses and emergency vehicles) on the entire route of highway tunnel based on some parts of the highway that BRT route is implemented, vehicle moving in whole over the route is four vehicles side by side but traffic condition into the tunnel is same as stated above. BRT buses movement on this route could have two opposed effects simultaneously, such as reduce the use of passenger cars and consequently reduce the volume of traffic before the tunnel and increase the rate of entry of vehicles into the tunnel (transforming four lanes to three lanes instead of five lanes to three lanes). Figure shows this statement schematically. The arrival rate of vehicles into the tunnel in this case is extracted in 10 consecutive days, according to received data from the tunnel entrance in rush-hour traffic volumes.
Figure 3. The rate of entry of cars to the current mode in tunnel based on incoming data.
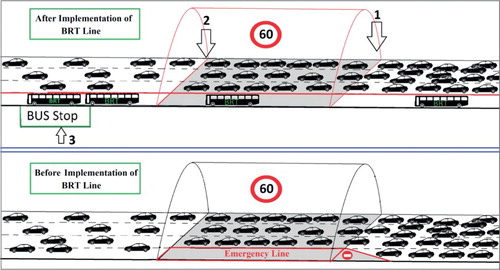
In Figure , up and down arrows are the following assumptions before construction of the BRT route:
Tunnel entrance, where four lanes of vehicles transform into the three lanes. According to the data for 10 consecutive days in reconstruction, vehicle arrival rate into the tunnel after the construction is calculated based on the narrowing ratio and proportion in both directions.
Tunnel output, if the queue length of vehicles in every lane of output sites is prolonged over the whole tunnel, vehicles are not able to enter into the tunnel.
BTR station, 30 seconds are considered for getting off and getting on the bus. The distribution of time is between the arrival times of the buses in station according to data from the last construction station on route 5 of BRT (Mosalla station) during peak hour traffic.
3.2. The current status of the tunnel
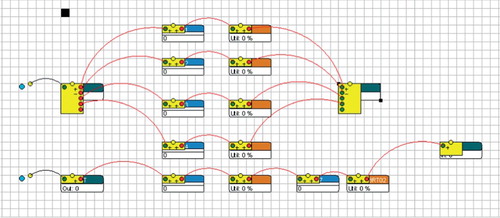
First, Data should be gathered in order to study about the current status of the tunnel, then the current problems should be reconsidered and analysed. The current status has four lanes as well as an emergency lane for firefighting and ambulance. Most of time vehicles are driven in five lanes and they will be in four lanes as soon as entering the tunnel. In Figure this issue is shown.
Figure 4. Simulation model for scenario 1 in ED simulator.
Currently no vehicles are allowed to pass through the emergency lane except firefighting, ambulance and police cars. Therefore, collected data is considered for waiting time of vehicles, number of vehicles in the queue and the average cost per vehicle. According to an experimental design, the model will be run 18 times to ensure the accuracy of answers carefully. Executive data are shown in Table . Collected data must be transformed from fitted test to distribution functions in order to simulate it in the ENTERPRISE DYNAMIC simulation environment. Distribution functions from fitted test are shown in Table .
Table 1. Distribution function obtained from the fit test.
In order to estimate the proper distribution function for collecting data, it has been tried to convert all operations data to the distribution function by means of Minitab software. For instance, collected data for vehicles travelling is estimated about 325 and the distribution function is computed as a normal distribution with mean 7199 and standard deviation 27.39. Anderson Darling index of it is equal to 0.22 and P-Value is more than error of type I, equal to 0.832, as well. Thus, hypothesis test of a normal distribution is not rejected. Since the fitted test is not limited in distribution and is suitable for any number of samples, this distribution is selected for the fitted tests. The significance level is considered as 5% (confidence level = 95%) for the test and therefore all of the estimated distribution is validated. The estimated distributions of the described processes are mentioned in Table and collected data from 18 runs are shown in Table .
Table 2. Collected data from 18 runs.
3.3. After the construction of the BRT
After activation of the BRT, assuming the special vehicles can also use this route, as shown in Table , the functions are related to the gamma distribution. At this time, as soon as they arrive to the tunnel, must use the allowed routes and pass through four lanes such as before construction. The information about simulation is shown in Table . Figure also exhibits after the construction of the BRT.
Table 3. The information of the construction of the BRT.
By comparison to the before and after of BTR construction, it can be studied that a majority of passengers is transported by the BRT and it is assumed about 130 passengers per BRT and the number of passengers per vehicles are three individuals. If both systems are evaluated in terms of average waiting time, waiting time of BRT in the queue is much less and is about half of the time. In terms of traffic volumes, a lot of vehicles are in waiting time queue in the tunnel and are not affordable while the BRT is not.
4. Validation and verification of the model
The results obtained from the simulation model have an impact on management decisions. Therefore, the results should be valid perfected. Considering the above assumptions, the simulation model has been implemented. Verify and validate the model by comparing paired (real system and the simulation system) is done. Statistics related to model, available and an average number of atoms of the system, cycle time, the percentage of service transfer, waiting time of vehicles, the average output, throughput values of atoms, etc. to be compared with the values of the real system. Type I error rate is equal to 95% and P-Value will be 0.846. P-Value is greater than 0.05 and as a result; the assumption of normality is accepted and model validation is confirmed.
5. Definition of simulation scenarios
Through experiments, bottlenecks are indicated by means of simulation model and in order to resolve bottlenecks and improve them, it is imperative that someone define scenarios that reduce the average waiting time in the traffic system. Considering the status of BRT after construction, three scenarios could be defined to improve the status of after construction as follows:
Scenario 1: Assuming 5 passenger vehicles are allowed to pass through BRT routes, peak during hours, but it is not allowed for others.
Scenario 2: Assuming if the queue length of normal vehicles exceeds, these vehicles are allowed to travel through BRT route.
Scenario 3: Assuming if the queue length of normal vehicles exceeds, all vehicles are allowed to travel through BRT route.
A simulated model for situation of scenario 1is designed and it is shown in Figure .
The results of implementation for this scenario are given in Table .
Table 4. The results of implementation for scenario 1.
As can be seen in Table , 5-passenger vehicles increase waiting time of BRT and therefore the amount of money in people’s movement which is 9 times of the amount of cost for travelling with 3-passenger vehicles and average queue time is much less than other vehicles.
Scenario 2: Assuming if the queue length of normal vehicles exceeds, these vehicles are allowed to travel through BRT route. In this scenario, traffic policeman allows other vehicles pass through BRT route. The results of implementation for this scenario are given in Table .
Table 5. The results of implementation for scenario 2.
As we can see in Table , according to vehicle traffic volume, BRT waiting time in the queue is less than vehicles waiting time in the queue. In this scenario, due to that every vehicle can pass through BRT route, therefore the amount of money is less than scenario 1.
Scenario 3: Assuming if the queue length of normal vehicles exceeds, all vehicles are allowed to travel through BRT route. The difference between this scenario and scenario 2 is at the height of the peak, traffic volume is greater than usual ant it should be reduced by using BRT route. The results of implementation for this scenario are given in Table .
Table 6. The results of implementation for scenario 3.
As can be seen in Table , due to the volume of vehicle traffic on BRT route, numbers of vehicles have growth and average cost for BRT is much less than the previous scenario.
The results of scenarios as well as the results of tables represent that Scenario 1, compared with the other scenarios, would be a priority because the queue waiting time is much lower, and the volume of money and the large number of vehicles can pass through BRT route. Therefore, this scenario can be better than others.
6. Conclusion
In this paper, in order to forecast BRT route construction of Resalat tunnel and improvement of vehicles, traffic and reduction of waiting time, it has been defined three scenarios for optimization of problem model. Considering different situation make problem the model seems more like reality and then the model has been solved in different situation. The model has been run 18 times that each time considered one day because of Taguchi design method, and it has been tried to analysis each scenario Based upon Taguchi method this model runs 18 times (every day is considered one time) for every scenario as well as data gathered from current occasion of Resalat tunnel. Analyzing model solution gives this ability to decide about adding a new BRT route that will result in achieving a steady state consequently this causes more vehicle traffic in peak time, reduction in queue waiting time by 30% and it will also minimize average of the queue waiting time entire the system. If each of considered hypotheses would have changed, it will result in system changes. In future research, making tunnel one- way direction, smart situation lights and the Gordon smart system may cause acceleration in affairs and improvements in the current situation.
Disclosure statement
No potential conflict of interest was reported by the authors.
References
- Alpkokin, P., & Ergun, M. (2012). Istanbul Metrobüs: First intercontinental bus rapid transit. Journal of Transport Geography, 24, 58–66. doi: 10.1016/j.jtrangeo.2012.05.009
- Ancora, V., Nelli, C., & Petrelli, M. (2012). A microsimulation model for BRT systems analysis. In 15th Meeting of the EURO Working Group on Transportation, Procedia – Social and Behavioral Sciences (pp. 1250–1259). Roma.
- Burghout, W. (2005). Mesoscopic simulation models for short-term prediction (PREDIKT project report CTR2005), 3. Linköping. http://www.ctr.kth.se/publications/ctr2005_03.pdf.
- Cré, I., Rupprecht, S., & Bührmann, S. (2012). The development of local implementation scenarios for innovative urban transport concepts: The NICHES+ approach. Procedia-Social and Behavioral Sciences, 48, 1324–1335. doi: 10.1016/j.sbspro.2012.06.1108
- Deng, T., & Nelson, J. D. (2013). Bus rapid transit implementation in Beijing: An evaluation of performance and impacts. Research in Transportation Economics, 39, 108–113. doi: 10.1016/j.retrec.2012.06.002
- Gautam Raj, G., Ravi Sekharb, C., & Velmurug, S. (2013). Micro simulation based performance evaluation of Delhi bus rapid transit corridor. In 2nd Conference of Transportation Research Group of India (2nd CTRG), Procedia – Social and Behavioral Sciences (pp. 825–834). New Delhi.
- Henke, C. (2001). Bus rapid transit grows up into a new mode. Metro, 97(1), 43–44, 46, 50, 52.
- Levinson, H. S., & Mentor, U. I. (2003). Bus rapid transit on city streets how does it work.
- Nugroho, S. B, Fujiwara, A., & Zhang, J. (2010). The influence of BRT on the ambient PM10 concentration at roadside sites of Trans Jakarta corridors. Procedia Environmental Sciences, 2, 914–924. In ISEIS 2010 International Conference on Environmental Informatics. doi: 10.1016/j.proenv.2010.10.103
- Hu, S., & Papageorgiou, N. S. (2013). Handbook of multivalued analysis: Volume II: Applications. Athens: Springer Science & Business Media.
- Sekhar, C. R., & Velmurugan, S. (2013). Micro simulation based performance evaluation of Delhi bus rapid transit corridor. Procedia-Social and Behavioral Sciences, 104, 825–834. doi: 10.1016/j.sbspro.2013.11.214
- Venter, C. (2011). The lurch towards formalization: Lessons from the implementation of BRT in Johannesburg, South Africa: Thredbo 12. In International Conference Series on Competition and Ownership in Land Passenger Transport.
- Zhongyi, Z., & Guangchuan, Y. (2013). Feasibility of unconditional transit signal priority considering delay savings at signalized intersections: A case study of Dalian BRT line No. 1. Procedia-Social and Behavioral Sciences, 96, 828–837. doi: 10.1016/j.sbspro.2013.08.094