
ABSTRACT
This paper aims to study the dynamical behaviours of a prey–predator system, where both the prey and predator show herd behaviours. Positivity, boundedness, stability of equilibrium points, et cetera, are discussed in deterministic environment. To incorporate the effect of fluctuating environment, we have perturbed the birth rate of prey species and death rate of predator species by Gaussian white noises. Then the resulting model is cultured by the method of statistical linearization to study the stability and non-equilibrium fluctuation of the populations in stochastic environment. Numerical simulations are carried out to validate our analytical findings. Implications of our analytical and numerical findings are discussed critically.
1. Introduction
In Community ecology, understanding various ecological relationships is of enormous importance. Ecological relationships might be oppositional or symbiotic. Among these, prey–predator relationship (which is an oppositional relationship) is considered to be an extremely important one. It is true that the preys always try to develop the methods of evasion to avoid being eaten. However, it is certainly not true that a prey–predator relationship is always harmful for the preys, it might be beneficial to both. Further, such a relationship often plays an important role to keep ecological balance in nature.
So far as the growth of an individual is concerned, Thomas Robert Malthus (an English scholar) was considered to be the pioneer to give the first law of population growth at the end of eighteenth century (Citation1798). If denotes the population density at time T, then the Malthus growth equation is given by
(1) where b and d are the per capita rates of birth and death, respectively, r is a called the
intrinsic per capita growth rate of the population. This states that a population will grow (or decay) exponentially. Although Malthusian growth model became popular at that time, but there should be no denying that this is contrary to our common sense as the resources (e.g. space, food, essential nutrients) are limited in nature. Malthusian growth function was later modified into a logically acceptable function, which has become extremely popular, and it is considered even today. This is the famous logistic growth function. The function is introduced in 1838 by the Belgian mathematician Pierre Francois Verhulst (Citation1838), and later it is rediscovered in Citation1920 by American biologists Reymon Pearl and Lowell Reed. If
denotes the population density at time T, then the logistic growth equation is given by
(2) where r is the intrinsic per capita growth rate and K is the carrying capacity of the environment. The logic behind this is very simple. As the resources (e.g. space, food, essential nutrients) are limited, every population grows into a saturated phase from which it cannot grow further; the ecological habitat of the population can carry just so much of it and no more. This suggests that the per capita growth rate is a decreasing function of the size of the population, and reaches zero as the population achieved a size K (in the saturated phase). Further, any population reaching a size that is above this value will experience a negative growth rate. The term
may also be regarded as the loss due to intraspecies competition.
Mathematical modelling of prey–predator interactions was started in 1920s. Interestingly, the first prey–predator model in the history of theoretical ecology was developed independently by Alfred James Lotka (a US physical chemist) and Vito Volterra (an Italian mathematician) (Lotka, Citation1925; Volterra, Citation1926). Subsequently, this model has been used as a machine to introduce numerous mathematical and practical concepts in theoretical ecology. Many refinements of the Lotka–Volterra model have also been made to overcome the shortcomings of the model and to get better insights of prey–predator interactions. If we summarize the basic considerations behind such modelling, it would be evident that the most crucial elements of prey–predator models are the choices of growth function of the prey and functional response of the predator.
We have already mentioned that the logistic growth function might be considered as the most suitable function to describe the individual growth of the prey. Let us now turn our attention to the interaction of the prey and its predator. The function that describes the number of prey consumed per predator per unit time for given quantities of prey and predator is known as the functional response or
trophic function. Depending upon the behaviour of populations, more suitable functional responses have been developed as a quantification of the relative responsiveness of the predation rate to change in prey density at various populations of prey. In this connection, Holling family of functional responses are the most focused (Holling, Citation1959a, Citation1959b). The Holling type-I functional response (or the Lotka–Volterra functional response) is given by , where
is the prey density at time T and
is a constant. In particular, the Holling type-II functional response has become extremely popular, and served as basis for a very large literature in prey–predator theory (see Maiti & Samanta, Citation2005; Murray, Citation1993; Xiao & Ruan, Citation2001, and references therein). The type-II functional response includes the fact that a single individual can feed only until the stomach is not full, and so a saturation function would be better to describe the intake of food. This is similar to the concept of the law of diminishing returns borrowed from operations research, via a hyperbola rising up to an asymptotic value. In other words, the functional response would be of the following form
(3) where
is the prey density at time T, α is the search efficiency of the predator for prey,
is the average handling time for each prey.
A herd or pack is a social grouping of different animals of the same species. When a species shows herd behaviour, the individuals of the species show a collective social behaviour, and each individual chooses a behaviour that corresponds to that of the majority of other members (e.g. all moving in the same direction at a given time). There are several reasons for herd behaviour. For a prey species, herding might work as a protection against predators (predators might hesitate to attack a large group of animals). In case of predators, a pack might be more effective at pulling down a herd of prey than a single animal.
Now, when a population lives forming groups, then all members of a group do not interact at a time. There are many reasons for this herd behaviour, such as searching for food resources, defending the predators. As a consequence, it is necessary to search for suitable form of functional response to describe this social behaviour. Only a few works have so far tried to enlighten this area. These works demonstrated an ingenious idea that suitable powers of the state variables can account for the social behaviour of the populations. For example, to explore the consequence of forming spatial group of fixed shape by predators, Cosner, DeAngelis, Ault, & Olson (Citation1999) introduced the idea that the square root of the predator variable is to be used in the function describing the encounter rate in two-dimensional systems. Similarly, for three-dimensional systems, the two-third power of the predator in the encounter rate would better describe such group behaviour by predators. Unfortunately, such an idea has not been used by the researchers for about a decade. The work of Chattopadhyay, Chatterjee, & Venturino (Citation2008) may be regarded as a strong recognition of this concept. Then came the most innovative works of Ajraldi, Pittavino, & Venturino (Citation2011) and Braza (Citation2012), which gave such modelling a new dimension. We recall their central ideas in the next paragraph.
Let X be the density of a population that gathers in herds, and suppose that herd occupies an area A. The number of individuals staying at outermost positions in the herd is proportional to the length of the perimeter of the patch where the herd is located. Clearly, its length is proportional to . Since X is distributed over a two-dimensional domain,
would therefore count the individuals at the edge of the patch. Thus, when attack of a predator on this population is to be modelled, the functional response should be in terms of square root of prey population. This is the main idea of Ajraldi et al. (Citation2011). Braza (Citation2012) has placed a strong emphasis on this concept, and he has introduced a new functional response, where the prey density in Equation (Equation3
(3) ) is replaced by its square root. That is, the functional response takes the form
(4)
It is a fact that environmental fluctuations have a serious impact on real biological systems, and usually such fluctuations do not strictly follow deterministic laws. Unfortunately, most of the models in literature are cultured in deterministic framework. But if one includes stochastic noise in the system, it would definitely conceive more realistic dynamics. Such modelling has forced the modellers to use stochastic differential equations. Among the pioneers of the research in this area, the names of Lorenz (Citation1963) and May (Citation1974, Citation1976) may be mentioned. Renshaw (Citation1995) has also laid down a strong emphasis on this area. Analysing such models is really difficult, and there is insufficiency of mathematical tools also. Only a few techniques of linearization of some nonlinear stochastic differential equation is now available (interested readers might see the references Gardiner, Citation1983; Nisbet & Gurney, Citation1982; Valsakumar, Murthy, & Ananthakrishna, Citation1983).
Recently, some prey–predator models with herd behaviour of the prey are cultured in the literature (Ajraldi et al., Citation2011; Bera, Maiti, & Samanta, Citation2015, Citation2016; Braza, Citation2012; Maiti, Sen, Manna, & Samanta, Citation2016), but herd behaviour of the predator has not so far been considered in the literature (except Melchionda, Pastacaldi, Perri, & Venturino, Citation2014). Here we have considered a prey–predator model, where both the prey and the predator show herd behaviour. The deterministic behaviours are studied. Then the effect of fluctuating environment is studied by incorporating Gaussian white noises.
The rest of the paper is organized as follows. In Section 2, we present the mathematical model with basic considerations. Deterministic dynamics of the system including, boundedness and positivity, stability of equilibrium points, et cetera, are discussed in Section 3. Section 4 deals with the stochastic version of the model and its analysis. Computer simulations of variety of solutions of the system are performed; and the results are presented in Section 5. Section 6 contains the general discussion of the paper and significance of our analytical findings.
2. The mathematical model
At time T, let denotes the density of the prey, and
denotes the density of the predator. We assume that both the preys and predators live in herds. These considerations motivate us to introduce the following prey–predator system under the framework of the following set of nonlinear ordinary differential equations:
(5) The parameter r is the intrinsic growth rate of the prey, K is the carrying capacity of the prey, δ represents the death rate of the predator. As the populations exhibit herd behaviour, here we have used the modified functional response (Equation4
(4) ) (suggested by Braza, Citation2012) to represent the interaction between prey and predator. So α,
, β stand for the search efficiency of the predator for prey, the average handling time for each prey, and the biomass conversion rate, respectively. It is an obvious assumption that all the parameters are positive.
To reduce the number of parameters the system (Equation5(5) ), we use the following scaling
Then the system (Equation5
(5) ) takes the following form (after some simplifications)
(6) where
,
,
,
.
3. Deterministic dynamics
3.1. Positivity and boundedness
Positivity and boundedness of a model guarantee that the model is biologically well behaved. For positivity of the system (Equation6(6) ), we have the following theorem.
Theorem 3.1.
All solutions of the system (Equation6(6) ) that start in
remain positive forever.
The proof is simple and therefore it is omitted. The next theorem ensures the boundedness of the system (Equation6(6) ).
Theorem 3.2.
All solutions of the system (Equation6(6) ) that start in
are uniformly bounded.
Proof.
Let be any solution of the system (Equation6
(6) ).
From the first equation of (Equation6(6) ), we have
which implies that
(7)
Let
Then, for large t, we have
Therefore
Applying the theory of differential inequalities, we obtain
and for
Thus, all the solutions of (Equation6
(6) ) enter into the region
Hence the theorem.
3.2. Equilibria
In this section, we find the equilibrium points of the system (Equation6(6) ) and study their stability. The nullclines are shown in Figure . The following lemma gives the equilibrium points with the conditions of their existence.
Figure 1. Nullclines of the system (Equation6(6) ) for a=0.4, b=0.15, c=0.25, and d=0.1.
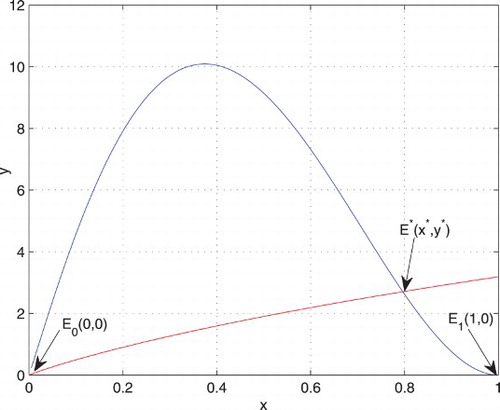
Lemma 3.3.
The trivial equilibrium of the system (Equation6
(6) ) always exists. There is one axial
predator-free
equilibrium point
which also exists unconditionally. The interior or coexistence equilibrium
exists if and only if the equation
(8) has a positive root. If this condition is satisfied,
is a positive root of (Equation8
(8) ) and
.
3.3. Behaviour of the boundary equilibrium points
It is not possible to linearize the system (Equation6(6) ) about
and
. However, the following logical arguments might provide some ideas of the the dynamics near these points.
When the predator disappears, the system (Equation6(6) ) reduces to one equation. Then the prey follows a logistic growth and ultimately approaches toward 1. When the prey is washed out, the predator population cannot survive. Actually, when x=0, from the second equation of (Equation6
(6) ), we see that y decays to zero exponentially. This makes sense biologically, because the predators considered here are specialistic predators. Hence the disappearance of both populations is a possibility in model (Equation6
(6) ).
We now try to uncover the singular dynamics near origin. It is reasonable to assume sufficiently small with the initial value
near to origin so that
or higher order terms vanishes, and
. Therefore, near the origin, we have
Let
and
both exist and be such that
. Then, for every ε with
,
such that
and
. Therefore,
and
for
This implies that both the populations might disappear if
.
3.4. The interior equilibrium and its stability
Now, we consider the stability of the most important equilibrium . We have the following Jacobian matrix at
:
where
The characteristic equation of
is
where
Then we have the following theorem guaranteeing the stability of
.
Theorem 3.4.
The necessary and sufficient condition for local asymptotic stability of the interior equilibrium is that P>0 and Q>0.
It is easy to see that, if , then P>0 and Q>0. Therefore, we have the following theorem.
Theorem 3.5.
If then
is locally asymptotically stable.
Another simple sufficient condition for local asymptotic stability of is the following.
Theorem 3.6.
If then
is locally asymptotically stable.
Proof.
If the condition of the theorem is satisfied, then it is easy to notice that P>0 and
Hence, by Theorem 3.4,
is locally asymptotically stable.
It would be interesting if we can establish some sort of global behaviour of the interior equilibrium. Let exists and be positive. We define
. Then we have the following theorem.
Theorem 3.7.
If is locally asymptotically stable with
then
attracts all solutions of the system (Equation6
(6) ) lying in Ω.
Proof.
Let us write the first equation of the system (Equation6(6) ) as
, and the second equation as
. Then, for all
, we notice that
Therefore, by Bendixson's criterion, there is no periodic orbit in Ω. Hence the theorem follows from the Poincaré-Bendixson theorem.
4. The stochastic model
In this section, we formulate the stochastic version of the model (Equation6(6) ) to take take into account the influence of environmental noise. The the basic mechanisms and factors that are mostly affected by environmental fluctuations are the prey growth rate and predator death rate (Dimentberg, Citation1988; Maiti, Jana, & Samanta, Citation2007; Maiti & Samanta, Citation2005, Citation2006; Wollkind, Collings, & Logan, Citation1988). Here we consider the fluctuation in random environment as perturbation in the growth rate of the prey and the death rate of the predator. Then the deterministic system (Equation6
(6) ) is modified to the following stochastic system:
(9) where the perturbed terms
are assumed as the independent Gaussian white noises that satisfy the conditions
Here
are the intensities or strength of the random perturbation, δ is the Dirac delta Function and
represents the ensemble average.
In model (Equation9(9) ), we are concerned with stochastic differential equations which are driven by Gaussian white-noises. There equations are usually interpreted as Itô stochastic differential equations. It is well known that, Gaussian white noise, which is a delta-correlated random process, is very irregular, and it is one of the most useful noises to model rapidly fluctuating phenomenon. Of course, true white noises do not occur in nature. However, it is now well recognized that thermal noise in electrical resistance, the force acting on a Brownian particle and climate fluctuations, disregarding the periodicities of astronomical origin, etc., are white to a very good approximation. These motivate the researchers to use white noises in natural systems to model fluctuating phenomena. Further, it can be proved that the process
a solution of (Equation9
(9) ), is Markovian if and only if the external noises are white (Bera et al., Citation2016; Horsthemke & Lefever, Citation1984). These explain the importance and appeal of the white noise idealization.
Let us use the transformation where
is the equilibrium of the deterministic system (Equation6
(6) ). Now expanding and neglecting the terms with degree more than two we have the following pair of Itô stochastic differential equation (non-linear coupled bivariate Langevin equation):
(10) where
4.1. Statistical linearization: moment equations
Various techniques have been derived by several researchers and mathematicians to study the complexity of nonlinear stochastic differential equations (Haken, Citation1983; Nisbet & Gurney, Citation1982). The efficacy of moment technique to linearize the above system is mentioned by many researchers (e.g. Bera et al., Citation2016; Jumarie, Citation1995). Here we study the behaviour of the stochastic model (Equation9(9) ) about the steady state by the technique of statistical linearization developed by Valsakumar et al. (Citation1983). Using this technique, the following pair of linear equation are obtained from the nonlinear system (Equation10
(10) ):
(11) where the errors for linearzitaion are given by
(12) The unknown coefficients
of the equations (Equation11
(11) ) are determined from the minimization of the averages of the squares of the errors (Equation12
(12) ). To compute the unknown coefficients, we use the similar techniques used by Valsakumar et al. (Citation1983), Bandyopadhyay & Chakrabarti (Citation2003), and Maiti & Samanta (Citation2006):
Also using the following expressions for higher moments derived by Valsakumar et al. (Citation1983):
(13) the expressions for
are given by
(14) The coefficients are the functions of the parameters involved with the model system and also of the different moment involving u and v. Simple calculations lead to the system of equations of the first two moments:
(15) where the following relations have been used:
Let us now assume that the system size expansion is valid such that the correlations and
given by (Equation15
(15) ) decrease with the increase of the population size and they are assumed to be the order of the inverse of the population size N, that is,
Therefore, using the expressions (Equation14(14) ), (Equation15
(15) ) and keeping the lowest order terms and replacing the averages
and
by their steady state values
(Nicolis & Prigogine, Citation1977), we get the following reduced equations for second-order moments:
(16)
4.2. Non-equilibrium fluctuation and stability analysis
The characteristic equation of the coefficient matrix of system (Equation16(16) ) are given by
that is,
(17) where
To solve Equation (Equation17
(17) ) let us replace μ by m−A and that leads to get the standard cubic
(18) with
and
Now two possible cases arise depending on the value of H.
Case-1: H<0
In this case, all roots of equation (Equation18(18) ) are real and given by 0,
and hence the roots of the original equation (Equation17
(17) ) becomes
Here all the eigen values are real. They are negative if Hence the system (Equation16
(16) ) is stable if A>0, C>0 and
. So stability of the deterministic model does not guarantee the stability of the stochastic model. For
and C>0, the system is stable for deterministic model but not for stochastic model. On the other hand if the deterministic model is unstable, that is, A<0 the system must be unstable in random environment also.
Case-2: H>0
In this case, roots of equation (Equation18(18) ) are given by 0,
and hence the roots of the original equation (Equation17
(17) ) becomes
Here the eigen values are with negative real part if and only if A>0. Consequently the system will either be stable in both the deterministic and stochastic environments or be unstable in both environments.
5. Numerical simulation
In this section, we present computer simulations of some solutions of the system (Equation6(6) ). These simulations are performed to validate some of the analytical findings of the last two sections.
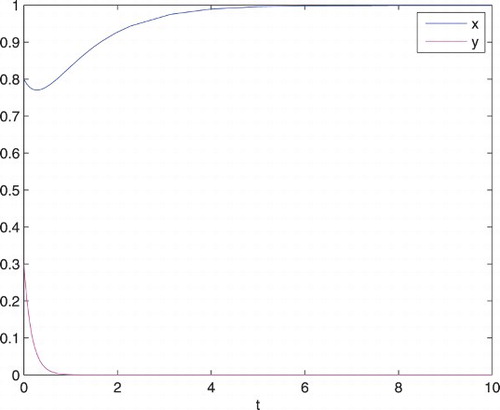
First, we take the parameters of the system (Equation6(6) ) as a=0.2, b=1, c=0.01 and d=6. Then we see that the predator dies out and the prey approaches 1 (see Figure ).
Figure 2. Behaviour of the system (Equation6(6) ) with time when a=0.2, b=1,
d=6,
, and
.
Next we consider the stability of the interior equilibrium. We choose the parameters of the system (Equation6(6) ) as a=0.4, b=0.15, c=0.25 and d=0.1. Then there is a unique interior equilibrium point
for which P=0.725>0 and Q=0.038>0. Hence by Theorem 3.4,
is locally asymptotically stable. The corresponding phase portrait for different choices of
is depicted in Figure . Clearly the trajectories converge to
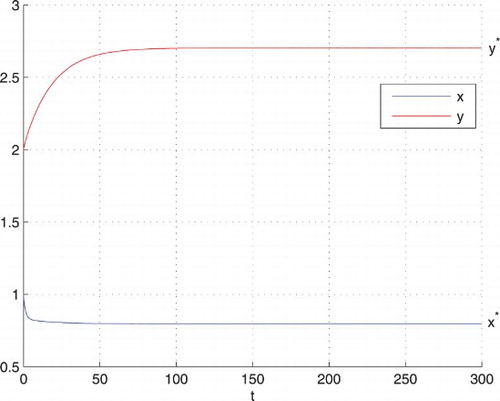
. Figure shows the behaviour of x and y with time, when
, and it is evident that
approaches to
in finite time.
Figure 3. Here a=0.4, b=0.15, c=0.25, and d=0.1. Phase portrait of the system (Equation6(6) ) for different choices of
and
showing stable behaviour of
.
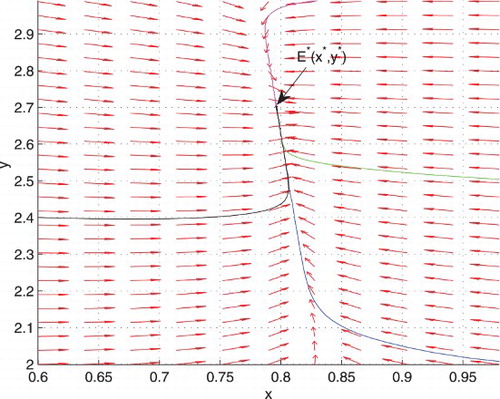
Figure 4. Here the values of the parameters are as in Figure . When , both the populations converge to their equilibrium-state values in finite time. The blue curve represents x and the red one represents y.
6. Concluding remarks
In the last few years, there has been a growing interest in the modelling of the phenomenon of herd behaviour in populations. Researches mainly focus on prey–predator models in which the prey exhibits herd behaviour. In this paper, we have considered a prey–predator model where both prey and predator live in herds. The number of parameters of the model has been reduced by suitable scaling. Then the dynamics of the resulting model (Equation6(6) ) is studied. It is shown (in Theorems 3.1 and 3.2) that the solutions of the system (Equation6
(6) ) remains non-negative forever, and they are uniformly bounded. These, in turn, imply that the system is biologically well-behaved. The main emphasis is laid down on the analysis of stability of the equilibrium points. Besides local stability analysis, we have derived some global results. Our results are illustrated through computer simulation using MATLAB.
To take into account the influence of fluctuating environment, we have formulated the stochastic version of the model by incorporating the additive Gaussian white noises that perturb the growth rate of the prey population and the death rate of the predator population. Then the resulting model is studied by the method of statistical linearization (Valsakumar et al., Citation1983). In doing this, we obtain a system of linear differential equation in terms of the second-order moments. Then the criteria for stochastic stability of the interior equilibrium is derived. We see that the populations in deterministic and stochastic environments behave alike with respect to stability when H>0. However, if H<0, the deterministic stability criterion is insufficient to ensure the stability in the fluctuating environment. In this case, another restriction is necessary for stochastic stability. Thus we observe that the deterministically stable system become unstable under stochastic perturbation when
.
At present the entire globe is concerned about the conservation of ecological balance in nature. From our analysis, it can be suggested that, to keep ecological balance in a fluctuating environment, the system is to be maintained in such a way that A>0, C>0 when H>0 and , C>0 when H<0.
Acknowledgments
The authors are grateful to the anonymous referees and Professor Zidong Wang (Executive Editor) for their careful reading, valuable comments and helpful suggestions, which have helped them to improve the presentation of this work significantly.
Disclosure statement
No potential conflict of interest was reported by the authors.
References
- Ajraldi, V., Pittavino, M., & Venturino, E. (2011). Modeling herd behavior in population systems. Nonlinear Analysis: Real World Applications, 12, 2319–2338. doi: 10.1016/j.nonrwa.2011.02.002
- Bandyopadhyay, M., & Chakrabarti, C. G. (2003). Deterministic and stochastic analysis of a non-linear prey–predator system. Journal of Biological Systems, 11, 161–172. doi: 10.1142/S0218339003000816
- Bera, S. P., Maiti, A., & Samanta, G. P. (2015). Modelling herd behavior of prey: Analysis of a prey–predator model. World Journal of Modelling and Simulation, 11, 3–14.
- Bera, S. P., Maiti, A., & Samanta, G. P. (2016). Stochastic analysis of a prey–predator model with herd behaviour of prey. Nonlinear Analysis: Modelling and Control, 21(3), 345–361.
- Braza, P. A. (2012). Predator–prey dynamics with square root functional responses. Nonlinear Analysis: Real World Applications, 13, 1837–1843. doi: 10.1016/j.nonrwa.2011.12.014
- Chattopadhyay, J., Chatterjee, S., & Venturino, E. (2008). Patchy agglomeration as a transition from monospecies to recurrent plankton blooms. Journal of Theoretical Biology, 253, 289–295. doi: 10.1016/j.jtbi.2008.03.008
- Cosner, C., DeAngelis, D. L., Ault, J. S., & Olson, D. B. (1999). Effects of spatial grouping on the functional response of predators. Theoretical Population Biology, 56, 65–75. doi: 10.1006/tpbi.1999.1414
- Dimentberg, M. F. (1988). Statistical dynamics of non-linear and time-varying systems. New York, NY: John Wiley & Sons.
- Gardiner, C. W. (1983). Handbook of stochastic methods. New York, NY: Springer-Verlag.
- Haken, H. (1983). Advanced synergetics. Berlin: Springer-Verlag.
- Holling, C. S. (1959a). The components of predation as revealed by a study of small mammal predation of the European pine sawfly. The Canadian Entomologist, 91, 293–320. doi: 10.4039/Ent91293-5
- Holling, C. S. (1959b). Some characteristics of simple types of predation and parasitism. The Canadian Entomologist, 91, 385–398. doi: 10.4039/Ent91385-7
- Horsthemke, W., & Lefever, R. (1984). Noise induced transitions. Berlin: Springer-Verlag.
- Jumarie, G. (1995). A practical variational approach to stochastic optimal control via state moment equations. Journal of the Franklin Institute, 332, 761–772. doi: 10.1016/0016-0032(95)00074-7
- Lorenz, E. N. (1963). Deterministic nonperiodic flow. Journal of the Atmospheric Sciences, 20, 130–141. doi: 10.1175/1520-0469(1963)020<0130:DNF>2.0.CO;2
- Lotka, A. (1925). Elements of physical biology. Baltimore: Williams and Wilkins.
- Maiti, A., Jana, M. M., & Samanta, G. P. (2007). Deterministic and stochastic analysis of a ratio-dependent predator–prey system with delay. Nonlinear Analysis: Modelling and Control, 12, 383–398.
- Maiti, A., & Samanta, G. P. (2005). Deterministic and stochastic analysis of a prey–dependent predator–prey system. International Journal of Mathematical Education in Science and Technology, 36, 65–83. doi: 10.1080/00207390412331314980
- Maiti, A., & Samanta, G. P. (2006). Deterministic and stochastic analysis of a ratio-dependent prey–predator system. International Journal of Systems Science, 37, 817–826. doi: 10.1080/00207720600879252
- Maiti, A., Sen, P., Manna, D., & Samanta, G. P. (2016). A predator–prey system with herd behaviour and strong Allee effect. Nonlinear Dynamics and Systems Theory, 16, 86–101.
- Malthus, T. R. (1798). An essay on the principal of population, and a summary view of the principal of population. Harmondsworth: Penguin.
- May, R. M. (1974). Stability and complexity in model ecosystems. Princeton: Princeton University Press.
- May, R. M. (1976). Simple mathematical models with very complicated dynamics. Nature, 261, 459–467. doi: 10.1038/261459a0
- Melchionda, D., Pastacaldi, E., Perri, C., & Venturino, E. (2014). Interacting population models with pack behavior. Retrieved from arXiv:1403.4419v1.
- Murray, J. D. (1993). Mathematical biology. New York, NY: Springer-Verlag.
- Nicolis, G., & Prigogine, I. (1977). Self-organisation in nonequilibrium systems. New York, NY: John Wiley & Sons.
- Nisbet, R. M., & Gurney, W. S. C. (1982). Modelling fluctuating populations. New York, NY: John Wiley & Sons.
- Pearl, R., & Reed, L. J. (1920). On the rate of growth of the population of the United States since 1790 and its mathematical representation. Proceedings of the National Academy of Sciences, 6, 275–288. doi: 10.1073/pnas.6.6.275
- Renshaw, E. (1995). Modelling biological population in space and time. Cambridge: Cambridge University Press.
- Valsakumar, M. C., Murthy, K. P. N., & Ananthakrishna, G. (1983). On the linearization of nonlinear Langevin-type stochastic differential equations. Journal of Statistical Physics, 30, 617–631. doi: 10.1007/BF01009680
- Verhulst, P. F. (1838). Notice sur la loi que la population poursuit dans son accroissement. Correspondance mathématique et physique, 10, 113–121.
- Volterra, V. (1926). Variazioni e fluttuazioni del numero di individui in specie animali conviventi. Mem. Accd. Linc., 2, 31–113.
- Wollkind, D. J., Collings, J. B., & Logan, J. A. (1988). Metastability in a temperature-dependent model system for predator–prey mite outbreak interactions on fruit trees. Bulletin of Mathematical Biology, 50, 379–409. doi: 10.1007/BF02459707
- Xiao, D., & Ruan, S. (2001). Global analysis in a predator–prey system with nonmonotonic functional response. SIAM Journal on Applied Mathematics, 61, 1445–1472. doi: 10.1137/S0036139999361896