
 ?Mathematical formulae have been encoded as MathML and are displayed in this HTML version using MathJax in order to improve their display. Uncheck the box to turn MathJax off. This feature requires Javascript. Click on a formula to zoom.
ABSTRACT
Taking the main urban area of Chongqing as the research area, this paper combines the content of urban green transportation and sustainable development, characteristics of mountain cities and factors affecting green transportation. The relevant indexes of urban green traffic evaluation index system are screened by taking into account the availability of each indicator data, while a comprehensive evaluation index system of green traffic suitable for mountain cities is established. Analytic Hierarchy Process (AHP) and Information Entropy Method are used to determine the weight of each factor and the combination weight of each index in the urban traffic green evaluation index system. Then, the weights of the evaluation factors and indicators are combined and empowered. Combining ArcGIS software with evaluation model, data collection and evaluation of green traffic indicators are carried out in nine districts of Chongqing. Finally, suggestions and improvement measures are put forward to promote the development of green traffic in Chongqing.
1. Introduction
Since the twenty-first century, ecological and environmental problems, such as global warming, carbon imbalance, loss of biodiversity, energy shortage and environmental degradation, have been worse, and sustainable urban development has become one of the global challenges. In September 2015, 193 UN members formally adopted the document ‘Changing Our World: the 2030 Sustainable Development Agenda ’at the Sustainable Development Summit (Dong & Zhang, Citation2016). Transportation, an indispensable part of human society, makes great contributions to urban development. However, wide use of automobiles arises a series of environmental resources problems. As a new concept, green transportation aims at sustainable development, and has a positive influence on solving traffic congestion, exhaust pollution, noise pollution and parking difficulties, as well as realizing the harmonious development of economy, society and environment (Beevers & Carslaw, Citation2005; Dincer, Citation2000; Wang, Citation2006). Many scholars introduced the conception of sustainable development proposed in 1987 into the development of transportation system, which called urban traffic sustainable development theory (He, Citation2009; Peter & Kenworthy, Citation1999). Johansson, Heldt, and Johansson (Citation2006) found that small pollution, safety, comfort, convenience and high accessibility were several chief considerations when people chose the way of travel. Peng et al. summed up 10 principles to promote urban green transportation development (Peng & Zhang, Citation2018). Amekudzi, Khisty, and Khayesi (Citation2009) evaluated the existing problems and improvement measures of the transportation system by selecting typical indicators of the green transportation system (Amekudzi et al., Citation2009). Based on the theory of sustainable development, Du et al. discussed the interaction between transportation, the natural environment and social environment (Du & Zhou, Citation2005). Jiang established a green traffic evaluation index system which was evaluated by value function method, and the feasibility and importance of this system was illustrated by a series of examples (Jiang, He, & Guo, Citation2008). Wang introduced the application of Analytic Hierarchy Process (AHP) into the evaluation system of sustainable transportation system, and made a comprehensive evaluation of urban transportation system (Wang, Citation2011). Based on sustainable development theory, this papers to investigate the comprehensive evaluation of green traffic in Chongqing main urban area. The evaluation index system of urban traffic system in mountain area is constructed, and data collection and evaluation of green traffic index in nine districts of Chongqing are carried out by using ArcGIS software and evaluation model.
2. General situation of research area
Chongqing, the largest municipality with 824,000 km2 in China, is in the core area of the upper Yangtze River economic belt. The main city is 562 km2, and the urban terrain fluctuates greatly.
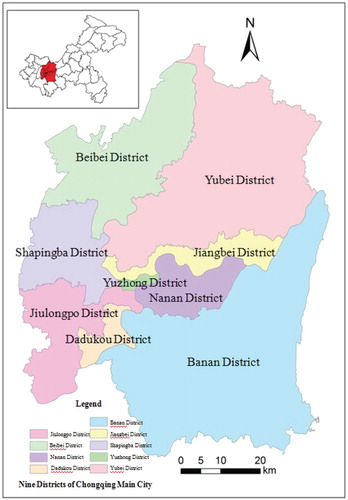
The main urban area of Chongqing consists of all administrative areas of Yuzhong District, Jiangbei District, Yubei District, Shapingba District, Jiulongpo District, Nanan District, Dadukou District, Beibei District and Banan District (as shown in Figure ). The urban area is separated by two rivers with more than 20 km river shoreline in the urban area, and is divided by 14 districts to form a cluster development urban pattern. The Urban Master Plan of Chongqing (2005–2020) determines that the pattern of ‘multi-center group’ is the development strategy of urban spatial structure, and which has been adhered to and highly evaluated. Convenient transportation is necessary for urban development. Chongqing is the typical mountain city, and the development of transportation changes dramatically since it directly affiliate to Chongqing. Chongqing’s traffic construction has made great achievements in the past years, but is still face one of the main problems that 90% of the terrain is hills /mountains (He, Citation2012). In Chongqing, the construction cost of road and bridge in Chongqing is much higher than that in other cities because roads are generally built on mountains. As a result, the traffic is still the bottleneck restricting the economic and social development of Chongqing.
Figure 1. Distribution of nine districts in the main city of Chongqing.
In recent years, with the rapid development of Chongqing, the number of residents has been increasing and the proportion of public transport in trips is obviously lower than that of private cars. As the construction of transportation infrastructure is still in progress, traffic construction in Chongqing has been steadily intensified, and public transport services have been steadily upgraded. However, the urban traffic currently faces enormous challenges due to the rapid growth of car ownership (Chongqing Transport Planning and Research Institute, Citation2014–2017).
3. Selection of green transportation evaluation index and establishment of index system
With the introduction of green transportation concept into China, experts, scholars and government departments in various fields advocates green traffic construction in cities. A series of green traffic evaluation indicators are put forward, which contributed positively to the improvement of the evaluation index system of green traffic (Liu, Citation2014).
Mountainous cities have different characteristics from plain cities, and many factors affect the transportation system of mountainous cities. Therefore, it is necessary to select representative indicators from these factors. To establish an evaluation index system for evaluating the green transportation of mountainous cities comprehensively, the selected indicators need to be made moderately difficult and easy to operate.
Comprehensive evaluation index architecture consists of a single index, linear or tower structure. The tower structure is suitable for the analysis of multi-factor systems. Therefore, this study uses tower structure to construct the evaluation index system of green traffic in mountainous cities. The evaluation system framework is composed by target layer, standard layer and index layer. In the index layer, 12 evaluation indicators were used.
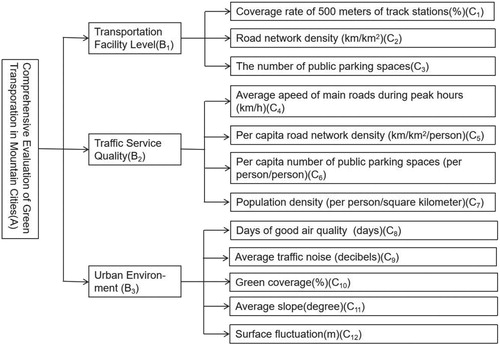
In addition to the index of urban traffic, the index of urban ecology and the normative index of government departments, topographic and geomorphological characteristics of mountainous cities should be also considered to determine the evaluation index of green traffic. Therefore, based on the construction principles and ideas of the evaluation index system of urban green transportation system, this study screens the relevant indicators of urban green transportation evaluation index system according to the accessibility of each index data. Then, a comprehensive urban green traffic evaluation index system for mountainous areas is established. As shown in Figure , the comprehensive evaluation of green traffic in mountainous cities (A) is the target, and which contains three criteria layers, including transportation facilities level (B1), traffic service quality (B2) and urban environment (B3).
Figure 2. Indicator system map for green evaluation of urban traffic system in mountain areas.
3.1. Indicators of transportation facility level
Traffic facilities, the important part of traffic system, play a key role in guaranteeing traffic safety. The track, tunnel, elevated road, station, communication signal, road marking and other traffic facilities are set up to ensure the normal operation of the urban traffic system. As main traffic facility level indicators are used to evaluate the construction level of traffic facilities. This study chooses the following traffic facility level indicators: (1) the coverage rate of 500 m track station (%) – C1; (2) road network density (km/km2) – C2; (3) the number of public parking spaces (number) – C3.
3.2. Indicators of traffic service quality
Traffic service quality directly affects passengers’ evaluation of traffic service level. Service quality is related to traffic convenience and economy. Convenience is the convenient degree of choosing different transport modes. Economy represents the rationality of fare.
Traffic service quality indicators include the number of bus, average speed of main roads in built-up areas during peak hours, average transfer coefficient, 90% travel time of residents, and so forth. In this study, traffic service quality indicators are selected as follows: (1) average speed of major roads (km/h) during peak hours – C4; (2) per capita road network density (km/km2/person) – C5; (3) per capita number of public parking spaces (person/ ten thousand people) – C6; (4) population density (person/km2) – C7.
3.3. Indicators of urban environment
The environment is closely related to the development of social economy and traffic, so it has an essential impact on human health. Urban environmental indicators mainly consist of the number of days with good air quality per year, the average value of traffic noise on main roads, urban green coverage, road traffic air pollution saturation and fuel consumption per unit transport volume. The indicators used in this study are as follows: (1) days of good air quality (days) – C8; (2) average traffic noise (decibels) – C9; (3) green coverage (%) – C10; (4) average slope (degree) – C11; (5) surface fluctuation (m) – C12.
The original indicators are obtained from the official website of Chongqing Government, the statistical information network of nine districts, Chongqing Planning Bureau, Chongqing Statistical Bureau, Chongqing Road Transportation Administration Bureau, Chongqing Traffic Committee and the city profile website of the central government. The statistics is coordinated into the Google Map, while the topographic map comes from the ArcGIS. Based on the available data, the current status of the evaluation index system of green traffic in Chongqing is given in Table .
Table 1. Current data value of green traffic evaluation index system in nine districts of Chongqing.
4. Analysis of green traffic in Chongqing main urban area
This study adopts the analytic hierarchy process (Li & He, Citation2008) to consult some experts who have studied urban green traffic, and then the judgment matrix is constructed with 1–9 scale method. After that, the consistency of the judgment matrix is tested and the weight of 12 indicators is obtained. Another set of weights for each index is obtained with the information entropy method (Luo, Citation2014), and the average value of each index weight is used as the combination weight. Finally, the comprehensive index evaluation model is established. Compared with the subjective methods such as the analytic hierarchy process (AHP) and expert scoring, the information entropy method is an objective method. It borrows the concept of ‘entropy’ in information theory. The greater the entropy value, the greater the uncertainty. In this study, the target is the comprehensive evaluation of green traffic in mountainous cities, criterion level includes traffic facilities, traffic service quality and urban environment, and 12 indicators compose the lowest level.
4.1. Analytic hierarchy process for calculating weights
4.1.1. Weight of transportation facility level (B1)
Construct the judgment matrix for B1 (Table ).
The consistency index CR = 0.0036 is calculated by consistency test, and the consistency of judgement matrix is acceptable if CR < 0.1. According to the opinions of 10 experts, the judgment matrix is constructed with the above weight calculation method. The weight value of each index is determined by analytic hierarchy process, and then the average of weight values is calculated to obtain the objective and practical indicator weights. The expert calculation values for each traffic facility level are shown in Table .
Table 2. Judgment matrix of B1.
Table 3. Expert weight of transportation facility level.
4.1.2. Weight of traffic service quality (B2)
Construct the judgment matrix for B2 (Table ).
The consistency index CR = 0.0080 is calculated. It is considered that the consistency of judgement matrix is reasonable if CR < 0.1. According to the opinions of 10 experts, the judgment matrix is constructed by the above weight calculation method. The weight of each index is determined with analytic hierarchy process, and then average value of all weight values to gain the objective and practical index weights. The expert calculation values of traffic service quality level are shown in Table .
Table 4. Judgment matrix for B2.
Table 5. Expert weight of traffic service quality.
4.1.3. Weight of urban environment (B3)
Construct the judgment matrix for B3 (Table ).
The consistency index CR = 0.0367 < 0.1 is calculated, and it is considered that the consistency of judgement matrix is acceptable. With the mentioned weight calculation method, the judgment matrix is constructed based on the opinions of 10 experts. The weight values of each index are determined by analytic hierarchy process, and then the average values is obtained. Therefore,the objective and practical index weight values can be achieved. The expert calculation values of urban environment are shown in Table .
Table 6. Judgment matrix for B3.
Table 7. Experts weight of urban environment.
4.1.4. Weight of urban green transport (A)
Construct the judgment matrix of criterion layer A (Table ).
The CR = 0.0516 < 0.1 means that the consistency of judgement matrix is acceptable.
Table 8. Standard layer a judgment matrix.
4.1.5. Each index of layer C corresponding to the composite weights of layer A
The synthetic weight of each element to the target layer refers to the combination of the relative weight of each factor of the judgment matrix for the target layer (the top layer), which is synthesized layer by using the top-down method. The weight of each index after synthesis is shown in Table .
Table 9. Weight value of urban green transportation indicators.
4.2. Information entropy method for calculating weights
Normalization
Firstly, the data matrix X is normalized to get the calculation matrix Y. The number units and magnitude order of each index are not consistent, so the control variables should be dimensionless first and the original data should be converted to the values between 0 and 1for comparison. There are two kinds of transformation formulas, and the following one is used for the positive index. It can be concluded that the larger the index data the better the result.
(1)
(1) where
and
represent the maximum and minimum of column J of data matrix X, respectively.
The other one for the reverse index is as follows: the smaller index data the better the result.
(2)
(2)
Given the original data, using formula (1) / (2) to process the ∖x-x data and get the calculation matrix Y Table :
For the calculation matrix, formulas (3), (4), (5) are used to calculate the entropy value and weight. The calculation results are shown in Table
Table 10. Normalized data.
Table 11. Entropy value and weight of urban green transportation indicators.
The entropy of each evaluation index is calculated by:
(3)
(3)
(4)
(4) where
is the normalization constant.
The weight of the evaluation index is calculated by:
(5)
(5)
4.3. Combined weight calculation
According to the weight of each index in target layer A obtained by analytic hierarchy process and information entropy method, the final combination weights of each index are calculated by the average method (Table ).
Table 12. Combination weight of urban green transport indicators.
It can be seen that the importance of green traffic evaluation index in comprehensive evaluation of 12 cities ranks from high to low as follows: 500-metre coverage of rail stations > average speed of main road during peak time period > density of road network > days of annual air quality > density of road network per capita > average of traffic noise > number of public parking spaces > green coverage > number of public parking spaces per capita > fluctuation of ground surface > surface average slope > population density.
4.4. Evaluation results and analysis
According to the multi-factor comprehensive index method, the green traffic comprehensive index of nine districts in Chongqing is calculated by:
(6)
(6) where Z represents the comprehensive index, W represents the weight of each index, and F represents the assignment of each index.
Level of transport facilities
As shown in Table , the transportation facilities in Yuzhong and Nanan are better than those in Banan and Beibei. Among them, the coverage rate of 500 m (C1) index of rail stations is the highest in Yuzhong, while the lowest in Banan and Beibei. The density of road network (C2) index is the highest in Yuzhong, while the lowest in Banan and Beibei. The number of public parking spaces (C3) index is the highest in Yubei, while the lowest in Beibei and Dadukou. Therefore, Banan and Beibei should increase the level of transport facilities, the number of rail stations and road network density.
Quality of traffic service
Table 13. Comprehensive index of transportation facilities level in nine districts of Chongqing.
As shown in Table , the traffic service quality of Yuzhong and Dadukou is better than those of Banan and Beibei. Among them, the average speed (C4) index of main roads in the peak period is the highest in Yubei, while the lowest in Shapingba and Jiangbei. The C5 index is the highest in Yuzhong, the lowest in Banan and Yubei. The C6 index is the highest in Jiangbei, the lowest in Banan and Beibei. The C7 index indicates that Banan has the lowest population density and Yuzhong has the highest population density. Therefore, Shapingba and Jiangbei should strengthen the control of traffic congestion, and Banan and Beibei should further improve the quality of traffic services.
Urban environment
Table 14. Comprehensive index of traffic service quality in nine district of Chongqing.
As shown in Table , the environment of Nanan and Bananis better than those of Jiangbei and Yuzhong. Among them, the annual air quality days (C8) index is the highest in the Nanan, the lowest in Shapingba and Jiulongpo. The C9 index is the highest in Banan, the lowest in Yuzhong. The C10 index is the highest in Nanan, the lowest in Beibei. The highest slope index (C11) is Shapingba, the lowest is Jiangbei and Yuzhong, which indicates that the surface slope of Jiangbei and Yuzhong is large; the highest surface fluctuation index (C12) is Jiulongpo, the lowest is Banan and Beibei, which indicates that the topographic fluctuation of Banan and Beibei is larger; Therefore, Yuzhong and Jiangbei should strengthen the control of environmental pollution control, reduce vehicle exhaust emissions and improve environmental quality.
Overall evaluation
Table 15. Urban environmental comprehensive index of nine districts in Chongqing.
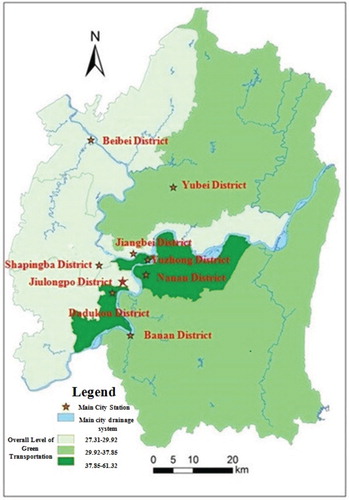
As shown in Table , the better development level of green transportation in Chongqing main urban area is Yuzhong, Nanan and Dadukou; the general development level is Banan, Yubei and Jiangbei; the worse development level is Shapingba, Jiulongpo and Beibei. Therefore, in combination with the scores of the above indicators, the three regions with poor overall level are analyzed:
On the level of transportation facilities, Shapingba, Jiulongpo and Beibei should strengthen the construction of rail transit, improve the coverage of rail stations, and increase the density of road network and the setting of public parking spaces.
In terms of traffic service quality, Shapingba and Jiulongpo should strengthen the control of traffic congestion on main roads during peak hours, reduce the number of cars, encourage residents to travel by bus or subway, and increase the average speed, while Beibei should improve the density of road network per capita and increase the number of public parking spaces per capita.
In urban environment, Shapingba and Jiulongpo should reduce the emission of air pollutants, especially automobile exhaust, leading to an improvement of air quality. Jiulongpo should reduce the impact of traffic noise on urban environment, reduce road traffic flow and set up road sound barriers appropriately. Meanwhile, Beibei should strengthen urban greening construction. To improve the green coverage, the expansion of the green area by opening up new green space and consolidating existing green space are used.
Table 16. Comprehensive index of green transportation development level in nine district of Chongqing.
Finally, the overall development level of green transportation is reflected in the form of thematic map with the colour change method, as shown in Figure .
Figure 3. General development level distribution of green transportation in nine district of Chongqing.
5. Conclusion
On the basis of the connotation and main content of sustainable development and green traffic, and the relationship between green traffic and urban traffic sustainable development, this study develops an evaluation index system of green traffic combined with the components of green traffic in Chongqing main urban area. A comprehensive index evaluation model by analytic hierarchy process and information entropy method are established, and the weight and comprehensive index of the evaluation index of green traffic in nine districts of Chongqing is calculated. The development level of green traffic in the nine districts is evaluated with ArcGIS, and the level of traffic facilities, traffic service quality and urban environment are analyzed. The evaluation results points out the shortcomings and challenges of the development of green transportation in Chongqing, and some valuable suggestions and improvement measures for the development of green transportation in the Chongqing Main City are provided.
Disclosure statement
No potential conflict of interest was reported by the authors.
Additional information
Funding
References
- Amekudzi, A. A., Khisty, J., & Khayesi, M. (2009). Using the sustainability footprint model to assess development impacts of transportation systems. Transportation Research Part A: Policy and Practice, 43(4), 339–348.
- Beevers, S. D., & Carslaw, D. C. (2005). The impact of congestion charging on vehicle emissions in London. Atmospheric Environment, 39(1), 1–5. doi: 10.1016/j.atmosenv.2004.10.001
- Chongqing Transport Planning and Research Institute. (2014–2017). Annual report on traffic operation analysis in Chongqing’s main urban area.
- Dincer, I. (2000). Renewable energy and sustainable development: A crucial review. Renewable and Sustainable Energy Reviews, 4(2), 157–175. doi: 10.1016/S1364-0321(99)00011-8
- Dong, L., & Zhang, H. B. (2016). The impact of the 2030 sustainable development Agenda on global and China's environmental governance. China Population, Resources and Evironment, 26(1), 8–15.
- Du, Z., & Zhou, Y. (2005). The discussion about interactive relation between modern city traffic and environment. Chongqing Architecture, 8, 24–26.
- He, Y. H. (2009). On research of urban green transportation. Nanjing Forestry University.
- He, Y. X. (2012). On target of traffic development in Chongqing and strategies. Journal of Chongqing Jiaotong University(Social Sciences Edition), 12(3), 26–28.
- Jiang, Y. H., He, X. Z., & Guo, X. C. (2008). Discussion on the evaluation index system of urban green traffic planning. Journal of Hefei University of Technology, 31(9), 1399–1402.
- Johansson, M. V., Heldt, T., & Johansson, P. (2006). The effects of attitudes and personality traits on mode choice. Transportation Research Part A Policy and Practice, 40, 507–525. doi: 10.1016/j.tra.2005.09.001
- Li, W. S., & He, Y. H. (2008). Research on assessment of landside hazard by using hierarchical analysis method. Journal of Yangtze University (Nature Science Edit), 5(3), 91–94.
- Liu, R. D. (2014). Research on construction the evaluation index system of urban low-carbon traffic. Chang’an University.
- Luo, J. (2014). Principles and examples of using information entropy to calculate weight. Journal of Wuhan Textile University, 27(6), 86–89.
- Peng, H. Q., & Zhang, G. W. (2018). Green traffic and urban sustainable development. Journal of Transportation Systems Engineering and Information Technology, 18(2), 1–6.
- Peter, N., & Kenworthy, J. (1999). Sustainability and cities. London: Earthscan.
- Wang, W. (2011). Application of analytic hierarchy process in system of evaluation for sustainable transport system. North Jiaotong, 7, 68–70.
- Wang, Y. (2006). Study on the theory and implement measure of green traffic planning. Xi”an University of Architecture and Technology.