
 ?Mathematical formulae have been encoded as MathML and are displayed in this HTML version using MathJax in order to improve their display. Uncheck the box to turn MathJax off. This feature requires Javascript. Click on a formula to zoom.
ABSTRACT
During the process of portfolio decision, the investor usually assumes that the distribution of asset return is known in order to identify the optimal investment strategy. In fact, the distribution of asset return is unknown and the investor often uses the historical data to estimate its distribution, which is uncertainty and should be taken into account during the process of portfolio decision. In this paper, we use the relative entropy to measure the uncertainty degree of risk premia and covariance matrix, build the model of mean-variance portfolio, and obtain the portfolio’s risk premia and variance under the worst scenario. At last, a comparative empirical study based on the portfolio’s effective frontier is performed. Results show: parameter uncertainty has significant effect on portfolio decision, and the effect of risk premium uncertainty is more than that of covariance matrix uncertainty; for the investor of risk-aversion, the higher the degree of parameter uncertainty is, the lower the portfolio performance is, and the stronger the relationship of assets in portfolio is, the weaker the effect of parameter uncertainty on portfolio is.
1. Introduction
As an important part of asset pricing and portfolio research, uncertainty is the most important feature of financial markets. This is also a common financial phenomenon, especially in emerging markets such as China. The mean variance method introduced by Markowitz (Citation1952) has spurred extensive research on asset allocation issues. As the research progressed, its limitations and effectiveness were also emphasized. The exact distribution of risk assets is usually unknown in the real market. We can only estimate the distribution of assets through historical data and personal experience. Scholars use this to analyse securities investment decisions and explain the laws and phenomena of financial markets.
For portfolio decision, there are two main problems: from an objective point of view, investors use historical data to predict future parameters. The future development direction of financial market is not combined with other objective factors, which leads to inaccurate parameter estimation and inconsistent real price in the future; based on the ‘Ellsberg Paradox’, investors have certain risk aversion in venture capital. Therefore, it is necessary to study portfolio selection from the perspective of uncertainty. Then verify its practical significance with empirical evidence.
By introduced portfolio optimization model, Torre and Mendivil (Citation2018) extended the classical Markowitz model. The model adopted the concept of probability multiple measure to formalize the imprecise probability measure and incomplete information. The potential space of events was also included in the model. Therefore, the essence of the problem of model uncertainty is to recognize that the individual does not know enough about the economic situation. Parameter uncertainty is an important part of the model's uncertain portfolio of assets, it means that the future natural state and its probability are unknown. Estimated risks were derived from parameter estimates for future related payments or data generation processes. It was pointed out by Knight (Citation1921) and Berger (Citation1978) that multi-prior approach could be used to deal with the problem of parameter uncertainty. Tarashev (Citation2010) solved the correlation problem of uncertain parameters in the credit portfolio risk management system. The complexity of the financial market will inevitably lead to the diversity of the return types of securities. Qin (Citation2015) used the mean-variance model to solve the problem of mixed portfolios when both stochastic and uncertain returns exist. Hall, Satchell, and Spence (Citation2015) were based on the analysis of deterministic equivalent loss analysis expressions which do not depend on the degree of risk aversion. Then we got the conclusion that uncertainty leads to deterministic equivalent return reduction. Yuen and Yang (Citation2012) replaced variance by expected loss to measure investment risk and identify the relationship between risk and uncertainty. The goal of optimal portfolio optimization research was to seek the maximum return of the portfolio in the worst case scenario.
Based on this, Zymler, Rustem, and Kuhn (Citation2009) proposed a new robust optimization model in the worst-case. It pointed out that the combined income of the investment under the weak guarantee would apply to all possible return on the assets. The influence of insurance guarantee on portfolio performance was also analysed in the model. Scutellà and Recchia (Citation2013) solved the portfolio optimization problem from the perspective of classical mean variance and minimum variance portfolio optimization problem robustness. The relationship between robustness and convexity risk was measured based on this basis. Bodnar, Mazur, and Okhrin (Citation2017) analysed the optimal portfolio problem of mean and covariance matrices from Bayesian point of view. By reparameterizing the model with the posterior distribution, the posterior density of portfolio weight was analysed. Yam, Yang, and Yuen (Citation2016) comprehensively compared the effect of covariance matrices and asset income on the optimal portfolio. It was pointed out that the expected return of the portfolio has a greater effect on the risk-averse investor trading decisions.
By comparing the framework of Boyle, Garlapp, and Uppal (Citation2012) and Maccheroni, Marinacci, and Ruffino (Citation2013). It is concluded that investors are not familiar with risky assets. And risk will be dispersed when building portfolios based on the mean-variance model. When an investor is familiar with a particular asset, the portfolio will be transferred to this asset. Tütüncü and Koenig (Citation2004) introduced a simple way to model the uncertainty of input parameters in an asset allocation problem. They consider a range of parameters for both expected returns and covariances in a mean-variance model. Choi, Rujeerapaiboon, and Jiang (Citation2016) changed the covariance matrix of portfolio returns, reducing the risk of autocorrelation between portfolios.
Li and Qin (Citation2014) believe that the expected return is an uncertainty interval. The solution was more in line with the actual investment decision by using the nonlinear programming model. The mixed integer nonlinear programming (Xidonas, Hassapis, Soulis, & Samitas, Citation2017) was proposed to minimize the combined variance of the finite set covariance matrix scheme and to optimize the combinatorial structure. Zhu, Ji, and Li (Citation2015) argued that the robust combinatorial selection problem modelled using several types of set-valued schemes in the minimum-maximum decision-making framework can be allowed to be converted to linear or second-order cone programmes when sold short. The conclusion was that conservatism does not necessarily mean conservatism, and the investment style is largely influenced by the return-risk trade-off.
Such studies show that the effect of parameter uncertainty on securities trading decision is obvious. However, most studies only consider the uncertainty of a single parameter. Therefore, further research and verification are needed.
In view of this, this paper uses relative entropy to measure the market uncertainty, and constructs a portfolio model under the uncertainty of risk premium and the uncertainty of portfolio covariance matrix. The effects of these two uncertainties are also analysed. Through empirical analysis of stock market data in the past 10 years, it is found that the uncertainty of risk premium and the uncertainty of portfolio covariance matrix affect portfolio and its differences. The innovation of this paper is reflected in the following three aspects: First, constructing the mean variance combination model under the condition of uncertain parameters. The effect of risk premium and portfolio covariance matrix uncertainty on the optimal portfolio is studied under the uncertainty measure. It is found that the risk premium has a greater effect on the portfolio. Secondly, this paper uses the relative entropy method to measure the uncertainty level and simplifies the calculation. At the same time, we measure investment strategies in the best financial market environment and the worst financial market environment. We have found that improving market transparency and increasing market information flow are more conducive to asset portfolios. Third, through multiple sets of asset portfolio evidence, it is found that there is a correlation between asset portfolio and effective frontier.
The structure of this paper is as follows: in Section 2, based on the mean-variance model, investors’ portfolio trading decision with risk premium uncertainty parameters and portfolio covariance matrix is constructed. Sections 3 and 4 construct the risk premium model and the effect of the portfolio covariance matrix on portfolio trading decisions based on the portfolio trading model with uncertain parameters. Sections 5 builds a portfolio based on three different sets of related portfolios and treasury bonds. On the basis of the theoretical model, the empirical results show that from the perspective of effective frontier, the effect of risk premium in portfolio trading decision-making is greater than the covariance matrix of portfolio. The relationship between risk asset correlation and optimal portfolio income was found. Sections 6 is the summary and further research content of this paper.
2. Investor portfolio decision under parameter uncertainty
Assuming that there are kinds of risky assets in the financial market and the return of assets obeys multivariate normal distribution,
represents the best market environment in which investors can obtain and use all information (such as historical data, market information and their expertise) to estimate the risk premium
and covariance of the return
of
kinds of risky assets, then
and
are the return of
kinds of risky assets. The risk premium and covariance matrix under the optimal probability measure
, so
and
are the best estimates of the characteristic parameters describing the return distribution of
kinds of risky assets. Furthermore, it is assumed that the investor is risk averse and that
kinds of risky assets are traded to minimize the portfolio risk. Therefore, based on the mean-variance model, the portfolio optimization problem of the investor can be expressed as follows
(1)
(1) Among them,
is the risk equity heavy vector in the portfolio, and
is the lowest risk premium of the asset portfolio expected by the investors.
In fact, it is difficult for investors to obtain parameter estimates in problem (1) under the optimal probability measure , According to the information they own, the estimated values of
and
are more or less different from those of
and
under the best probability measure
, that is, the estimation of model parameters is uncertain. Then investors’ expected portfolio performance and the inherent relationship of risky assets in the portfolio are also different from their estimates, which leads to the problem (1) that the portfolio constructed is not optimal.
For risk aversion investors, once the parameter estimation deviates from the optimal estimate, they will consider a variety of cases based on their parameter estimation. And the risk premium and covariance matrix estimate and
of the risk assets will be different from each other under various circumstances. Investors will calculate the potential loss of the portfolio under various circumstances, especially the maximum loss, and thus avoid it in the course of portfolio trading. Here, we use
to represent the uncertainty probability measure of parameter estimation, and the deviation between parameter estimation under uncertainty probability measure
and optimal probability measure
by relative entropy measure
, because the investor is risk avoidance type. Therefore, the deviation of parameter estimation is less than a certain positive constant (the size of
),
depends on investors’ confidence in information and judgment of the market when making trading decisions. Let
and
be the probability density functions of risk asset returns under probability measures
and
respectively, then relative entropy of risk aversion investors can be expressed as follows
(2)
(2) From the investors’ acquisition, using the difference of information and the estimation error, there is uncertainty in the distribution characteristics of the return of risk assets, so that
is the parameter set of
under the uncertainty probability measure
. From the investor uncertainty circumvention behaviour, the investor is most worried about the worst situation, at this time the parameter estimation and the best estimate deviate the most, the portfolio potential loss is the greatest. Therefore, under the uncertainty environment of model parameters, the Portfolio optimization problem of risk-averse investors is transformed from (1) to
(3)
(3) Then, the relative entropy dominant expression of formula (2) can be obtained
(4)
(4) Further, get the Lagrange function of the question. This paper studies the problem of portfolio optimization with constraints, and Lagrange algorithm is one of the best methods to solve this problem.:
(5)
(5) From the first order conditions to
(6)
(6)
(7)
(7) For the sake of brevity, we introduce the parameter
, which is derived from Formula (7) as
(8)
(8) Because this article assumes that investors are risk averse, we consider the portfolio model of investors with risk neutral measure as the boundary. Let
be the risk neutral measure,
be the relative entropy of
with respect to
.
(9)
(9) The combination (8) and (9) can be obtained as
(10)
(10) Combination (10) and (4), from the properties of matrices. The expression of
on
can be obtained from the properties of matrices.
(11)
(11) We solve the problem in two cases,
and
.
If the risk neutral probability is within the set of uncertainty measure. When
, it is a model with no uncertainty. Then,
,
. For other positive
, the covariance matrix of risk assets and the weight vectors of risk assets of the optimal portfolio are obtained respectively as
(12)
(12)
(13)
(13) If
, the uncertainty measure set is greater than or equal to the risk neutral probability measure. Risk aversion investors do not invest in risky assets because they believe that the worst expected return of risky assets is not higher than that of riskless assets. From the condition of
, the risk premium is only invested in the risk-free assets. That is, the risk aversion investors think that the worst expected return of the risk assets is not higher than that of the risk-free assets. So they do not invest in the risk assets. At the same time, we can get this conclusion by reducing the constraint conditions of uncertainty measure, and the problem becomes
Let
. Differentiate
with respect to
and
.
therefore,
.
For the optimal portfolio, the risk premium is under measure
. Variances of the return under measures
is
.
From the result, with the increase of uncertainty parameter , the risk premium increases, and when
, the covariance matrix
decreases with the increase of
. When
, the covariance reaches the maximum, and when
, the covariance
increases with the increase of
, and when
, there is
. It is counter-intuitive and seems to be inconsistent with the meaning of the worst scenario. The result shows that it is more ‘cost effective’ to place more attention on the risk premium uncertainty rather than the covariance uncertainty when we have a high level of conservativeness. Risk averse investors should pay more attention to the uncertainty of risk premium in portfolio trading, and its effect on portfolio is more significant. As the effect of risk premium and covariance matrix uncertainty on portfolio is different, it is necessary to study the effect of risk premium uncertainty and covariance matrix uncertainty on portfolio trading decision-making separately.
3. The uncertainty of risk premium
Under the historical probability measure , only the risk premium uncertainty exists, and the covariance matrix
of the risky assets is a fixed value. Based on formula (1), the optimal portfolio problem of investors can be expressed as
(14)
(14) Let
be the set of parameters
under the measure
.
Relative entropy of uncertain measure set with respect to
can be obtained by combining Formula (4) and (14).
(15)
(15) The Lagrange function corresponding to formula (14) as
(16)
(16) Based on Formula (16), it can be obtained from the first-order conditional formula as
(17)
(17) In order to express concisely, let
be the parameter, which is derived from Formula (17) as:
(18)
(18) Next, we solve the problem in two cases,
and
.
If , this indicates
. The risk premium derived from the risky assets can be non-positive in the worst scenario. The optimal strategy
must be 0 in order to minimize the variance of portfolio and the corresponding worst scenario measure is
.
If , with the constraints, we obtain
,
. The risk premium of the portfolio under measure
is
, and the variance of the portfolio return under measure
is
.
Therefore, when the uncertainty is greater than the risk neutral measure (), the risk aversion investors will not buy or short the risk assets, but invest in the risk-free assets. When the uncertainty measure set is equal to the risk neutral measure set
(
), the risk premium uncertainty has the strongest influence on the portfolio income. At the same time, the risk asset premium is zero because of the existence of risk-free assets. When the uncertainty measure set is within the acceptable range of risk aversion investors (
), the risk premium and portfolio variance of the portfolio decrease with the increase of uncertainty. Risk aversion of risk-compliant investors in portfolio trading decision-making.
4. The uncertainty of covariance
Under the historical probability measure , only the covariance matrix exists, and the risk premium uncertainty
of the risky assets is a fixed value. Based on formula (1), the optimal portfolio problem of investors can be expressed as
(19)
(19) Let
be the set of parameters
under the measure
.
Relative entropy of uncertain measure set with respect to
can be obtained by combining Formula (4) and (19).
(20)
(20) The Lagrange function corresponding to formula (19) as
(21)
(21) Based on Formula (16), it can be obtained from the first-order conditional formula as:
(22)
(22)
(23)
(23) Then we have
(24)
(24) In order to express concisely, let
be the parameter, as
(25)
(25) Then we have
(26)
(26) The optimal strategy
is
(27)
(27) The risk premium of the portfolio under measure
is
,
and the variance of the portfolio return under measure is
.
As we know, risk premium uncertainty achieves its maximum effect when the uncertainty parameter equals . With the best investment strategy, the minimum risk premium may be zero in the presence of risk-free assets. For covariance uncertainty, its effect increases with the uncertainty parameters without limit. The portfolio covariance matrix is the main performance of the effect on the portfolio. The correlation of different risk assets to portfolio returns and portfolio differences also increase.
5. Empirical study
Taking the automobile industry as the research object. On the basis of the above theoretical analysis, this paper analyses the different levels of risk aversion uncertain information investors securities investment strategy. The mean-variance portfolio model is quantified and the degree of uncertainty is described by relative entropy. The relationship between the minimum variance asset boundary and the effective boundary is obtained. The influence of the covariance matrix and the risk premium uncertainty on the asset portfolio is further discovered. The relationship between risky assets and portfolio trading decisions is found, which provides Suggestions for investors in the process of portfolio trading decisions.
5.1. Study sample selection
We select three groups of asset portfolios, which are composed of four risky stocks in the automotive industry, industry chain and China's financial market. Among them, the riskless assets are selected as the eighth issue of electronic savings bonds in 2018 with a five-year term and a par annual interest rate of 4.27%, and the monthly logarithmic return rate is ,
, Portfolio I is a comprehensive index of risk assets in China's financial market, including Shanghai Stock Exchange Index (000001), Shanghai and Shenzhen 300 (000300), Shenzhen Stock Exchange Composite Index (399106) and 300 Telecom (000916); Portfolio II is a risk asset in the automotive industry, including Jianghuai Automobile (600418), Shanghai Automobile Group (600104), Geely Automobile (00175) and FAW Car (000800); Portfolio III is an automobile. The centre's industrial chain risk assets are SAIC Group (600104), Guihang Share (600523), Changchun Yidong (600148) and Sinopec (600028); the data are from October 2008 to September 2018, a total of 120 months of earnings series as the research sample, and its closing index is its price. The original data came from the Oriental Wealth Network.
5.2. Estimation of relative entropy of risk measure
is a risk-neutral measure and
is the relative entropy of
with respect to
:
.
is the maximum effective relative entropy, that is, if the investor's uncertainty for the risky assets is greater than
, the investor will not invest in the risky assets, which has no practical significance.
Table
5.3. Empirical results and analysis
Based on the relative entropy in formula (4). we choose equal to 0, 0.25, 0.5, 0.75 and 1 to illustrate the effect of uncertainty on the minimum variance frontier and the efficient frontier of the portfolios formed by the four indices in the corresponding worst scenarios. And the portfolio trading decisions of risk averse investors under different uncertainties (different
values) are obtained. Note that
might refer to all cases that
. We specify here that when we say
in this section, it is referring to the case that
.
Table
Based on formulas (11) and (13), get the following curve.
In comparison with Figure , Figure and Figure , it is concluded that in financial markets, improving market transparency and reducing uncertainty () is beneficial to portfolio trading. With the increase of uncertainty
, the minimum variance frontier will tend to calm, which is in line with the risk aversion psychology of investors. When the increases of uncertainty factor
, investors will reduce the proportion of investment in risk assets and increase the investment in risk-free assets. When
, the expected return equals the risk-free interest rate 0.0035. In other words, the parameter uncertainty is
, in the current period, the risk aversion investors will invest all wealth held in the risk-free assets. We have another result is that the portfolio risk and the expected return of portfolio increases with the enhance of correlations assets. The expected return of risk-free asset in portfolio I is greater than the other uncertain risk assets under the same standard deviation. Risk-free asset portfolio II expected return is greater than the standard deviation of only four curve part of the expected return before turning point. Risk-free asset portfolio III under the expected return is also lager than in the standard deviation of
expected earnings.
Figure 1. Minimum variance frontiers of the risky assets under different uncertainty levels in Portfolio I.
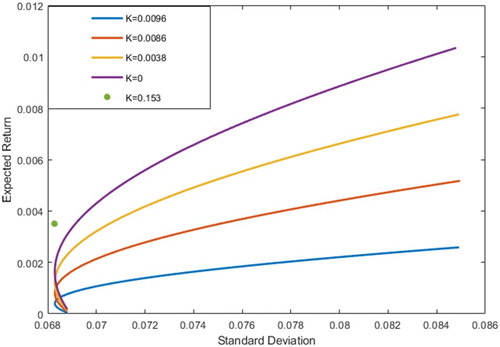
Figure 2. Efficient frontiers of the risky assets under different uncertainty levels in Portfolio I.

Figure 3. Minimum variance frontiers of the risky assets under different uncertainty levels in Portfolio II.
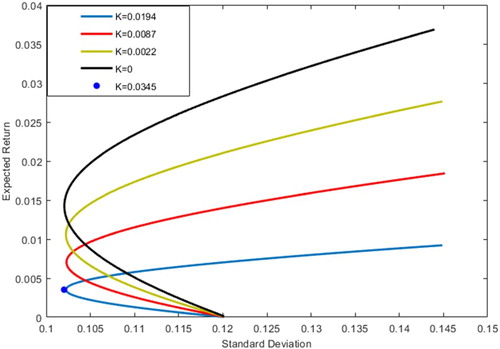
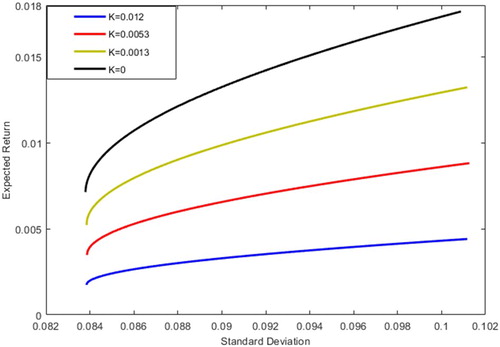
In comparison with Figure , Figure and Figure , it is found that the influence of covariance uncertainty on portfolio is limited, and the influence of risk premium uncertainty should be considered emphatically. When , the influence of risk asset covariance matrix on portfolio reaches the maximum, and the curve of effective frontier at
is most flat. Therefore, the increase of standard deviation is mainly due to the change of risk premium not the covariance of portfolio. From the figure, it can be seen that when the portfolio standard deviation is certain, the expected income will decrease with the increase of uncertain level. When the
value is the same, the expected return increases with the increase of standard deviation under certain conditions of uncertainty, confirming the ‘high risk, high return’ statement. Besides, we get the portfolio decision-making advice that the expected returns of the three graphs are the same. When
, the standard deviations are 0.06829, 0.1021 and 0.0838 respectively. In this paper, we can see that the slope of Figure is the flattest, and the slope of Figure is the largest compared with Sharpe Ratio. So the best portfolio strategy is the auto industry stocks if investors in the portfolio.
Figure 4. Efficient frontiers of the risky assets under different uncertainty levels Portfolio II.
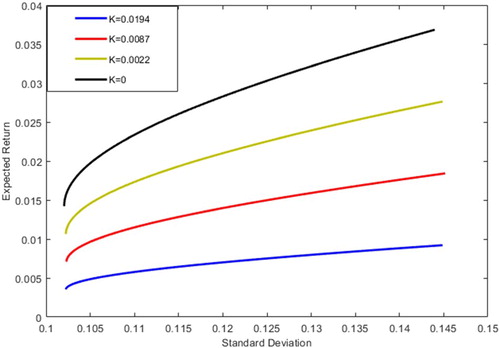
Figure 5. Minimum variance frontiers of the risky assets under different uncertainty levels Portfolio III.
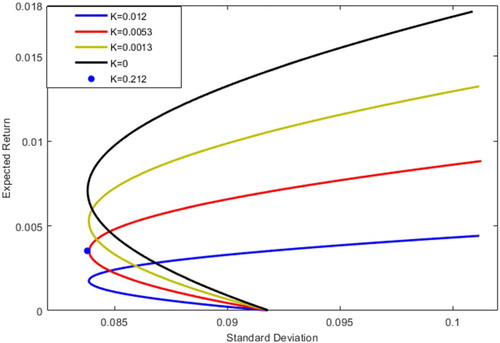
Figure 6. Efficient frontiers of the risky assets under different uncertainty levels Portfolio III.
Based on the comprehensive theory and empirical analysis, this paper holds that: by studying the optimal portfolio problem of mean-variance, it is found that the source and nature of the uncertainty are different when the risk premium and covariance uncertainty exist at the same time, and the uncertainty of the risk premium has a greater impact on the portfolio than the covariance. The stronger correlation in industries, the higher returns on portfolio.
6. Conclusion
Uncertainty is one of the basic characteristics of the securities market. It is the main research content of portfolio and investor trading behaviour. Much research has focused on the effect of risk premium uncertainty on portfolio returns at present. In this paper, the relative entropy metric is used to measure the degree of uncertainty, and the uncertainty is considered as a hedge investor. This calculation simplifies and guarantees the reversibility of the covariance, shortens the portfolio, and theoretically simplifies the solution process, ensuring a unique and feasible solution.
The optimal solution of mean variance combination under metric, covariance and risk premium uncertainty is studied. On this issue, considering the optimal portfolio with both risk premium uncertainty and covariance uncertainty, the study found that the effect of risk premium and covariance on the portfolio is different, and then consider their differences and relationships. The results show that the effect of the portfolio covariance matrix on the portfolio is limited compared with the influence of the risk premium on the portfolio. The empirical part found that the correlation strength of risk assets has an effect on the expected returns. It is pointed out that in actual financial investment, the effect of risk premium uncertainty on portfolio optimization should be emphasized. At the same time, the stronger is the relationship of assets in portfolio, the weaker is the effect of parameter uncertainty on portfolio.
Disclosure statement
No potential conflict of interest was reported by the authors.
Additional information
Funding
References
- Berger, James O. (1978). Minimax estimation of a multivariate normal mean under polynomial loss. Journal of Multivariate Analysis, 8(2), 173–180.
- Bodnar, T., Mazur, S., & Okhrin, Y. (2017). Bayesian estimation of the global minimum variance portfolio. European Journal of Operational Research, 256(1), 292–307.
- Boyle, P., Garlappi, L., & Uppal, T. (2012). Keynes meets markowitz: the trade-off between familiarity and diversification. Management Science, 253–272.
- Choi, B.-G., Rujeerapaiboon, N., & Jiang, R. (2016). Multi-period portfolio optimization: Translation of autocorrelation risk to excess variance. Operations Research Letters, 44(6), 801–807.
- Hall, A. D., Satchell, S. E., & Spence, P. J. (2015). Evaluating the impact of inequality constraints and parameter uncertainty on optimal portfolio choice. Applied Economics, 47(45), 4801–4813.
- Knight, F. H. (1921). Risk, uncertainty and profit (Vol. 4). Social Science Electronic Publishing.
- Li, X., & Qin, Z. (2014). Interval portfolio selection models within the framework of uncertainty theory. Economic Modelling, 41, 338–344.
- Maccheroni, F., Marinacci, M., & Ruffino, D. (2013). Alpha as ambiguity: Robust mean-variance portfolio analysis. Econometrica, 81(3), 1075–1113.
- Markowitz, H. (1952). Portfolio selection. The Journal of Finance, 7(1), 77–91.
- Qin, Z. (2015). Mean-variance model for portfolio optimization problem in the simultaneous presence of random and uncertain returns. European Journal of Operational Research, 245(2), 480–488.
- Scutellà, M. G., & Recchia, R. (2013). Robust portfolio asset allocation and risk measures. Annals of Operations Research, 204(1), 145–169.
- Tarashev, N. (2010). Measuring portfolio credit risk correctly: Why parameter uncertainty matters. Journal of Banking and Finance, 34(9), 2065–2076.
- Torre, D. L., & Mendivil, F. (2018). Portfolio optimization under partial uncertainty and incomplete information: A probability multimeasure-based approach. Annals of Operations Research, 267(1), 1–13.
- Tütüncü, R. H., & Koenig, M. (2004). Robust asset allocation. Annals of Operations Research, 132, 157–187.
- Xidonas, P., Hassapis, C., Soulis, J., & Samitas, A. (2017). Robust minimum variance portfolio optimization modelling under scenario uncertainty. Economic Modelling, 64, 60–71.
- Yam, S. C. P., Yang, H., & Yuen, F. L. (2016). Optimal asset allocation: Risk and information uncertainty. European Journal of Operational Research, 251(2), 554–561.
- Yuen, F. L., & Yang, H. (2012). Coherent risk measures for derivatives under Black-Scholes economy. International Journal of Theoretical and Applied Finance, 4(5), 819–835.
- Zhu, S., Ji, X., & Li, D. (2015). A robust set-valued scenario approach for handling modeling risk in portfolio optimization. The Journal of Computational Finance, 19(1), 11–40.
- Zymler, S., Rustem, B., & Kuhn, D. (2009). Robust portfolio optimization with derivative insurance guarantees. European Journal of Operational Research, 210(18), 410–424.