
 ?Mathematical formulae have been encoded as MathML and are displayed in this HTML version using MathJax in order to improve their display. Uncheck the box to turn MathJax off. This feature requires Javascript. Click on a formula to zoom.
Abstract
With coordinated charging and discharging, electric vehicles (EVs) in smart car parks can be used as energy storage systems and a reserve against unexpected outrage. In this work, a modeling and control framework for EVs in a smart car park has been built up, which includes key factors such as the charging and discharging costs, the battery degradation cost, the driving probability, the feed-in tariff (FIT), and the vehicle-to-grid (V2G) rebates. Each EVs' charging and discharging activities are scheduled through an optimization route with the purpose to minimize the car park electricity cost. Results from comprehensive simulation studies demonstrate the potential benefits of V2G for car park systems with multiple EVs subject to vehicle and battery characteristics, FIT and policy support.
1. Introduction
1.1. Smart car park and vehicle to grid technology
The use of electric vehicles (EVs) provides a feasible solution to reduce pollution to environment and to improve energy efficiency for transportations systems (Hu et al., Citation2013). The bidirectional power flow between EVs and the grid has enabled the vehicle to grid (V2G) technology. A number of challenges in V2G are discussed in Rahmani-Andebili and Venayagamoorthy (Citation2015) such as stress exerted on power systems and congestion in feeders, which will lead to system overload and uncontrollable load spikes. A smart EV car park is capable of controlling EVs' charging and discharging activities, so as to facilitate power flow and energy storage between vehicles and grid (Sovacool & Hirsh, Citation2009). Private vehicles are mostly under parking status during the daytime, either at home or in public car parks (Hutson et al., Citation2008). Therefore, EVs can be used as energy storage systems and virtual STATCOMs (Mitra et al., Citation2011), the latter provides a new option for transmission line protection (Venayagamoorthy & Mitra, Citation2011). Large quantities of vehicles parking at public car parks will also allow owners or managers of car parks to gain additional benefits through V2G technologies from various feed-in tariffs (FIT)/incentives.
The impacts of plug-in EVs on the grid have been studied in the past decade. When EVs have adequate on-board power electronics, intelligent connections to the grid, and interactive charger hardware control, they can serve as stored energy resources and as a reserve against unexpected outages (Larsen et al., Citation2008). Connection to the grid, control and communication between vehicles and grid operator, and on-board/off-board smart metering are required for beneficial V2G operation (Kempton & Tomić, Citation2005). The car park costs, the emissions benefits, and the impact of EVs on distribution system depend on vehicle and battery characteristics, as well as on charging and discharging strategies. When no smart charging or embedded controllers are available, charge of vehicles can only be taken as loads.
Coordinated smart charging and discharging to optimize power demand is considered as a beneficial and efficient strategy for both grid operator and EV owners (Qian et al., Citation2010). Recent works show that smart charging can minimize EV impact on the power grid, help to shift load and avoid peaks, provided suitable choices are made for intelligent controls (Kempton & Tomić, Citation2005; Lund & Kempton, Citation2008; Qian et al., Citation2010). Direct coordination of charging and discharging can be achieved by means of smart metering, control, and communication. One strategy for getting a higher return for grid operators is to offer real time nonlinear electricity pricing for charging and discharging (Saber & Venayagamoorthy, Citation2010). Each vehicle can be contracted individually or as part of an aggregation. Aggregates of EVs in a group can create a larger, more manageable load for the utility (Guille & Gross, Citation2009). Cooperation between the grid operator and vehicle owners or aggregates is crucial to achieve high net return.
When using smart car parks, replacing traditional vehicles with EVs may impose stress to the power system and create issues such as congestion in feeders, system overload, and spikes in energy market prices if charging of EVs is not properly controlled (Masoum et al., Citation2011). However, the presence of EV aggregates in an area distribution network can be beneficial to a local distribution company, since aggregates can coordinate and manage the charging time of their EVs fleet. With aggregation, it is possible to attract EVs into smart car parks by introducing a variety of incentives to EV owners. Consequently, activities of aggregates such as cooperating with local distribution company or taking part in different power markets such as energy, spinning reserve, and frequency regulation markets can mitigate or remove the above- mentioned problems, and provide benefits to EV owners.
It has been reported that most private vehicles are parked at parking lots in idle state for more than 90% of the time during a day (Saber et al., Citation2011) . Therefore, these energy storage apparatuses become a potential for the aggregates' prosperity to participate in various grid-related activities. A real time load management control strategy is proposed for coordinating the charging time of EVs in order to minimize energy losses in a smart grid, in which the impact of battery degradation to profit is not considered (Deilami et al., Citation2011). A model for V2G performance evaluation for micro grid energy management is presented in Battistelli et al. (Citation2012). A method is proposed to control EVs charging in quasi-real-time for participation of EV aggregates in the energy market (Soares et al., Citation2014). Coordinated charging/discharging of EVs is investigated for voltage control and congestion management (Clement-Nyns et al., Citation2011). A method is developed in Oliveira et al. (Citation2013) for V2G along with capacitor allocation for bus voltage improvement, loss reduction, and congestion management using an artificial immune systems based approach. In Han et al. (Citation2010), EVs have been utilized to support smart grids by offering ancillary service including frequency regulation. In Rahmani-Andebili (Citation2013), aggregate's self-scheduling problem for participating in the spinning reserve market has been modelled using an agent-based model. A probabilistic approach is proposed based on the point estimate method, to determine the optimal capacity and location of EV parking lots in grid networks without considering the battery degradation cost (Mirzaei et al., Citation2015). The feasibility of V2G technology is discussed with the analysis of energy efficiency for multi-port power converters used in EVs (Noel & McCormack, Citation2014). A vehicle owner's cost is estimated to be halved by using V2G (Ma et al., Citation2012). The opportunities and challenges of V2G, vehicle to home and vehicle to vehicle are investigated in Liu et al. (Citation2013). A scheduling method is proposed to ensure adequate charging condition of EVs, and that the power quality of the regulation service can be stabilized (Lin et al., Citation2014).
1.2. Battery degradation
Battery degradation cost may largely affect the use of V2G in practice (Yilmaz & Krein, Citation2013). Adverse factors for batteries in plug-in hybrid EVs and battery EVs include high current rates, deep discharge conditions, low and high operating temperatures (Omar et al., Citation2012). For the energy storage system of any electrically propelled vehicles, the energy capacity, the power for acceleration, regenerative braking for efficiency and cycle life remain to be the critical components (Lukic et al., Citation2008).
The relevance of fast charging under different temperatures to the battery lifetime is analysed in Patel et al. (Citation2010). The main ageing parameters such as internal resistance increase and capacity fade in lithium-ion chemistries are discussed based on half-cell levels (Amine et al., Citation2001). The power fade during the cycle life is studied at two different working temperatures, relating this parameter to the state of health (Wright et al., Citation2002). In Wang et al. (Citation2011), accelerated lifetime tests are performed at different working temperatures and different levels of state-of-charge (SOC) to establish a mathematical relationship between the storage time, temperature and voltage to battery ageing (Ecker et al., Citation2012). In another study on lithium-ion phosphate-based batteries, it is observed that the capacity fade increases with the increase of storage temperature (Kassem et al., Citation2012). The lithium loss has also been identified as a main source of capacity fade. The capacity fade at high temperatures is found to be related to the dissolution of from the
electrode and subsequent deposition of the ions on the carbon electrode, where the metal deposit tends to catalyse the formation of the solid–electrolyte interface layer (Amine et al., Citation2005). It is suggested that the most relevant parameters for battery degradation are the storage temperatures, depth of discharge, current rates and fast charging (Omar et al., Citation2012), among them the charging and discharging will be investigated in this work as they are most relevant to EV operation in a car park.
The above works have provided motivation, understanding and technical feasibility of V2G activities for large-scale EV systems. One factor that is lack of investigation is the impact of battery degradation to the overall EV operational costs. Other factors such as the customer behaviours and V2G rebate from the energy company policy also need to be considered. This drives our work towards a systematic design in an optimization framework.
1.3. Main contributions
The aim of this work is to investigate battery charging and discharging activities in a smart car park so as to minimize car park electricity cost. A model for smart EV car park will be established considering battery degradation cost as a major impact factor. Other factors such as EV battery capacity, charging speed and car park size, FIT, income of rebate, etc., will also be included in the model. With this car park model, the EV charging and discharging operations can be described by on-off switching functions and determined through an optimization design. The constraints on SOC requirements will be incorporated into the optimization.
The novel contributions mainly stay on the following two aspects. (1) An energy cost model is established for a typical car park system with multiple EVs. In this model, both the cost of battery degradation and the income of rebate have been included, where in most previous works only one of them is considered. This model is applicable for flexible car park sizes and different charging modes. (2) The EV charging and discharging activities are determined through optimization design with the use of an genetic algorithm (GA). New insights are obtained from the results and discussions.
The remaining of the paper is organized as follows. A smart car park model is established in Section 2, where the EV charging and discharging status are taken as the control variables to influence the car park profit. Optimization design is proposed to minimize the electricity cost of the car park system. A case study is performed in Section 3, and the discussions are made regarding the impacts of rebate, FIT, battery degradation, battery capacity, charging speed and car park size on the total electricity cost. Conclusions are made in Section 4 . A list of omenclature and acronyms are given in .
Table 1. Nomenclature and acronyms.
2. Smart car park electricity cost minimization
2.1. Electricity cost model
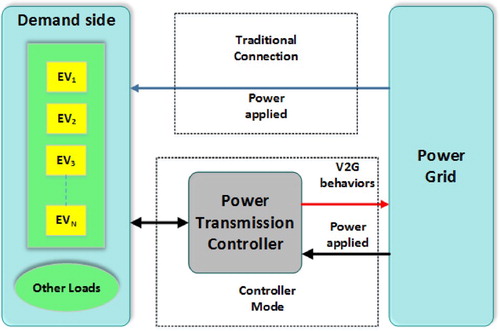
A smart car park system in connection to power grid with and without EVs power transmission controller is illustrated in Figure . In a traditional connection mode, the grid is directly connected to the charging slots and other loads; no feedback provided from the charging slots to the grid. In the controller mode, the grid and charging slots are connected via a power transmission controller which enables the V2G activities. The EVs not only receive power from the grid, but can also send stored energy back to the grid through the charging slots. This bi-directional energy transmission can potentially provide profit for the demand side and in the meantime help to stabilize the power system.
Figure 1. EV car park with power transmission controller for grid connection.
An EV in a car park have three status: charging when the grid sells power to vehicle owners; discharging (V2G) when the extra power from EVs is sent back to grid; and disconnect when there is no power transmission between the grid and vehicle. Denoting as the charging status at time t, the EV battery status can be written as
(1)
(1) The total electricity cost,
, is considered to include four components, i.e.
(2)
(2) where
and
are the costs of charging and discharging, respectively;
is the cost due to battery degradation during charging and discharging; and
is the rebate income. All cost terms are positive in (2). Here the devices investment and maintenance fees are ignored.
Define a sign function as follows
(3)
(3) From the starting time,
, to the finishing time,
, the EV charging cost can be calculated by
(4)
(4) where p is the price of electricity,
is the charging power. Similarly, for EV discharging,
, the income over a review period is calculated by
(5)
(5) where q is the FIT from grid. In this work, the electricity price and the FIT are considered constant. Also
is assumed to be the same for all EVs in the car park under both charging and discharging status.
The battery degradation cost occurs during both charging and discharging. A fixed degradation rate, , is used in this model for both charging and discharging processes. Therefore,
(6)
(6) The rebate depends on the electricity sold to the grid via V2G, which can be calculated by
(7)
(7) where
is the rebate price.
Substituting equations (Equation4(4)
(4) )–(Equation7
(7)
(7) ) into (Equation2
(2)
(2) ), the final cost model can be written as
(8)
(8)
2.2. EV plug-in probability
We now consider the practical situation that a vehicle drives outside for several times during the review period, and the probability of plug-in to car park slots is less than 1. For a fully charged EV, after driving over a distance, its battery SOC is calculated by (Zhou et al. , Citation2011)
(9)
(9) where
is the driving distance since the fully charged status;
is the maximum range that the EV can travel. For an EV taking several drives during the monitoring period, the decrease of SOC can be calculated by considering the travel probabilities for each drive, which is given as
(10)
(10) where
is the jth distance travelled;
is the probability corresponding to
; M is the number of drivings during the review period;
.
is the probability of EV driving out of the car park. In another word, the probability of an EV staying inside the car park is
.
The change of SOC after EV battery charging or discharging is calculated by (Chelladurai et al., Citation2012)
(11)
(11) where
is the battery usable capacity;
is the charging current.
Therefore, the SOC of EV battery at the end of the review period can be calculated by the following function:
(12)
(12) where
is the initial SOC at
, the sign for SOC change by charging is ‘+’ and ‘−’ for discharging.
By considering the probability of an EV staying inside the car park and driving outside, the total cost in (8) becomes
(13)
(13) The above model is developed to calculate the electricity cost for one EV. When multiple EVs are considered in a car park, the total cost will be the sum of costs for each EV, i.e.
(14)
(14) Here N is the number of EVs in a car park.
2.3. Optimization problem
Constraints on battery SOC need to be considered for practical car park EV operations. For an EV battery, its SOC is required to stay between lower and upper bounds at any time, i.e.
(15)
(15) where
is the SOC at time t;
and
are the lower and upper bounds for SOC. In this work, the boundary constraints are considered to be the same for all EVs in the car park. In addition, the required SOC after the last drive each day,
, should satisfy
(16)
(16) where a>0 is a given threshold value.
The range of the charging voltage is taken between 0.95 and 1.05 of the standard level following common practice in industries (Cui et al., Citation2019).
To minimize the total electricity cost by considering constraints on EV batteries, the optimization problem can be formulated as follows.
(17)
(17) In this work, a heuristic global optimization method, Genetic Algorithm (GA), is chosen to solve this optimization problem. A built-in function for GA in Matlab is employed to find the solution. GA is one of the earliest evolutionary optimization methods. It mainly relies on the selection, crossover and mutation operators. GA has certain advantages such as the simple structure, a few parameters and high efficiency. It has been successfully applied to solve many real-world problems (Zou et al., Citation2019). The EV charging and discharging problem is an integer-variable optimization problem. Although some other methods such as differential evolution (DE) and particle swarm optimization (PSO) are also available, it is found that GA is most suitable for solving integer optimization problems, while DE and PSO are more suitable for solving problems with continuous variables (Zaman et al., Citation2016).
3. Simulation studies
3.1. System description
A car park in a typical office area with 50 EV charging slots is considered for the case study. Use of electricity is assessed for working hours from 9 am to 5 pm, divided into 32 time slots with 15 minutes each. Taking Tesla as an example, it is known to be the best sold EV in the world, with the maximum driving distance of 120 miles, the maximum SOC of 0.9 and the minimum SOC of 0.2. It is required that the SOC is kept not less than 0.7 at the end of the day.
Consider three types of charging stations. The first one is called ‘Level 1’ device, often referred to as low power charging or residential charging. EVs are plugged in to low voltage receptacles with a very slow recharging rate. It takes around 15 hours or more for an average full charge. The second type is termed as ‘Level 2’ device which operates faster than Level 1 station by using industrial voltage power to fully charge an EV in less than 5 hours. The third type is called ‘Level 3’ charging station, or fast charging station, which is only available for public charging services other than residential car parks. In this work, the ‘Level 2’ charging, also called the industrial charging, is used as the baseline, in which the voltage is 380 volts and the charging/discharging power is 13.2 kW.
The rebate price is selected to be 0.4 £/kWh and the FIT is chosen to be 0.0485 £/kWh. According to Peterson et al. (Citation2010), the battery degradation cost is 0.3 £/kWh. The price of purchasing power from grid is 0.28 £/kWh. The EV battery usable capacity is set to be 85 kW for the single style EV simulation. These key parameters are listed in Table .
Table 2. Parameter setting.
The data for EV driving behaviours are taken from a survey produced by the authors, in which the number of drivings for each EV is either 0, 1 or 2 during the working hours; the five possible driving distances are considered to be miles, and the probabilities associated with these five driving distances are
, respectively. In this simulation, it is assumed that the probability of EV driving outside is the same for all EVs, the value is calculated from the survey data using an averaged level of
.
3.2. Baseline optimization without rebate
The optimization of charging and discharging without rebate is studied and set up as the baseline system. To start with, 50 EVs with the same battery capacities are considered. These EVs have different initial SOCs, the values are randomly generated within the range of 0.2 to 0.9. The initial SOCs and the optimized costs are listed in Table , and illustrated in Figure . In this study, among the 50 EVs, 15 of them have initial SOCs higher than 0.7 (entries highlighted in bold fonts and underline in Table ), 35 have initial SOCs lower than or equal to 0.7.
Figure 2. Comparison of total costs with and without transmission control.
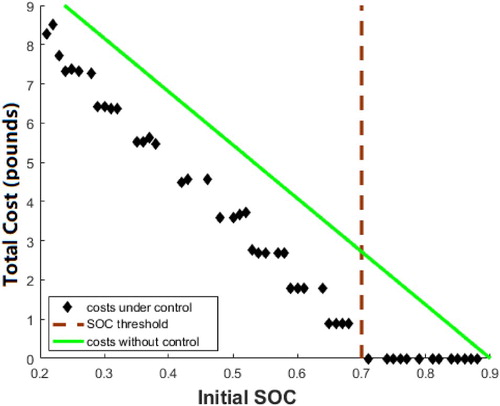
Table 3. Optimized costs vs initial SOCs.
In Figure , the horizontal axis is the initial SOC; the vertical axis shows the minimum costs of each vehicle. The green solid line is the cost without optimization control. The brown dashed line is the final SOC requirement which is set to be 0.7. The black diamond markers stand for the minimized costs for each EVs. It is apparent that the costs by taking the optimally controlled charging/discharging strategies are lower than the costs without control, especially when the initial SOC is higher than 0.7. It can also be found that there are no active V2G activities when no rebate is introduced (see Table ). For those EVs with initial SOC levels higher than 0.7, they are disconnected from the grid, and no charging and discharging activities take place. This is because the battery degradation cost (0.3 £/kWh) is much higher than the fixed FIT (0.0485 £/kWh). Hence, individuals or small scale car parks cannot get the profit from V2G without rebate. When the initial SOCs are close to each other among EVs, their optimized final costs also stay close, which can be seen in Figure and Table .
3.3. Impacts of FIT and degradation rate without rebate
In principle, the lower rate of battery degradation cost, and/or higher level of the FIT will increase the cost benefit for EV users. When the impact of battery degradation cost is more prominent compared to that of FIT, no V2G activities will take place. To examine these characteristics, the FIT is increased by a step of 0.02 £/kWh from its initial setting of 0.0485 £/kWh up to 0.32 £/kWh, and the battery degradation cost is reduced by a step of 0.05 £/kWh from the initial value of 0.3 £/kWh down to 0.05 £/kWh. The results of the optimized costs under different levels of FIT and degradation costs are shown in Table and Figure .
Figure 3. Change of minimum costs with respect to the FIT under different battery degradation rate.
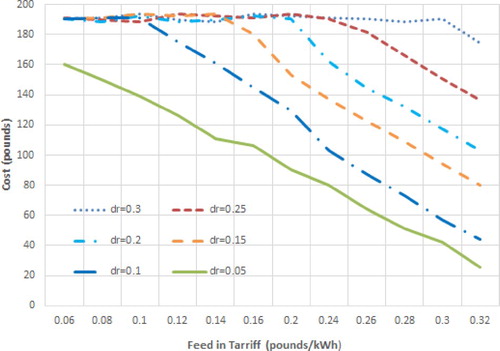
Table 4. Impact of FIT and  to the minimum cost.
For the group of EVs with initial SOCs higher than 0.7, the battery power can be sold to the grid to get profit, i.e. the benefit from the grid is higher than the cost of battery degradation loss. For EVs with initial SOCs not more than 0.7, there are no discharging activities, the batteries only get charged from the grid.
In Figure , the horizontal axis is the FIT ranged from 0.06 to 0.32 £/kWh, and the vertical axis is the minimum costs from the controlled EV charging/discharging operations. Six curves corresponding to 6 levels of degradation rates are shown in the figure, from which it can be seen that when , the optimized cost is mostly maintained at a constant level. This indicates that there is no V2G taking place when the FIT is lower than or equal to the EV battery degradation rate. Once
, a decrease in the costs can be clearly seen, which means V2G takes place and helps to reduce the overall electricity cost for the car park. Those data with V2G cost reduction when
are highlighted in Table with bold font and underline mark.
3.4. Impact of rebate
The rebate is introduced to discuss the conditions enabling V2G benefits. In this simulation, a £200 cash is paid to the car park once the total V2G power reaches 500 kWh, i.e. the rebate price is £/kWh. The results on the numbers of charging/discharging status and the optimized costs for the car park are listed in Table . Figures and show the charging and discharging status without and with rebate, respectively. The horizontal axis is the index for all 50 EVs with 32 time slots each, which gives 1600 in total. The vertical axis is the charging and discharging status where '1' is charging, ‘
’ discharging, and ‘0’ no transmission of power between EVs and the grid. It can be seen from Figure that when no rebate is introduced, there are no V2G activities; V2G activities only take place when rebate is introduced to the optimization, as shown in Figure .
Figure 4. Charging status without rebate.

Figure 5. Charging status with rebate.
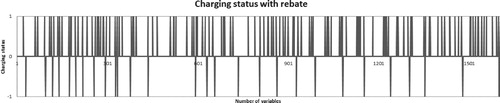
Table 5. Optimized costs and charging/discharging numbers with/out rebate.
The influence of rebate price to the cost benefits is related to other factors such as battery degradation rate and FIT. In principle, only when the sum of FIT and the rebate price is higher than the battery degradation rate, the V2G benefits can be obtained. In Table , the rebate rate is increased from 0.04 £/kWh to 0.28 £/kWh, with an incremental step of 0.02 £/kWh. A clear decrease of costs is seen when the rebate price reaches 0.26 £/kWh, where V2G occurs and the overall cost is reduced.
Table 6. Rebate rates and optimized costs for system with same EVs.
3.5. Impacts of battery capacity, charging style and car park size
In the previous discussions, all EVs are considered to have the same battery capacities. In this section, different EV capacities are used in simulation studies.
In the first simulation study focusing on EV batteries, five rated capacities, 70 kWh, 80 kWh, 90 kWh, 100 kWh and 110 kWh, are assumed for the 50 EVs in the car park. The distribution of each battery capacity level is shown in Figure . Another factor that influences the battery usage is the SOC reduction caused by battery degradation after each daily use, which is assumed to follow exponential distribution within the range from 0.9 to 0.7 for Lithium-Ion Battery (Xu et al., Citation2015). The distribution of battery capacities and the SOC reduction from the fully charged level are both taken into account. The simulation results are shown in Table and Figure . Similar patterns can be observed in Figure as those in Figure . The relationship between the rebate price and the total cost is shown in Table , again, the total cost is decreased when the rebate reaches 0.26 £/kWh, which is consistent to the conclusion when the same EV styles are considered (Table ).
Figure 6. Distribution of different battery capacities of vehicles.
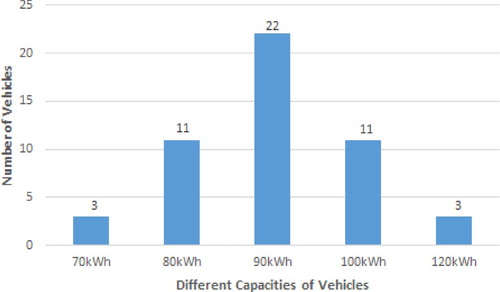
Figure 7. Change of minimum costs with respect to the FIT under different battery degradation rate (multiple battery capacities and SOC reduction)
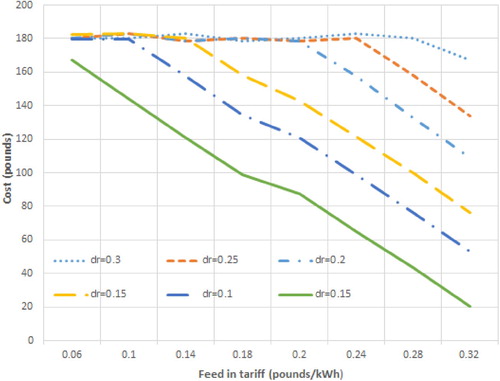
Table 7. Impact of FIT and to the minimum cost.
Table 8. Rebate prices and optimized costs for car park with different EVs.
In the next simulations, the impacts of charging style and size of car park to the electricity cost are discussed. Four battery capacities are considered, 60 kW, 80 kW, 100 kW and 120 kW. The impact of towards the overall cost is compared under three charging styles: residential charging, industrial charging and fast charging. Results are listed in Table and Figure . It can be seen that the overall cost is mostly influenced by the battery capacity rather than the charging styles. When the battery capacity is increased, the overall cost is increased. The use of charging style only affects the speed of charging and discharging. When vehicles are charged at residential power level (low speed charging), the costs appear to be slightly lower than the other two charging modes. This is because the assessment length is 8 hours in this work, which is not always long enough to fully charge an EV using the low speed charging.
Figure 8. Impact of battery capacity to costs under three charging styles.
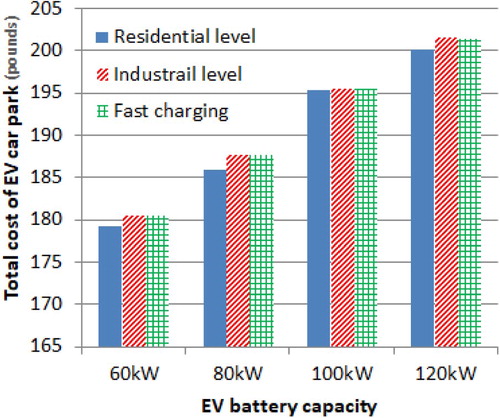
Table 9. Impact of battery capacity and charging style to costs.
By fixing other factors as in Section 3.1, the number of EVs is changed from 20 to 100, the minimum costs are calculated and listed in Table . It can be seen that the increase of car park size will increase the overall costs. However, the V2G activities are not affected by the change of car park size.
Table 10. Impact of smart car park size.
3.6. Simulation studies on weekly data
In the above simulations, an 8-hour review period during a single working day is considered. The initial SOC is not affected by the final SOC in the previous day. In this section, the simulation is made on a longer time period over one week, for the same monitoring period of 9am to 5pm each day. The EV's initial SOC for each day is therefore dependent on the final SOC in the previous day and also the drivings outside the monitoring period. The rebate price is set to £400 when system sells 1000 kWh power to the grid. All the other factors are kept as the same in Section 3.1. The results in Table show that, there are fewer V2G activities on the first day (Sunday), when the smart car park needs to charge the vehicles to satisfy the requirement. On the other days, the system takes more V2G activities to make profit.
Table 11. Assessment of costs over weekly period.
4. Conclusion
In this work, a control method for EV charging and discharging is proposed for smart EV car park systems. The purpose is to minimize the car park electricity cost by controlling the charging and discharging activities when EVs are parked inside. Results from comprehensive simulation studies suggest the potential of V2G benefits, this however, is subject to many factors such as the battery degradation cost, the rebate price, the FIT, and EV's initial SOC. Providing appealing FIT to EV users and improving battery performance are considered to be the main factors that would encourage V2G. The government policy such as grid company rebates will also influence EV users' participation in V2G.
One challenge in modelling smart car park systems is that EVs have different characteristics such as batteries, SOC requirements, users driving patterns and their preferences for V2G scheme, etc., which can only be characterized with a large-scale, complex model. The modeling of these factors and understanding of their impacts towards car park economics need to be further discussed under the proposed framework in the future work.
Disclosure statement
No potential conflict of interest was reported by the author(s).
Additional information
Funding
References
- Amine, K., Chen, C., Liu, J., Hammond, M., Jansen, A., Dees, D., Bloom, I., Vissers, D., & Henriksen, G. (2001). Factors responsible for impedance rise in high power lithium ion batteries. Journal of Power Sources, 97, 684–687. https://doi.org/10.1016/S0378-7753(01)00701-7
- Amine, K., Liu, J., & Belharouak, I. (2005). High-temperature storage and cycling of C-LiFePO4/graphite li-ion cells. Electrochemistry Communications, 7(7), 669–673. https://doi.org/10.1016/j.elecom.2005.04.018
- Battistelli, C., Baringo, L., & Conejo, A. (2012). Optimal energy management of small electric energy systems including V2G facilities and renewable energy sources. Electric Power Systems Research, 92(11), 50–59. https://doi.org/10.1016/j.epsr.2012.06.002
- Chelladurai, A., Sinkaram, L., Asirvadam, V. S., Nor, N. B. M., & Begam, M. (2012). Battery characteristics due to various discharging current and temperatures: A simulation approach. In 2012 IEEE student conference on research and development (SCOReD) (pp. 22–27). IEEE.
- Clement-Nyns, K., Haesen, E., & Driesen, J. (2011). The impact of vehicle-to-grid on the distribution grid. Electric Power Systems Research, 81(1), 185–192. https://doi.org/10.1016/j.epsr.2010.08.007
- Cui, Q., Weng, Y., & Tan, C.-W. (2019). Electric vehicle charging station placement method for urban areas. IEEE Transactions on Smart Grid, 10(6), 6552–6565. https://doi.org/10.1109/TSG.5165411
- Deilami, S., Masoum, A. S., Moses, P. S., & Masoum, M. A. (2011). Real-time coordination of plug-in electric vehicle charging in smart grids to minimize power losses and improve voltage profile. IEEE Transactions on Smart Grid, 2(3), 456–467. https://doi.org/10.1109/TSG.2011.2159816
- Ecker, M., Gerschler, J., Vogel, J., Käbitz, S., Hust, F., Dechent, P., & Sauer, D. (2012). Analyzing calendar aging data towards a lifetime prediction model for lithium-ion batteries. Proceedings EVS (Vol. 26, pp. 1–12).
- Guille, C., & Gross, G. (2009). A conceptual framework for the vehicle-to-grid (V2G) implementation. Energy Policy, 37(11), 4379–4390. https://doi.org/10.1016/j.enpol.2009.05.053
- Han, S., Han, S., & Sezaki, K. (2010). Development of an optimal vehicle-to-grid aggregator for frequency regulation. IEEE Transactions on Smart Grid, 1(1), 65–72. https://doi.org/10.1109/TSG.2010.2045163
- Hu, X., Murgovski, N., Johannesson, L., & Egardt, B. (2013). Energy efficiency analysis of a series plug-in hybrid electric bus with different energy management strategies and battery sizes. Applied Energy, 111(11), 1001–1009. https://doi.org/10.1016/j.apenergy.2013.06.056
- Hutson, C., Venayagamoorthy, G. K., & Corzine, K. A. (2008). Intelligent scheduling of hybrid and electric vehicle storage capacity in a parking lot for profit maximization in grid power transactions. In IEEE energy 2030 conference (pp. 1–8). IEEE.
- Kassem, M., Bernard, J., Revel, R., Pelissier, S., Duclaud, F., & Delacourt, C. (2012). Calendar aging of a graphite/lifepo 4 cell. Journal of Power Sources, 208, 296–305. https://doi.org/10.1016/j.jpowsour.2012.02.068
- Kempton, W., & Tomić, J. (2005). Vehicle-to-grid power implementation: From stabilizing the grid to supporting large-scale renewable energy. Journal of Power Sources, 144(1), 280–294. https://doi.org/10.1016/j.jpowsour.2004.12.022
- Larsen, E., Chandrashekhara, D. K., & Ostergard, J. (2008). Electric vehicles for improved operation of power systems with high wind power penetration. In IEEE 2008 energy 2030 conference (pp. 1–6). IEEE.
- Lin, J., Leung, K.-C., & Li, V. O. (2014). Optimal scheduling with vehicle-to-grid regulation service. IEEE Internet of Things Journal, 1(6), 556–569. https://doi.org/10.1109/JIOT.2014.2361911
- Liu, C., Chau, K., Wu, D., & Gao, S. (2013). Opportunities and challenges of vehicle-to-home, vehicle-to-vehicle, and vehicle-to-grid technologies. Proceedings of the IEEE, 101(11), 2409–2427. https://doi.org/10.1109/JPROC.2013.2271951
- Lukic, S. M., Cao, J., Bansal, R. C., Rodriguez, F., & Emadi, A. (2008). Energy storage systems for automotive applications. IEEE Transactions on Industrial Electronics, 55(6), 2258–2267. https://doi.org/10.1109/TIE.2008.918390
- Lund, H., & Kempton, W. (2008). Integration of renewable energy into the transport and electricity sectors through V2G. Energy Policy, 36(9), 3578–3587. https://doi.org/10.1016/j.enpol.2008.06.007
- Ma, Y., Houghton, T., Cruden, A., & Infield, D. (2012). Modeling the benefits of vehicle-to-grid technology to a power system. IEEE Transactions on Power Systems, 27(2), 1012–1020. https://doi.org/10.1109/TPWRS.2011.2178043
- Masoum, A. S., Deilami, S., Moses, P., Masoum, M., & Abu-Siada, A. (2011). Smart load management of plug-in electric vehicles in distribution and residential networks with charging stations for peak shaving and loss minimisation considering voltage regulation. IET Generation, Transmission & Distribution, 5(8), 877–888. https://doi.org/10.1049/iet-gtd.2010.0574
- Mirzaei, M. J., Kazemi, A., & Homaee, O. (2015). A probabilistic approach to determine optimal capacity and location of electric vehicles parking lots in distribution networks. IEEE Transactions on Industrial Informatics, 12(5), 1963–1972. https://doi.org/10.1109/TII.2015.2482919
- Mitra, P., Venayagamoorthy, G. K., & Corzine, K. A. (2011). Smartpark as a virtual statcom. IEEE Transactions on Smart Grid, 2(3), 445–455. https://doi.org/10.1109/TSG.2011.2158330
- Noel, L., & McCormack, R. (2014). A cost benefit analysis of a V2G-capable electric school bus compared to a traditional diesel school bus. Applied Energy, 126(8), 246–255. https://doi.org/10.1016/j.apenergy.2014.04.009
- Oliveira, D., de Souza, A. Z., & Delboni, L. (2013). Optimal plug-in hybrid electric vehicles recharge in distribution power systems. Electric Power Systems Research, 98, 77–85. https://doi.org/10.1016/j.epsr.2012.12.012
- Omar, N., Daowd, M., Bossche, P. v. d., Hegazy, O., Smekens, J., Coosemans, T., & Mierlo, J. v. (2012). Rechargeable energy storage systems for plug-in hybrid electric vehicles – assessment of electrical characteristics. Energies, 5(8), 2952–2988. https://doi.org/10.3390/en5082952
- Patel, D. D., Tredeau, F. P., & Salameh, Z. M. (2010). Temperature effects on fast charging large format prismatic lithium iron phosphate cells. In 2010 IEEE vehicle power and propulsion conference (VPPC) (pp. 1–4). IEEE.
- Peterson, S. B., Whitacre, J., & Apt, J. (2010). The economics of using plug-in hybrid electric vehicle battery packs for grid storage. Journal of Power Sources, 195(8), 2377–2384. https://doi.org/10.1016/j.jpowsour.2009.09.070
- Qian, K., Zhou, C., Allan, M., & Yuan, Y. (2010). Modeling of load demand due to EV battery charging in distribution systems. IEEE Transactions on Power Systems, 26(2), 802–810. https://doi.org/10.1109/TPWRS.2010.2057456
- Rahmani-Andebili, M. (2013). Spinning reserve supply with presence of electric vehicles aggregator considering compromise between cost and reliability. IET Generation, Transmission & Distribution, 7(12), 1442–1452. https://doi.org/10.1049/iet-gtd.2013.0118
- Rahmani-Andebili, M., & Venayagamoorthy, G. K. (2015). Smartpark placement and operation for improving system reliability and market participation. Electric Power Systems Research, 123(6), 21–30. https://doi.org/10.1016/j.epsr.2015.01.016
- Saber, A. Y., & Venayagamoorthy, G. K. (2010). Intelligent unit commitment with vehicle-to-grid – a cost-emission optimization. Journal of Power Sources, 195(3), 898–911. https://doi.org/10.1016/j.jpowsour.2009.08.035
- Saber, A. Y., & Venayagamoorthy, G. K. (2011). Resource scheduling under uncertainty in a smart grid with renewables and plug-in vehicles. IEEE Systems Journal, 6(1), 103–109.
- Soares, F., Almeida, P. R., & Lopes, J. P. (2014). Quasi-real-time management of electric vehicles charging. Electric Power Systems Research, 108(3), 293–303. https://doi.org/10.1016/j.epsr.2013.11.019
- Sovacool, B. K., & Hirsh, R. F. (2009). Beyond batteries: An examination of the benefits and barriers to plug-in hybrid electric vehicles (PHEVs) and a vehicle-to-grid (V2G) transition. Energy Policy, 37(3), 1095–1103. https://doi.org/10.1016/j.enpol.2008.10.005
- Venayagamoorthy, G. K., & Mitra, P. (2011). Smartpark shock absorbers for wind farms. IEEE Transactions on Energy Conversion, 26(3), 990–992. https://doi.org/10.1109/TEC.2011.2159549
- Wang, J., Liu, P., Hicks-Garner, J., Sherman, E., Soukiazian, S., Verbrugge, M., Tataria, H., Musser, J., & Finamore, P. (2011). Cycle-life model for graphite-LiFePO4 cells. Journal of Power Sources, 196(8), 3942–3948. https://doi.org/10.1016/j.jpowsour.2010.11.134
- Wright, R. B., Motloch, C. G., Belt, J. R., Christophersen, J. P., Ho, C. D, R. A. Richardson, Bloom, I., Jones, S. A., Battaglia, V. S., Henriksen, G. L., Unkelhaeuser, T., Ingersoll, D., Case, H. L., Rogers, S. A., & Sutula, R. A. (2002). Calendar-and cycle-life studies of advanced technology development program generation 1 lithium-ion batteries. Journal of Power Sources, 110(2), 445–470. https://doi.org/10.1016/S0378-7753(02)00210-0
- Xu, X., Li, Z., & Chen, N. (2015). A hierarchical model for lithium-ion battery degradation prediction. IEEE Transactions on Reliability, 65(1), 310–325. https://doi.org/10.1109/TR.2015.2451074
- Yilmaz, M., & Krein, P. T. (2013). Review of the impact of vehicle-to-grid technologies on distribution systems and utility interfaces. IEEE Transactions on Power Electronics, 28(12), 5673–5689. https://doi.org/10.1109/TPEL.2012.2227500
- Zaman, F., Elsayed, S. M., Ray, T., & Sarker, R. A. (2016). Configuring two-algorithm-based evolutionary approach for solving dynamic economic dispatch problems. Engineering Applications of Artificial Intelligence, 53, 105–125. https://doi.org/10.1016/j.engappai.2016.04.001
- Zhou, C., Qian, K., Allan, M., & Zhou, W. (2011). Modeling of the cost of EV battery wear due to V2G application in power systems. IEEE Transactions on Energy Conversion, 26(4), 1041–1050. https://doi.org/10.1109/TEC.2011.2159977
- Zou, D., Li, S., Kong, X., Ouyang, H., & Li, Z. (2019). Solving the combined heat and power economic dispatch problems by an improved genetic algorithm and a new constraint handling strategy. Applied Energy, 237, 646–670. https://doi.org/10.1016/j.apenergy.2019.01.056
Appendix. Survey data probabilities calculation
A survey was taken to collect data from 144 EV users working in an office building from 9 am to 5 pm. The online survey service provides data between the period of December 2016 to January 2017. All EV users responded the survey through online submission. The average results from 144 answers are listed in the appendix.
Table shows the probability of EV driving out of car park. Table shows the probabilities for different driving distances. The probabilities for different driving time periods are listed in Table , and the probabilities for driving out time points are listed in Table . According to the probabilities from the survey, the probabilities for different travelling distance can be calculated and shown in Table .