
 ?Mathematical formulae have been encoded as MathML and are displayed in this HTML version using MathJax in order to improve their display. Uncheck the box to turn MathJax off. This feature requires Javascript. Click on a formula to zoom.
ABSTRACT
Introduction
How do people receive unexpected positive health risk information? While common motivational accounts predict acceptance, consistency accounts such as the cue-adaptive reasoning account (CARA) predict a ‘lack of reassurance’.
Objectives
We therefore tested (1) whether people prefer striving for positivity or retaining a sense of self-consistency (‘lack of reassurance’), and (2) if there are systematic differences in short- and long-term reception, which would indicate temporal dynamics in processing.
Methods
As part of a longitudinal cohort study, participants of a community health screening (N = 1,055) received their actual cholesterol readings. Feedback reception was assessed immediately, at one month and six months.
Results
Processing trajectories for unexpected positive feedback showed a significant ‘lack of reassurance’ effect over time compared with expected positive feedback, while unexpected negative feedback was less threatening than expected negative feedback.
Conclusions
The perseverance of this ‘lack of reassurance’ over time indicates that striving for consistency in self-views is a robust phenomenon, even if it means forfeiting a better view of one’s own health.
The past few years have seen a rapid increase in people’s ability to self-measure health indicators, for instance by testing for hypertension, HIV-infection, diabetes or DNA-based diseases (Bundesgesundheitsministerium, Citation2018; Fleming et al., Citation2015; Roberts et al., Citation2017; Ryan et al., Citation2006). These self-measuring tools are increasingly available online or in pharmacies (Houle, Chuck, & Tsuyuki, Citation2012; Ryan et al., Citation2006), and this development has resulted in an ever-increasing number of people being exposed to health risk information, often without professional assistance. While it is crucial to understand how people receive and process this risk information, most national health organisations focus primarily on the effectiveness, monitoring, and management of health screenings, and the question of how people receive the risk information that the screenings provide is relatively neglected.
From a psychological perspective, personalised feedback that indicates an elevated risk status represents self-relevant, negative, and threatening information for the self (Ditto & Croyle, Citation1995; McQueen, Vernon, & Swank, Citation2013; Renner & Schupp, Citation2011; Renner, Gamp, Schmälzle, & Schupp, Citation2015). Previous research on how health risk feedback is received displays the often-replicated and widely accepted finding that negative health risk feedback is generally less readily accepted than positive information (e.g. Croyle, Sun, & Hart, Citation1997; Kunda, Citation1990; McQueen et al., Citation2013; Taylor & Brown, Citation1988). This asymmetrical acceptance of risk information has been found across a wide range of diseases and samples, and is commonly regarded as ‘self-defensive denial’ or ‘self-defensive motivated reasoning’ (e.g. Armor & Taylor, Citation2003; Baumeister, Bratslavsky, Finkenauer, & Vohs, Citation2001; Croyle et al., Citation1997; Dawson, Gilovich, & Regan, Citation2002; Jacobson et al., Citation2012; Kunda, Citation1990; Mata, Ferreira, & Sherman, Citation2013; Schüz, Schüz, & Eid, Citation2013; Taylor & Brown, Citation1988; for an overview, see Ditto, Citation2009; Helzer & Dunning, Citation2012; McQueen et al., Citation2013).
However, the reception of positive information has been comparatively neglected. It has been widely assumed that positive information indicating a low health risk is readily received. Some studies, however, indicate that positive information may not always be reassuring (Gamp & Renner, Citation2015; Gamp & Renner, Citation2016; Gamp, Schupp, & Renner, Citation2018; Renner, Citation2004; Weinstein et al., Citation2004). This suggests that receiving ‘good news’ leads to a ‘lack of reassurance’ in some participants (Dillard, McCaul, Kelso, & Klein, Citation2006; Harle, Downs, & Padman, Citation2012; Hilgart et al., Citation2010; Linnenbringer, Roberts, Hiraki, Cupples, & Green, Citation2010; Michie et al., Citation2002). Notably, this affects a significant number of people – several studies have shown that up to one third of participants receiving positive feedback show a ‘lack of reassurance’ (Hilgart et al., Citation2010; Meechan, Collins, Moss-Morris, & Petrie, Citation2005; Michie et al., Citation2002). This raises the question, why is positive information not generally readily accepted and reassuring.
Pre-feedback expectations appear to be an important factor modulating the reception of positive information (Gamp et al., Citation2018; Gamp & Renner, Citation2015; Gamp & Renner, Citation2016; Renner, Citation2004; Weinstein et al., Citation2004). Overall, people who receive expected positive information are highly likely to accept it, and maintain a comparably low risk perception. Conversely, people who expect to receive bad news but get positive information instead, seem more hesitant in accepting it, and show a ‘lack of reassurance’. The Cue Adaptive Reasoning Account (CARA; Renner, Citation2004) tries to explain the underlying mechanisms of reluctance in feedback acceptance (see Renner et al., Citation2015 for a detailed description of the model). It suggests that unexpected information, in contrast to expected information, serves as a cue that draws attentional resources for more elaborate processing (Dunn et al., Citation2017), making it more likely that unexpected information is seen as less accurate than expected information, and that plausible alternative explanations are taken into account. This could be because erroneously accepting false positive feedback might lead to substantial harm in the future (e.g. taking fewer preventive measures). Renner (Citation2004) looked at how participants received their actual cholesterol levels in a community health screening, and found support for the CARA contention. As hypothesised, positive feedback (non-elevated cholesterol levels) was not generally met with clear acceptance and reassurance. Specifically, participants receiving unexpected positive cholesterol feedback showed significantly less reassurance (i.e. a higher perceived personal threat for cardiovascular disease) than those receiving expected positive cholesterol feedback. These findings were replicated in experimental studies with randomly assigned fictitious health risk feedback, using different samples and types of risk factors (Gamp & Renner, Citation2015, Citation2016).
However, previous studies have only examined the ‘lack of reassurance’ phenomenon from a static perspective, namely immediately after feedback reception, without assessing risk perception over the long-term. One might argue that while people might be surprised to receive unexpected good information in the short-term, they might embrace the good news over time and lower their risk perceptions accordingly. Thus, the ‘lack of reassurance’ effect might be only a short-term effect where individuals strive to retain a sense of consistency in their self-beliefs when they are given unexpected feedback, but over time positivity striving might lead to similar levels of acceptance of good news to those in the expected positive group. Conversely, one could also propose that the ‘lack of reassurance’ effect persists over time, as pre-feedback expectations might have a long-lasting influence on risk perceptions. A longitudinal study design with multiple measurement points is a crucial prerequisite for examining these possible trajectories and for determining whether the ‘lack of reassurance’ phenomenon mitigates the processing of feedback over time.
The present study
The present study aims to replicate the ‘lack of reassurance’ phenomenon and to extend previous research by taking a longitudinal perspective to examine the short- and long-term effects of health risk feedback on risk perception and the role of pre-feedback expectations in these effects. We examined the reception of actual cholesterol levels in a community health screening and assessed the trajectories of cholesterol risk perception after health risk feedback over the course of three measurement points (immediately, one month and six months after feedback provision), taking pre-feedback expectations into account.
Following the CARA approach, we assumed that (1) while participants receiving negative feedback would show overall higher risk perceptions than those receiving positive feedback (‘valence effect’), (2) pre-feedback expectations would modulate feedback reception. Specifically, we assumed that (2a) unexpected positive feedback would be less reassuring than expected positive feedback (‘lack of reassurance’) and (2b) unexpected negative feedback less threatening than expected negative feedback (Renner, Citation2004). As theoretical conceptions and previous research do not explicitly account for dynamic changes over time and multiple time points, two possible trajectories are conceivable over time for the group receiving unexpected positive feedback with respect to the ‘lack of reassurance’ effect: (3a) since ‘lack of reassurance’ is primarily a short-term effect, risk perceptions will decrease over time, indicating that positivity strivings prevail in the unexpected positive feedback group and lead to similar levels of feedback acceptance as in the expected positive group. (3b) The ‘lack of reassurance’ effect persists over time, with individuals receiving unexpected positive feedback showing higher risk perceptions at all measurement occasions than those receiving expected positive feedback. We also modelled the trajectories of the unexpected and expected negative feedback groups to investigate whether, over the course of time, the participants based their risk perceptions on their expectations.
Method
Design and participants
Data were collected as part of the Konstanz Life Study, a longitudinal cohort study conducted in spring and autumn 2012 and spring 2013, 2016 and 2017 (Renner, Sproesser, Klusmann, & Schupp, Citation2012; also see Gamp et al., Citation2018; Klusmann, Musculus, Sproesser, & Renner, Citation2016; König, Sproesser, Schupp, & Renner, Citation2018; Sproesser, Klusmann, Schupp, & Renner, Citation2015; Szymczak et al., Citation2020, Citation2021; www.uni-konstanz.de/life-studie). The present study focused on data collected at waves 4 and 5 (spring 2016 and spring 2017). Individuals aged 18 years and older from the general population without acute infectious diseases were eligible for participation. Participants were recruited via flyers, posters, newspaper articles, and e-mail-distribution lists from previous waves. All participants gave written informed consent prior to participation. Participants who returned all follow-up questionnaires were eligible to participate in a lottery.
The local ethical review board (University of Konstanz) approved the study protocol [no. 10/2016]. The procedures were performed in compliance with relevant laws and institutional guidelines. We strictly followed the German Psychological Society’s guidelinesFootnote1, which are translated from those of the American Psychological AssociationFootnote2, and the study was conducted in accordance with the Declaration of Helsinki.
Procedure
Upon arrival at the screening site, the participants received a detailed description of the study and signed a consent form. Fasting blood samples were then collected by trained staff from the Red Cross Konstanz and later analysed by a professional laboratory, and the participants’ blood pressure and anthropometric parameters and respective expectations regarding their cholesterol readings assessed (see also Renner et al., Citation2012). Based on these data, participants received a standardised written health risk feedback which indicated their actual numerical cholesterol lipid levels (total cholesterol). Following the definition of the National Institutes of Health (Citation2002), participants whose cholesterol levels were at or above 200 mg/dl received a high-risk status feedback (i.e. they were informed they had elevated cholesterol levels), and participants with readings below this threshold received a low-risk status feedback (i.e. they were informed they had cholesterol levels in the normal range). All participants received a booklet including a description of how to interpret the readings according to medical guidelines when their blood was collected.
Along with their cholesterol readings, participants received a questionnaire assessing their reactions to the feedback and their risk perceptions regarding their cholesterol level. Participants were asked to either return their completed questionnaires by mail in postage-paid envelopes, or to fill them in online. They received follow-up questionnaires one month and six months after the feedback, which they were again asked to return by mail or to fill in online.
Measures
Pre-feedback expectation
At baseline (onsite) assessment, participants were asked to indicate their expectation regarding their cholesterol levels on a 7-point rating scale ranging from 1 (very low) over 4 (normal) to 7 (very high). Participants were classified to a group expecting low to normal cholesterol levels (1-4, low-risk group) or one expecting elevated cholesterol levels (5-7, high-risk group; see Gamp & Renner, Citation2015; Renner, Citation2004).
Risk perception
As the main dependent variable, immediately after receiving written personalised information on their risk status regarding their blood lipid levels, and at intervals of 1 and 6 months, the participants were asked to rate: How worried do you feel because of your cholesterol levels. Ratings were made on a 7-point rating scale ranging from 1 (I am not at all worried) to 7 (I am extremely worried). Affect-related risk perceptions were chosen based on the ‘risk-as-feelings’ hypothesis (Loewenstein, Weber, Hsee, & Welch, Citation2001) which assumes that they are more powerful predictors of protective behaviour compared with numerical-cognitive risk estimates (see also Renner & Reuter, Citation2012).
In addition, general risk perception was assessed as a pre-feedback control variable at the on-site screening. Once the participants’ blood samples were drawn (i.e. about eight weeks before they received written feedback on their results), they were asked: In the past month: How often were you worried because of your cholesterol levels. Answers were given on a 7-point rating scale ranging from 1 (I was never worried during the past month) to 7 (I was worried throughout the past month). The wording of the pre-feedback general risk perception item was slightly adapted in order to fit the measurement occasion. In order to control for pre-feedback differences in general risk perceptions, the measure was included in the analysis as a control variable.
Data preparation and analysis
Participants were assigned to four groups, based on their cholesterol readings and expectations. Specifically, participants receiving expected low-to-normal cholesterol level feedback (<200 mg/dl) were assigned to the ‘expected positive feedback group’ (+|+), whereas participants receiving expected elevated cholesterol level feedback (≥200 mg/dl) were assigned to the ‘expected negative feedback group’ (−|−). Participants receiving unexpected feedback were assigned to the ‘unexpected positive feedback group’ (−|+), and the ‘unexpected negative feedback group’ (+|−), respectively.
493 participants (46.73%) had cholesterol levels at or above 200 mg/dl, of whom 282 (26.73%) were assigned to the unexpected negative feedback group and 211 (20.00%) to the expected negative feedback group. 562 participants (53.27%) had cholesterol levels below 200 mg/dl, of whom 494 (46.82%) were assigned to the expected positive feedback group and 68 (6.45%) to the unexpected positive feedback group.
Statistical analyses were conducted using IBM SPSS (Version 25; IBM, Citation2017) and Mplus 8.2 (Muthén & Muthén, Citation1998–2017). For the analysis of the first two hypotheses (effect of feedback valence and pre-feedback expectations), a mixed ANOVA was conducted using a subsample of participants who filled in all three questionnaires (N = 476; n(+|+) = 222, n(+|−) = 136, n(−|+) = 21, n(−|−) = 97). Power analysis for repeated measures ANOVA (Faul, Erdfelder, Lang, & Buchner, Citation2007) suggested a total of 188 participants to find a medium effect (Cohen, Citation1992) in a 2 (pre-feedback expectation) × 2 (feedback valence) × 3 (time) design (alpha = .05, power = .95; f = .25).
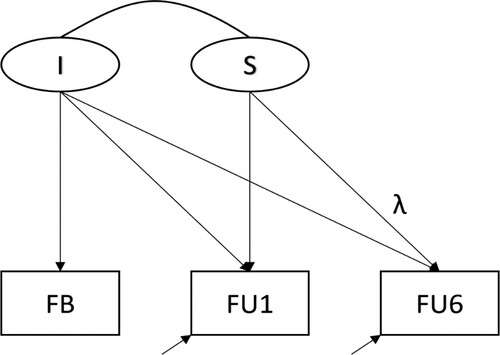
Multigroup longitudinal structural equation models (SEM) were run to analyse both hypothesis 2 and group-specific trajectories over time (hypothesis 3) using the complete sample with full information maximum likelihood (FIML) estimation. A stepwise modelling strategy was adopted to investigate the group-specific trajectories over time. In a first series of models, the unexpected positive feedback group (−|+) was compared to the expected positive feedback group (+|+) (hypotheses 2 and 3). To this end, a completely restricted model with identical trajectories for the two groups was compared to models with both differences at the mean levels and differing shapes of trajectories. Finally, all four groups were analysed with respect to similarities and differences between their risk perception trajectories (see ).
Figure 1. The multigroup structural equation model. Note: The identical model is simultaneously estimated in all groups, allowing for group differences. Due to model identification, measurement residuals can only be estimated for 1-month follow-up (FU1) and 6-months follow-up (FU6) and not for feedback (FB). Additionally, only the loading parameter of FU6 on the latent slope is estimated. All other loading parameters are fixed to unity (not depicted). I = Intercept; S = Slope.
Results
A total of 1,236 participants were recruited in wave 4 of the longitudinal cohort study. Participants from wave 5 (N = 1,053) were only included in the study sample if they had not previously participated. An additional 648 participants from wave 5 were therefore included. Of the total 1,884, 30 participants were excluded because of missing data regarding the blood cholesterol risk indicator, and 38 because of missings on their expected cholesterol readings. In addition, 761 participants did not participate in at least one of the three follow-up measurements after receiving risk feedback. Consequently, 1,055 (68.4% female) participants were included in the analyses. Ages ranged from 18 to 86 with a mean age of 43.69 (SD = 17.66). On average, the sample had completed 15.93 (SD = 2.42, ranging from 8 to 20) years of education, including primary, secondary, and tertiary education. The samples had a mean body mass index (BMI) of 24.04, ranging from 17.32–42.45 (SD = 3.54), which equals a normal weight, according to WHO guidelines (World Health Organization, Citationn.d.). Cholesterol levels ranged from 85 to 343 mg/dl, with a mean of 199.19 (SD = 42.33). Following the definition of the National Institutes of Health (Citation2002), cholesterol levels at or above 200 mg/dl lie outside the normal range.
The drop-out sample (n = 829 participants) did not differ from the study sample (n = 1,055) with regard to BMI (t(1861) = −0.92, p = .358) and pre-feedback expectations (t(1768) = 0.70, p = .485). However, cholesterol levels differed significantly (t(1783) = 5.91, p < .001, d = .28) with a mean cholesterol level 187.98 mg/dl in the drop-out sample (SD = 38.99). Drop-outs were also significantly younger with a mean age of 37.7 years (SD = 16.91, t(1775) = 7.49, p < .001, d = .35), and slightly less educated with a mean of 15.56 years of education (SD = 2.40, t(1819) = 3.24, p = .001, d = .15). Male participants were more likely to drop out than female participants (χ2(1) = 22.58, p < .001, φ = −.11).
The effect of feedback valence and pre-feedback expectations on risk perception
The first hypothesis, which examined the effect of feedback valence on risk perception, was tested using a mixed 2 × 2 × 3 ANOVA (pre-feedback expectation x feedback valence x time). The analysis revealed a significant main effect for the factor feedback valence (F (1, 472) = 5.96, p = .015, = .01), indicating that participants receiving negative feedback showed overall higher risk perceptions compared with participants receiving positive feedback (MFB_negative = 2.68, SD = 1.31 vs. MFB_positive = 1.94, SD = 1.10; hypothesis 1).
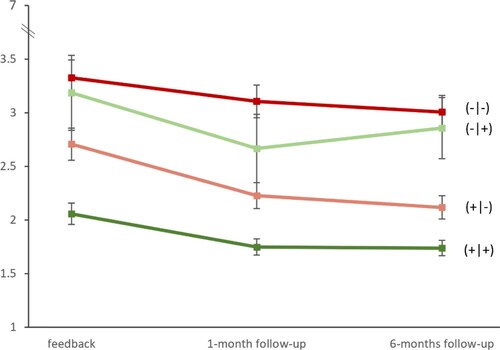
The second hypothesis, which examined the modulating effect of pre-feedback expectations was reflected in a significant main effect for the factor pre-feedback expectation (F (1, 472) = 36.67, p < .001, = .07), with MEx_negative = 3.11, SD = 1.24 vs. MEx_positive = 2.04, SD = 1.16. This indicated that participants receiving unexpected positive feedback (−|+) showed a significantly higher risk perception than participants receiving expected positive feedback (+|+) at all measurement points, indicating a ‘lack of reassurance’ (hypothesis 2a) with M(−|+)FB = 3.19, SD = 1.60 vs. M(+|+)FB = 2.06, SD = 1.48 vs. M(−|+)FU1 = 2.67, SD = 1.46 vs. M(+|+)FU1 = 1.75, SD = 1.11 vs. M(−|+)FU6 = 2.86, SD = 1.31 vs. M(+|+)FU6 = 1.74, SD = 1.07. Likewise, participants receiving unexpected negative feedback (+|−) showed a significantly lower risk perception than participants receiving expected negative feedback (−|−) at all measurement points (hypothesis 2b), with M(+|−)FB = 2.71, SD = 1.75 vs. M(−|−)FB = 3.33, SD = 1.64; M(+|−)FU1 = 2.23, SD = 1.41 vs. M(−|−)FU1 = 3.11, SD = 1.51; M(+|−)FU6 = 2.12, SD = 1.27 vs. M(−|−)FU6 = 3.01, SD = 1.52.
Furthermore, the ANOVA yielded a significant main effect for the factor time (F (1.89, 889.72) = 13.02, p < .001, = .03) with MFB = 2.55, SD = 1.68 vs. MFU1 = 2.20, SD = 1.40 vs. MFU6 = 2.16, SD = 1.33. Hence, risk perception changed over the course of the three measurement points.
Trajectories of risk perception over time
Multigroup longitudinal structural equation models (SEM) were run to test hypotheses 2 and 3. The unexpected positive feedback group (−|+) was first compared to the expected positive feedback group (+|+). To this end, a series of growth curve models was specified (see ). presents the goodness of fit coefficients of the different models. The specified models differed with respect to the differences in the trajectories between the two groups from no differences (Model 1) to completely different trajectories (Model 4). Model 4 is the only fitting model, which indicates that the unexpected positive feedback group (−|+) differed from the expected positive feedback group (+|+) with respect to the initial level of risk perception at feedback (mean intercept), the decrease from feedback assessment to 1-month follow-up (mean slope), and the shape of the following trajectory to 6-months follow-up (lambda 2). (part A) shows the model parameters separately for the two groups. Comparably with the ANOVA-results, we found that the two groups differed with respect to their risk perceptions at feedback (Intercept), with the unexpected positive feedback group (−|+) showing a higher risk perception than the expected positive feedback group (+|+). From feedback to 1-month follow-up, although both groups showed a decline in risk perceptions (negative mean slopes), this decline is steeper for the unexpected positive feedback group (−|+). Interestingly, from 1-month follow-up to 6-months follow-up the unexpected positive feedback group (−|+) shows an increase in risk perception while the expected positive feedback group (+|+) continues with decreasing risk perception. However, the average decline in risk perception from feedback to 6-months follow-up is comparable between the two positive feedback groups, that is, the initial difference in risk perception between the two groups at feedback can also roughly be found at 6-months follow-up, supporting hypothesis 3b (a timely stable ‘lack of reassurance’ effect).
Table 1. Goodness of fit coefficients of 2-group comparisons.
Table 2. Parameter estimates of the unrestricted multigroup longitudinal model.
In addition to the analysis of the two positive feedback groups, the trajectories for all four groups were estimated simultaneously to identify communalities and differences across the four groups. As this analysis is purely exploratory, a model allowing for varying model parameters across all groups was run (χ2 = 3.398; df = 4; p = .415; RMSEA = .000 [.000; .092]; CFI = 1.000; SRMR = 0.029). All model parameters for the expected positive (+|+) and unexpected positive feedback group (−|+) remained perfectly stable (except for slightest differences of 0.001 points for the variance estimates). Hence, part B of presents the model parameters of the unexpected negative (+|−) and expected negative feedback groups (−|−). The mean slope and the loading parameters of 6-months follow-up on the slope also indicate a steady decline in risk perceptions over time for the two groups receiving negative feedback. These declines in risk perception are comparable in size to the declines of the expected positive feedback group (+|+) ().
Figure 2. Means of risk perception over time by feedback valence and pre-feedback expectations. Note: N = 1,055. Error bars show standard errors. Expected negative (−|−), unexpected positive (−|+), unexpected negative (+|−), and expected positive (+|+) feedback.
Control analyses
To examine whether the four groups differed in their general risk perception prior receiving health risk feedback, an additional univariate ANOVA was conducted yielding a significant main effect for the factor ‘group’ (F (3, 475) = 21.01, p < .001, = .12). Post-hoc analyses (uncorrected) revealed that three groups [expected positive (+|+), unexpected positive (−|+), and unexpected negative (+|−) feedback groups] did not differ significantly in their general risk perception before receiving risk feedback. Only the expected negative feedback group (−|−) showed a higher general risk perception as compared to all other groups (M(−|−) = 2.14, SD = 1.48 vs. M(−|+) = 1.62, SD = 1.12 vs. M(+|+) = 1.27, SD = 0.88 vs. M(+|−) = 1.17, SD = 0.78).
Discussion
The present study examined reactions to actual personal health risk information over time, with a main focus on participants who received unexpected positive cholesterol feedback. Consistent with previous findings, a ‘lack of reassurance’ effect was observed (Dillard et al., Citation2006; Gamp et al., Citation2018; Gamp & Renner, Citation2015; Gamp & Renner, Citation2016; Harle et al., Citation2012; Hilgart et al., Citation2010; Linnenbringer et al., Citation2010; Michie et al., Citation2002; Renner, Citation2004; Weinstein et al., Citation2004), with unexpected positive feedback being less reassuring (i.e. reflected in a higher risk perception) than expected positive feedback (hypothesis 2a). Conversely, unexpected negative feedback was less threatening than expected negative feedback (hypothesis 2b), indicating a ‘lack of concern’.
While the ‘lack of concern’ that was observed is reconcilable with most motivational approaches arguing that people possess a fundamental, pervasive desire for positive evaluations (Kunda, Citation1990; Taylor, Citation1983; Taylor & Brown, Citation1988; Zell, Strickhouser, Sedikides, & Alicke, Citation2020), the ‘lack of reassurance’ contrasts with the assumption of self-enhancement and self-defensive strivings. According to many variations of consistency theories, including dissonance theory (Brehm & Cohen, Citation1962; Festinger, Citation1957) and the self-verification theory (Swann, Citation1983; Swann, Rentfrow, & Guinn, Citation2003), once people have formed their self-views they tend to verify and preserve them. Thus, instead of assuming that positive health feedback is generally more readily accepted, consistency theories predict that people prefer feedback or information which validates their self-views and facilitates psychological consistency.
Self-verification processes serve to regulate affect, since receiving non-verifying evaluations can be more stressful than verifying evaluations (Swann, Chang-Schneider, & Angulo, Citation2008). However, both observed phenomena – the ‘lack of reassurance’ and the ‘lack of concern’ – are also in line with the CARA perspective (Gamp & Renner, Citation2016; Renner, Citation2004; Renner et al., Citation2015), which proposes that both unexpected negative and unexpected positive feedback trigger more elaborate feedback processing. As a consequence, recipients are more likely to recognise any possible inconsistencies in the feedback they are given, leading to lower acceptance. Specifically, in the context of consequential health risk feedback, elaborate processing of unexpected positive feedback information can protect the self in the long run despite forfeiting a short-term emotional gain (reassurance), since erroneously accepting false positive feedback might lead to substantial harm and emotional costs in the future if, for example, less preventative measures are taken. Following this line of reasoning, a reluctance to accept unexpected good news could represent an adaptive response (Gamp & Renner, Citation2016; Hilgart et al., Citation2010; Renner, Citation2004). A complementary explanation emerges from considering that individuals brace themselves for possible negative outcomes by strategically lowering their expectations beforehand (e.g. Shepperd, Findley-Klein, Kwavnick, Walker, & Perez, Citation2000). Presumably, participants process unexpected positive feedback more carefully to avoid disappointments in the future. However, people might only examine unexpected positive information carefully when the issue at hand is important, and the potential cost of erroneously accepting the feedback is high (see also Michie et al., Citation2002; Renner, Citation2004).
The present study further extended previous research on health risk feedback by a longitudinal perspective to examine the long-term effects of unexpected positive health risk feedback on risk perception. The emergence of a temporally stable ‘lack of concern’ and ‘lack of reassurance’ (Hypothesis 3b) six months after receiving positive feedback suggests that expectations have a long-lasting effect on perceived risk despite receiving conflicting objective health feedback, as predicted by consistency theories (Brehm & Cohen, Citation1962; Swann, Citation1983; Swann et al., Citation2003).
Interestingly, the longitudinal analysis further revealed differential dynamic processes in the perception of risks. Three of the four groups showed a decline in risk perceptions between the immediate feedback reception and the 6-months follow-up. The accuracy of test result recall generally declines as the recall interval increases. For example, Croyle et al. (Citation2006) found that recall accuracy for exact total cholesterol levels declined from 48% at one month to 31% at six months. Like judgments, memory can also be influenced by defensive biases (Croyle et al., Citation1997; Croyle et al., Citation2006; Greenwald, Citation1980; Kiviniemi & Rothman, Citation2006). Accordingly, one might argue that when memory declines over time, people tend to drift in their risk perceptions to a positive self-view.
However, participants who received unexpected positive risk information showed a U-shaped trajectory in their risk perceptions. Specifically, they showed a comparably steeper decline in their risk perceptions between feedback reception and 1-month follow-up, followed by an increase at 6-months follow-up. This differential pattern over time warrants a complementing explanation. One could argue that strivings for consistency might become more prominent when feedback memory declines. Moreover, participants who received unexpected feedback might be less likely to recall it correctly, being biased in the direction of their pre-feedback expectation. Hence, without further reinforcing incidences, unexpected feedback might only have an immediate but not a long-lasting effect on risk perception, as self-views are relatively resistant to change (Swann et al., Citation2008).
Based on the argument that risk perceptions are biased by pre-feedback expectations, it could have been assumed that the general (pre-feedback) risk perceptions of participants who unexpectedly received positive feedback was also elevated, as they might had displayed pessimism or braced for the worst by lowering their pre-feedback expectations (see Shepperd et al., Citation2000; Taylor & Shepperd, Citation1998). However, control analyses revealed no significant differences in the risk perception of participants who received positive feedback expectedly or unexpectedly. This finding also supports the observed ‘lack of reassurance’ effect, as it is not an epiphenomenon of generally increased risk perception by too ‘worried well’ participants.
A significantly heightened risk perception was only observed for participants who expected and received negative feedback. This finding might reflect differential testing experiences. Participants who received expected negative feedback might have had more test experience (e.g. through previous medical check-ups), leading to more accurate and persistent expectations and hence risk perceptions (Gollwitzer, Thorwart, & Meissner, Citation2018; Rief et al., Citation2015). Further research is needed to examine whether repeated positive and negative health risk feedback might induce differential trajectories, with the latter being more resistant to change.
Implications
From an applied perspective, the results of the two groups receiving expected feedback indicate that people generally have the ability to understand health risk information as it may be given during a physical check-up and to adapt their risk estimations accordingly. However, the findings of the study underline that pre-existing beliefs held by participants about their risk status need to be considered and addressed when informing patients about medical test results. Particularly as it is likely that people with a heightened risk perception in spite of positive feedback more often undergo medically unnecessary future screenings (Michie, Smith, Senior, & Marteau, Citation2003). Thus, if people show reasonable doubt about unexpected positive feedback, further tests might be advisable. However, in the case of inappropriate scepticism, a revision of erroneous beliefs as well as efforts at strengthening confidence in the medical test might be indicated.
Limitations
Several limitations need to be acknowledged when interpreting the present results. Participants who choose to be tested are not representative of the general population, being by definition self-selected. One should be careful about generalising the results with regards to people who refrained from testing. Self-selected participants may, in part, be better prepared – psychologically and behaviourally – for dealing with bad news (see also Croyle et al., Citation1997; Renner, Citation2004). Moreover, with ‘worry' as risk perception measure an affect-related and not numerical-cognitive measure was chosen. Thus, no conclusions for participants' cognitive risk perceptions can be drawn from the present study. However, Gamp and Renner (Citation2016) reported a 'lack of reassurance' by using likelihood-ratings, indicating that the phenomenon affects both affective and cognitive risk estimates. Furthermore, the drop-out sample differed significantly from the study sample with regards to cholesterol levels, age, and sex, suggesting a selective drop-out of healthier people. However, Renner (Citation2004) examined participants’ reaction to two occasions of cholesterol feedback and could show that despite a drop-out of younger and healthier people no systematic differences in feedback reception occurred. Moreover, the assignment to the four groups based on cut-off values is at least partly an artificial distinction. Therefore, interpretation might be limited. In addition, the assignment to the four groups based on the actual cholesterol level and pre-feedback expectation caused unequal group sizes, small sample sizes, and a potential loss of power. However, both the ANOVA and the multigroup structural equation model point to a ‘lack of reassurance’ effect. Still, considering the small sample size of the unexpected positive feedback group, a replication with a bigger sample should be conducted in future studies. Moreover, no imputation was applied to the data used in the ANOVA. However, this was accounted for by using FIML estimations in the structural equation modelling. Finally, the differences in trajectories found in a data driven exploratory analysis need to be replicated in future studies. In this course, reactions to feedback on other medical test results (e.g. blood pressure) could be examined to ensure generalisability of the findings.
Conclusions
To sum up, the observed trajectories in risk perception emphasise the need to consider pre-feedback expectations in both research that examines the reception of health risk feedback and practical settings where patients are informed about medical test results. Moreover, the present study shows for the first time that the ‘lack of reassurance’ phenomenon is seemingly a timely stable effect, implying that pre-feedback expectations have a long-lasting effect on the processing of health risk information.
Declaration of interest
The authors declared that they had no conflicts of interest with respect to their authorship or the publication of this article.
Disclosure statement
No potential conflict of interest was reported by the author(s).
Additional information
Funding
Notes
1 Deutsche Gesellschaft für Psychologie (DGPs); https://www.dgps.de/fileadmin/documents/ethikrl2004.pdf; see paragraph C.III.
2 American Psychological Association (Citation2020), see paragraphs 3.10, and 8.01 to 8.15.
References
- American Psychological Accociation. (2020). Ethical principles of psychologists and code of conduct. American Psychologist, 57(12), 1060-1073. doi:https://doi.org/10.1037/0003-066X.57.12.1060
- Armor, D. A., & Taylor, S. E. (2003). The effects of mindset on behavior: Self-regulation in deliberative and implemental frames of mind. Personality and Social Psychology Bulletin, 29(1), 86–95. doi:https://doi.org/10.1177/0146167202238374
- Baumeister, R. F., Bratslavsky, E., Finkenauer, C., & Vohs, K. D. (2001). Bad is stronger than good. Review of General Psychology, 5(4), 323–370. doi:https://doi.org/10.1037/1089-2680.5.4.323
- Brehm, J. W., & Cohen, A. R. (1962). Explorations in cognitive dissonance. New York, NY: John Wiley & Sons Inc.
- Bundesgesundheitsministerium. (2018). HIV-Selbsttest - Bundesrat beschließt Einführung von HIV-Selbsttests. Bundesministerium für Gesundheit. https://www.bundesgesundheitsministerium.de/hiv-selbsttest.html
- Cohen, J. (1992). A power primer. Psychological Bulletin, 112(1), 155–159. doi:https://doi.org/10.1037/0033-2909.112.1.155
- Croyle, R. T., Loftus, E. F., Barger, S. D., Sun, Y.-C., Hart, M., & Gettig, J. (2006). How well do people recall risk factor test results? Accuracy and bias among cholesterol screening participants. Health Psychology, 25(3), 425–432. doi:https://doi.org/10.1037/0278-6133.25.3.425
- Croyle, R. T., Sun, Y.-C., & Hart, M. (1997). Processing risk factor information: Defensive biases in health-related judgments and memory. In K. Petrie & J. Weinman (Eds)., Perceptions of health and illness: Current research and applications (pp. 267–290). Harwood Academic Publishers.
- Dawson, E., Gilovich, T., & Regan, D. T. (2002). Motivated reasoning and performance on the Wason Selection Task. Personality and Social Psychology Bulletin, 28(10), 1379–1387. doi:https://doi.org/10.1177/014616702236869
- Dillard, A. J., McCaul, K. D., Kelso, P. D., & Klein, W. M. (2006). Resisting good news: Reactions to breast cancer risk communication. Health Communication, 19(2), 115–123. doi:https://doi.org/10.1207/s15327027hc1902_3
- Ditto, P. H. (2009). Passion, reason, and necessity: A quantity-of-processing view of motivated reasoning. In T. Bayne & J. Fernandez (Eds.), Delusion and self-deception: Affective and motivational influences on belief formation (pp. 23–53). New York, NY: Psychology Press.
- Ditto, P. H., & Croyle, R. T. (1995). Understanding the impact of risk factor test results: Insights from a basic research program. In R. T. Croyle (Ed.), Psychosocial effects of screening for disease, prevention and detection (pp. 144–181). New York, NY: Oxford University Press.
- Dunn, C. E., Edwards, A., Carter, B., Field, J. K., Brain, K., & Lifford, K. J. (2017). The role of screening expectations in modifying short–term psychological responses to low-dose computed tomography lung cancer screening among high-risk individuals. Patient Education and Counseling, 100(8), 1572–1579. doi:https://doi.org/10.1016/j.pec.2017.02.024
- Faul, F., Erdfelder, E., Lang, A.-G., & Buchner, A. (2007). G* Power 3: A flexible statistical power analysis program for the social, behavioral, and biomedical sciences. Behavior Research Methods, 39(2), 175–191. doi:https://doi.org/10.3758/BF03193146
- Festinger, L. (1957). A theory of cognitive dissonance. New York, NY: Stanford University Press.
- Fleming, S., Atherton, H., McCartney, D., Hodgkinson, J., Greenfield, S., Hobbs, F. D. R., … Ward, A. (2015). Self-screening and non-physician screening for hypertension in communities: A systematic review. American Journal of Hypertension, 28(11), 1316–1324. doi:https://doi.org/10.1093/ajh/hpv029
- Gamp, M., & Renner, B. (2015). Experience-based health risk feedback and lack of reassurance. Health Psychology and Behavioral Medicine, 3(1), 410–423. doi:https://doi.org/10.1080/21642850.2015.1108197
- Gamp, M., & Renner, B. (2016). Pre-feedback risk expectancies and reception of low-risk health feedback: Absolute and comparative lack of reassurance. Applied Psychology: Health and Well-Being, 8(3), 364–385. doi:https://doi.org/10.1111/aphw.12076
- Gamp, M., Schupp, H. T., & Renner, B. (2018). Risk perceptions after receiving multiple risk feedback. Personality and Social Psychology Bulletin, 44(9), 1350–1363. doi:https://doi.org/10.1177/0146167218767877
- Gollwitzer, M., Thorwart, A., & Meissner, K. (2018). Psychological responses to violations of expectations. Frontiers in Psychology, 8, 2357. doi:https://doi.org/10.3389/fpsyg.2017.02357
- Greenwald, A. G. (1980). The totalitarian ego: Fabrication and revision of personal history. American Psychologist, 35(7), 603–618. doi:https://doi.org/10.1037/0003-066X.35.7.603
- Harle, C. A., Downs, J. S., & Padman, R. (2012). Effectiveness of personalized and interactive health risk calculators: A randomized trial. Medical Decision Making, 32(4), 594–605. doi:https://doi.org/10.1177/0272989X11431736
- Helzer, E. G., & Dunning, D. (2012). On motivated reasoning and self-belief. In S. Vazire & T. D. Wilson (Eds.), Handbook of self-knowledge (pp. 379–396). New York, NY: Guilford Press.
- Hilgart, J., Phelps, C., Bennett, P., Hood, K., Brain, K., & Murray, A. (2010). “I have always believed I was at high risk … ” The role of expectation in emotional responses to the receipt of an average, moderate or high cancer genetic risk assessment result: A thematic analysis of free-text questionnaire comments. Familial Cancer, 9(3), 469–477. doi:https://doi.org/10.1007/s10689-010-9324-y
- Houle, S. K., Chuck, A. W., & Tsuyuki, R. T. (2012). Blood pressure kiosks for medication therapy management programs: Business opportunity for pharmacists. Journal of the American Pharmacists Association, 52(2), 188–194. doi:https://doi.org/10.1331/JAPhA.2012.11217
- IBM. (2017). IBM SPSS statistics for windows. In (Version 25.0) IBM Corp.
- Jacobson, J. A., Ji, L.-J., Ditto, P. H., Zhang, Z., Sorkin, D. H., Warren, S. K., … Roper-Coleman, S. (2012). The effects of culture and self-construal on responses to threatening health information. Psychology & Health, 27(10), 1194–1210. doi:https://doi.org/10.1080/08870446.2011.652963
- Kiviniemi, M. T., & Rothman, A. J. (2006). Selective memory biases in individuals’ memory for health-related information and behavior recommendations. Psychology & Health, 21(2), 247–272. doi:https://doi.org/10.1080/14768320500098715
- Klusmann, V., Musculus, L., Sproesser, G., & Renner, B. (2016). Fulfilled emotional outcome expectancies enable successful adoption and maintenance of physical activity. Frontiers in Psychology, 6, 1–10. doi:https://doi.org/10.3389/fpsyg.2015.01990
- König, L. M., Sproesser, G., Schupp, H. T., & Renner, B. (2018). Describing the process of adopting nutrition and fitness apps: Behavior stage model approach. JMIR MHealth and UHealth, 6(3), e55. doi:https://doi.org/10.2196/mhealth.8261
- Kunda, Z. (1990). The case for motivated reasoning. Psychological Bulletin, 108(3), 480–498. doi:https://doi.org/10.1037/0033-2909.108.3.480
- Linnenbringer, E., Roberts, J. S., Hiraki, S., Cupples, L. A., & Green, R. C. (2010). “I know what you told me, but this is what I think:” perceived risk of Alzheimer disease among individuals who accurately recall their genetics-based risk estimate. Genetics in Medicine, 12(4), 219–227. doi:https://doi.org/10.1097/GIM.0b013e3181cef9e1
- Loewenstein, G. F., Weber, E. U., Hsee, C. K., & Welch, N. (2001). Risk as feelings. Psychological Bulletin, 127(2), 267–286. doi:https://doi.org/10.1037/0033-2909.127.2.267
- Mata, A., Ferreira, M. B., & Sherman, S. J. (2013). Flexibility in motivated reasoning: Strategic shifts of reasoning modes in covariation judgment. Social Cognition, 31(4), 465–481. doi:https://doi.org/10.1521/soco_2012_1004
- McQueen, A., Vernon, S. W., & Swank, P. R. (2013). Construct definition and scale development for defensive information processing: An application to colorectal cancer screening. Health Psychology, 32(2), 190–202. doi:https://doi.org/10.1037/a0027311
- Meechan, G., Collins, J., Moss-Morris, R., & Petrie, K. (2005). Who is not reassured following benign diagnosis of breast symptoms? Psycho-Oncology: Journal of the Psychological, Social and Behavioral Dimensions of Cancer, 14(3), 239–246. doi:https://doi.org/10.1002/pon.841
- Michie, S., Smith, J. A., Senior, V., & Marteau, T. M. (2003). Understanding why negative genetic test results sometimes fail to reassure. American Journal of Medical Genetics, 119A(3), 340–347. doi:https://doi.org/10.1002/ajmg.a.20200
- Michie, S., Weinman, J., Miller, J., Collins, V., Halliday, J., & Marteau, T. M. (2002). Predictive genetic testing: High risk expectations in the face of low risk information. Journal of Behavioral Medicine, 25(1), 33–50. doi:https://doi.org/10.1023/A:1013537701374
- Muthén, L. K., & Muthén, B. O. (1998–2017). Mplus user’s guide (Eighth ed.). Los Angeles, CA: Muthén & Muthén.
- National Institutes of Health. (2002). Final report of the National Cholesterol Education Program (NCEP) expert panel on detection, evaluation, and treatment of high blood cholesterol in adults (adult treatment panel III; NIH Publication No. 02-5215). NIH. http://www.nhlbi.nih.gov
- Renner, B. (2004). Biased reasoning: Adaptive responses to health risk feedback. Personality and Social Psychology Bulletin, 30(3), 384–396. doi:https://doi.org/10.1177/0146167203261296
- Renner, B., Gamp, M., Schmälzle, R., & Schupp, H. T. (2015). Health risk perception. In J. Wright (Ed.), International encyclopedia of the social and behavioral sciences (Vol. 2, pp. 702–709). Oxford, England: Elsevier.
- Renner, B., & Reuter, T. (2012). Predicting vaccination using numerical and affective risk perceptions: The case of A/H1N1 influenza. Vaccine, 30(49), 7019–7026. doi:https://doi.org/10.1016/j.vaccine.2012.09.064
- Renner, B., & Schupp, H. (2011). The perception of health risks. In H. S. Friedman (Ed.), The Oxford handbook of health psychology (pp. 637–665). New York, NY: Oxford University Press.
- Renner, B., Sproesser, G., Klusmann, V., & Schupp, H. (2012). Die konstanzer life-studie. Adipositas: Ursachen, Folgeerkrankungen, Therapie, 6(2), 123–124.
- Rief, W., Glombiewski, J. A., Gollwitzer, M., Schubö, A., Schwarting, R., & Thorwart, A. (2015). Expectancies as core features of mental disorders. Current Opinion in Psychiatry, 28(5), 378–385. doi:https://doi.org/10.1097/YCO.0000000000000184
- Roberts, J. S., Gornick, M. C., Carere, D. A., Uhlmann, W. R., Ruffin, M. T., & Green, R. C. (2017). Direct-to-consumer genetic testing: User motivations, decision making, and perceived utility of results. Public Health Genomics, 20(1), 36–45. doi:https://doi.org/10.1159/000455006
- Ryan, A., Wilson, S., Greenfield, S., Clifford, S., McManus, R. J., & Pattison, H. M. (2006). Range of self-tests available to buy in the United Kingdom: An internet survey. Journal of Public Health, 28(4), 370–374. doi:https://doi.org/10.1093/pubmed/fdl051
- Schüz, N., Schüz, B., & Eid, M. (2013). When risk communication backfires: Randomized controlled trial on self-affirmation and reactance to personalized risk feedback in high-risk individuals. Health Psychology, 32(5), 561–570. doi:https://doi.org/10.1037/a0029887
- Shepperd, J. A., Findley-Klein, C., Kwavnick, K. D., Walker, D., & Perez, S. (2000). Bracing for loss. Journal of Personality and Social Psychology, 78(4), 620–634. doi:https://doi.org/10.1037/0022-3514.78.4.620
- Sproesser, G., Klusmann, V., Schupp, H. T., & Renner, B. (2015). Comparative optimism about healthy eating. Appetite, 90, 212–218. doi:https://doi.org/10.1016/j.appet.2015.03.008
- Swann Jr, W. B. (1983). Self-verification: Bringing social reality into harmony with the self. Social Psychological Perspectives on the Self, 2, 33–66.
- Swann, W. B., Chang-Schneider, C., & Angulo, S. (2008). Self-verification in relationships as an adaptive process. In J. V. Wood, A. Tesser, & J. G. Holmes (Eds.), The self and social relationships (pp. 49–72). New York, NY: Psychology Press.
- Swann Jr, W. B., Rentfrow, P. J., & Guinn, J. S. (2003). Self-verification: The search for coherence. In M. R. Leary & J. P. Tangney (Eds.), Handbook of self and identity (pp. 367–383). New York, NY: The Guilford Press.
- Szymczak, H., Keller, L., Debbeler, L. J., Kollmann, J., Lages, N. C., Gollwitzer, P. M., … Renner, B. (2020). An increase in vigorous but not moderate physical activity makes people feel they have changed their behavior. Frontiers in Psychology, 11, 1–12. doi:https://doi.org/10.3389/fpsyg.2020.01530
- Szymczak, H., Keller, L., Debbeler, L. J., Kollmann, J., Lages, N. C., Sproesser, G., … Renner, B. (2021). “I’m eating healthy now”: The relationship between perceived behavior change and diet. Food Quality and Preference, 89, 104142. doi:https://doi.org/10.1016/j.foodqual.2020.104142
- Taylor, S. E. (1983). Adjustment to threatening events: A theory of cognitive adaptation. American Psychologist, 38(11), 1161–1173. doi:https://doi.org/10.1037/0003-066X.38.11.1161
- Taylor, S. E., & Brown, J. D. (1988). Illusion and well-being: A social psychological perspective on mental health. Psychological Bulletin, 103(2), 193–210.
- Taylor, K. M., & Shepperd, J. A. (1998). Bracing for the worst: Severity, testing, and feedback timing as moderators of the optimistic bias. Personality and Social Psychology Bulletin, 24(9), 915–926. doi:https://doi.org/10.1177/0146167298249001
- Weinstein, N. D., Atwood, K., Puleo, E., Fletcher, R., Colditz, G., & Emmons, K. M. (2004). Colon cancer: Risk perceptions and risk communication. Journal of Health Communication, 9(1), 53–65. doi:https://doi.org/10.1080/10810730490271647
- World Health Organization. (n.d.). Body mass index - BMI. World Health Organization. https://www.euro.who.int/en/health-topics/disease-prevention/nutrition/a-healthy-lifestyle/body-mass-index-bmi
- Zell, E., Strickhouser, J. E., Sedikides, C., & Alicke, M. D. (2020). The better-than-average effect in comparative self-evaluation: A comprehensive review and meta-analysis. Psychological Bulletin, 146(2), 118–149. doi:https://doi.org/10.1037/bul0000218