
 ?Mathematical formulae have been encoded as MathML and are displayed in this HTML version using MathJax in order to improve their display. Uncheck the box to turn MathJax off. This feature requires Javascript. Click on a formula to zoom.
ABSTRACT
Immunogenicity data from phase 1 vaccine studies can be difficult to interpret, especially in seropositive populations and when multiple assays are used. We developed 3 statistical methods (Youden index [YI] threshold, receiver-operating characteristic relative to baseline [ROC-B], and ROC of postdose levels [ROC-P]) to characterize complex immunogenicity data by assessing the proportion of a study population that achieved values above thresholds. The YI method calculates a single threshold per assay. Both ROC methods construct ROC curves for individual assays and surfaces for assay combinations to assess degree of separation of postdose values from a reference distribution; the ROC-B method uses overall predose values as the reference distribution and the ROC-P method uses pooled postdose values. All methods are applicable to a seropositive population with overlapping distributions of baseline and postdose measurements and can evaluate results of multiple assays jointly. The ROC-P method is also applicable when postdose levels are fully separated from baseline levels, as is common in a seronegative population. These methods were demonstrated using data from a phase 1a study of respiratory syncytial virus vaccines formulated with and without an adjuvant in a seropositive population of adults aged ≥60 years. All 3 methods provided a comprehensive assessment of vaccine immunogenicity effects with results presented in easily interpretable formats. In the example data, the methods demonstrated antigen dose response trend and contribution of adjuvant to response in multiple assays individually and jointly where optimal responses in assay combinations (humoral and cellular) are important.
Highlights
Three novel methods to analyze vaccine immunogenicity data are presented
The methods are suitable for immunogenicity analyses of seropositive populations
The methods permit simultaneous assessment of multiple immunogenicity assay data
One method uses postdose data only and is also suitable for a seronegative population
Clinical development of vaccines is a costly, multistage process. A critical step is the selection of a safe and immunogenic formulation from small phase 1 dose-ranging trials. For an adjuvanted vaccine, these studies include comparison of results with and without adjuvant.Citation1 Immune responses are often used as surrogate endpoints of vaccine efficacy even when there is no known correlate of protection.Citation2 Vaccine responses are often measured using antigen-specific immunoglobulin (Ig)G or IgA assays,Citation3-Citation5 competitive antigen-binding assays,Citation6,Citation7 or functional assays that measure neutralizing, bactericidal, or opsonophagocytic killing antibodies,Citation8 and these assays should be properly designedCitation9 and validated.Citation10,Citation11 The safety and immune response profiles from phase 1 studies are used to select formulations for evaluation in larger efficacy studies.
Typically, measures such as postdose geometric mean titers (GMTs), geometric mean fold rises (GMFRs), seroconversion rates, and the percentage of subjects with postdose values above a threshold have been used to identify the most immunogenic formulation in dose-ranging studies.Citation12,Citation13 In analyses of GMTs or GMFRs, data transformation and use of a general linear model that includes baseline measures as a covariate are used to address issues of skewness and heterogeneous variances in data distribution and adjust for baseline effect. Nonetheless, these approaches may still face difficulties in practice. For diseases such as influenza or respiratory syncytial virus (RSV) where adults are frequently re-exposed to the pathogen, the shape of biomarker distributions can vary among assays with varied proportion of the population with antibody level or T cell responses below the detection limit of the assay, and an appropriate data transformation may not exist. Additionally, other differences in distributions of postdose values among formulations, such as variability, heavy tails, and possible heterogeneous vaccine responses among known or unknown subpopulations, can contribute to a portion of the population not reaching a protective level. Thus, additional methods that provide a population view of the data can prove useful.
One commonly used population metric is the seroresponse rate, often defined as a ≥4-fold rise in antibody titer from baseline.Citation12,Citation14,Citation15 The 4-fold rise criterion is a historical convention based on the presumed ± 2-fold analytical variability resulting from serial 2-fold dilutions of sera, but there are drawbacks to using this criterion. First, a clinically significant level of antibodies may be achieved with a <4-fold rise, and use of a 4-fold rise may be illogical when a lower fold rise in antibody levels can be justified based on the precision of a validated assay. Second, vaccine responses may reach a plateau, so that subjects with higher baseline values will have lower fold rises.Citation16
The use of multiple assays also poses challenge to data interpretation. Assays may measure similar responses and be highly correlated, or they may, as for humoral and cellular assays, measure different components of the immune response. It is possible that multiple types of immune responses are required for maximal protection. For example, for RSV vaccines, antibodies might prevent initial infection, and cellular immunity might be important for virus clearance.Citation17 Biomarkers may also measure different aspects of an immune response such as neutralizing versus binding versus epitope-specific antibodies. Multiple assays lead to large amounts of data, and it can be challenging to draw conclusions about an optimal formulation. Additionally, phase 1 studies often maintain a conservative approach to sample size on the basis of safety, particularly for first-in-human studies. Given the combination of small cohort sizes and multiple formulations being studied, the shape of the dose-response curve, and not statistically significant differences among cohorts is generally used to guide dose selection. In the absence of an obvious or consistent dose-response trend in mean responses across multiple biomarkers, methods that evaluate other aspects of data distribution and provide joint assessment of multiple biomarkers provide useful information for dose selection.
To help address these challenges, we developed 3 methods generalized from classic Youden index (YI) cutoff and receiver-operating characteristic (ROC) methods to identify the most immunogenic dose. The YI method, based on the YI cutoff,Citation18 determines a cutoff value for each biomarker that best discriminates between pre- and postvaccination levels and then calculates the probability that the postvaccination values of multiple biomarkers exceed their respective cutoff values individually and in combination. The 2 forms of ROC analysis evaluate immunogenicity as the shift relative to a reference distribution. The ROC relative to baseline (ROC-B) method uses combined baseline values, and the ROC of postdose (ROC-P) method uses pooled postdose values, as a reference distribution. For all 3 methods, the analysis results for each assay alone and for assay combinations can be presented in a visually comprehensible fashion.
In this paper, we describe 3 new statistical methods to analyze immune responses in a seropositive population and illustrate their utility using data from a phase 1a RSV vaccine study evaluating 3 antigen concentrations formulated with or without an adjuvant.
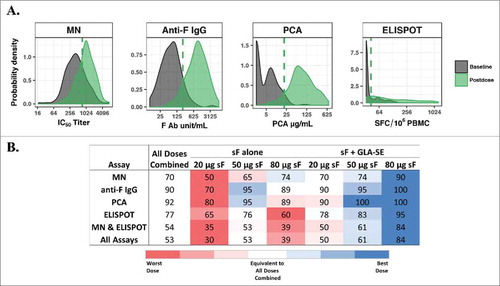
Application of the YI method to data from a phase 1a study of an RSV vaccine evaluating 6 formulations (20, 50, and 80 µg of the RSV F protein with and without 2.5 µg GLA-SE adjuvant) is shown in . The distributions of overall baseline and postvaccination levels from combined dosing arms overlapped for all 4 immunogenicity biomarkers. However, the shapes of the distribution curves were very different among assays (A). YI threshold values (A) were applied to determine the percentage of subjects with postdose values above the threshold level for each biomarker individually, the combined functional (MN) and cellular immune (ELISPOT) response levels, and the combination of all 4 biomarkers, as presented in B, in which 80 µg of RSV sF protein with adjuvant can be readily visualized as the most immunogenic formulation.
Figure 1. Youden index (YI) threshold method. (A) Probability distribution curves of overall baseline levels and postvaccination levels from RSV sF 20, 50, or 80 μg ± 2.5 µg GLA-SE plotted on the log-scale. The dashed line represents the YI threshold value for each biomarker. Threshold values and (baseline percentile) for MN IC50 titer = 739.2 (76%); anti-F IgG = 221.6 units/mL (91%); PCA = 20.7 µg/mL (96%), and ELISPOT = 42.2 SFC/106 PBMC (74%); (B) Percentage of subjects with postvaccination values greater than or equal to the threshold value for each assay or simultaneously for multiple assays. The values for all doses combined are used as a benchmark (white background), and percentages from individual doses are presented in red (lower than), white (equivalent to) and blue (higher than) all doses combined. Red and blue gradients represent the strength of the difference, with the darkest color representing the greatest difference. Ab, antibody; ELISPOT, enzyme-linked immunospot; GLA-SE, glucopyranosyl lipid adjuvant-stable emulsion; IgG, immunoglobulin G; MN, microneutralizing antibody; PBMC, peripheral blood mononuclear cells; PCA, palivizumab-competitive antibody; RSV, respiratory syncytial virus; sF, soluble fusion protein; SFC, spot-forming cells.
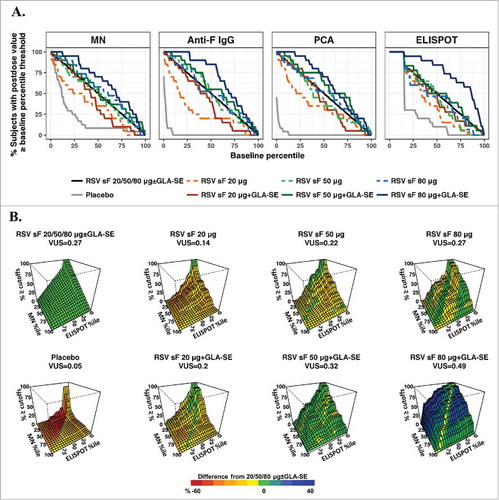
The ROC curves and surfaces are presented in using the ROC-B method measuring separation of a set of postdose values from overall baseline values and in using the ROC-P method measuring separation from pooled postdose values. The ROC curves and surfaces can be used to visualize differences among dose formulations and benchmarked against the overall dose effect of all doses combined. For the MN and ELISPOT assays, in which pre- and postdose responses had large overlap (A), the splay of ROC curves can be seen using both methods ( & ). Because of the overall high postdose response levels in the anti-F IgG and PCA assays, with small overlap between postdose and baseline values, the ROC curves generated by the ROC-B method were not clearly separated and not informative to differentiate between higher antigen doses formulated with adjuvant (A). The ROC-P method was thus more informative for these two assays, given the obvious separation of ROC curves (A). The ROC surfaces for the combination of the MN and ELISPOT assays in both methods ( & ) clearly suggest the formulation containing both adjuvant and 80 µg of RSV sF achieved the highest and most robust immunogenicity responses by moving the levels in both assays higher and away from baseline.
Figure 2. ROC-B method. (A) ROC curves for individual assays. The x-axis represents baseline percentiles and the y-axis is the probability that the postvaccination response was greater than or equal to the baseline percentile threshold. The ROC curve is shown for each formulation and combined arms of 20, 50, or 80 μg of RSV F protein ± GLA-SE; (B) Three-dimensional ROC surface plot for the combination of results from the MN and ELISPOT assays compared to baseline values from all arms combined. The x-axis and y-axis are baseline percentiles for ELISPOT and MN data, respectively, and the z-axis is the percentage of postvaccination values greater than or equal to both the MN and ELISPOT baseline percentile thresholds. The ROC surface is shown for each formulation and for the combination of all (20, 50, and 80 μg) dosage levels of sF combined ± 2.5 µg GLA-SE. The ROC surface for the all doses combined is shown in green and used as a benchmark, and the ROC surface for each individual formulation is shown in red, green and blue representing values on the z-axis lower than, equivalent to and higher than the benchmark ROC surface. ELISPOT, enzyme-linked immunospot; GLA-SE, glucopyranosyl lipid adjuvant-stable emulsion; IgG, immunoglobulin G; MN, microneutralizing antibody; PCA, palivizumab-competitive antibody; ROC, receiver-operating characteristic; ROC-B, receiver-operating characteristic relative to baseline; RSV, respiratory syncytial virus; sF, soluble fusion protein.
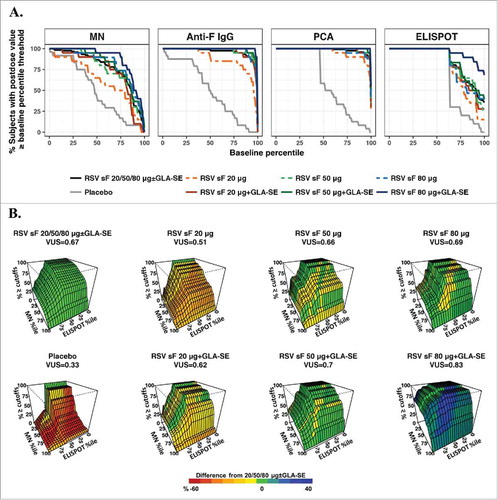
Figure 3. ROC-P method. (A) ROC curves for individual assays. The x-axis represents percentiles of the combined postdose values, and the y-axis is the percentage of postvaccination levels greater than or equal to the corresponding percentile threshold. The ROC curve is shown for each dose arm alone and for the combination of all vaccine formulations; (B) Three-dimensional ROC surface plot for the combination of results from the MN and ELISPOT assays compared to postdose values from all arms combined. The x-axis and y-axis are percentiles of the combined postdose distribution for ELISPOT and MN values, respectively, and the z-axis is the percentage of postvaccination responses greater to or equal than both the MN and ELISPOT thresholds. The ROC surface is shown for each formulation and for all formulations combined. The ROC surface for the all doses combined is shown in green and used as benchmark, and the ROC surface for each individual formulation is shown in red, green and blue representing values on the z-axis lower than, equivalent to and higher than the benchmark ROC surface. ELISPOT, enzyme-linked immunospot; GLA-SE, glucopyranosyl lipid adjuvant-stable emulsion; IgG, immunoglobulin G; MN, microneutralizing antibody; PCA, palivizumab-competitive antibody; ROC, receiver-operating characteristic; ROC-P, receiver-operating characteristic of postdose levels; VUS, volume under the surface.
Traditional dose-response curves can also be assembled using the summary statistic in each method. Using YI and ROC-B methods, the antigen dose-response trend is most visible in the MN and ELISPOT data and biomarker combinations (Supplementary Figs. 3A and 4A). However, in the ROC-P method, the antigen dose-dependent response trend is more profound compared with the other 2 methods, especially for F IgG and PCA results from adjuvanted formulations (Supplementary Fig. 4B). When formulated without adjuvant, the antigen dose responses had nearly plateaued in multiple assays; the two ROC methods provided a smoother dose-response trend (Supplementary Fig. 4) compared to the results from YI method ( and Supplementary Fig. 3A). The dose effect as the difference from the overall dose effect, and adjuvant effect as the difference between adjuvanted and unadjuvanted formulations, can also be evaluated using the summary statistic in each method. In this study, a positive dose effect of the 80 µg RSV sF with the GLA-SE arm relative to the overall dose effect and positive adjuvant effect is demonstrated in all 3 methods, and the results from the YI method are shown in Supplementary Fig. 3B as an example.
Limited phase 1 immunogenicity data to select a formulation to advance into vaccine efficacy studies can be difficult. We developed 3 statistical methods to assess multifaceted immunogenicity data in a seropositive population. These methods are based on probability measurements and complement the commonly used postdose GMTs or GMFRs. First, the methods are appropriate to evaluate population responses in vaccine studies where the goal is to shift the distribution of postvaccination biomarker levels to the right in the majority of the population rather than just to provide the highest absolute mean or median responses. Second, these nonparametric methods avoid assumptions of parametric models and are more robust in the presence of outlying measurements. Third, all 3 methods allow assessment of multiple assays with a combination index. While computationally complex, each method provides a readily interpretable graph that can be used to explain formulation decisions to non-statisticians.
To demonstrate the utility of the methods, we reanalyzed data from a phase 1a study evaluating 6 formulations of an RSV vaccine using 4 immunogenicity biomarkers. These data were previously presented in standard fashion as postvaccination GMTs and GMFRs.Citation20 All 3 methods reached the same conclusion: there was both an antigen dose and adjuvant effect (, , and Supplementary Fig. 3, 4). Compared with the traditional population-based analyses of seroresponse rates using a fixed fold rise (Supplementary Fig. 5) for all biomarkers, the proposed methods demonstrated superior performance.
The methods are similar in that they use the probability of an immunogenicity biomarker above threshold values and joint probability for biomarker combinations as the basis to evaluate postvaccination immunity and all 3 methods are applicable to a seropositive population. The YI and ROC-B methods depend on overlap of measurable baseline and postdose values. The ROC-P method, using only postdose data, applies when postdose values are fully separated from baseline levels, as in a naïve population. The advantage of the YI method is that it applies a single cutoff value for each biomarker and is straightforward and easy to implement and understand. The two ROC methods provide single-biomarker AUC and multi-biomarker VUS values that display the degrees of separation of the postdose biomarker levels from the overall baseline in the ROC-B method or from the pooled postdose levels of all active formulations in the ROC-P method. The ROC methods are computationally more intensive, but they provide cumulative evidence using the full range of biomarker levels as cutoff values.
These methods were also applied to a subsequent phase 1b study of 4 adjuvanted formulations of the same RSV vaccine using results from the same 4 immunogenicity assays (NCT02289820).Citation33 Given the multiple assays and conventional ways data were assessed, and the lack of a consistent trend given the near-plateaued mean response, selecting the most immunogenic dose was challenging. Although the 4 formulations had similar mean responses, the shape of the distribution of postdose values differed, most noticeably in the proportion of subjects who had postdose values at the lower end of the spectrum of values. Results from the YI method (modified by using a combination of prespecified cutoff of 67th percentile of baseline values for MN and approximation of YI cutoff of the 90th percentile of baseline values for the other 3 assays) presented in a table similar to B simplified selection of the most immunogenic formulation across assays individually and in combinations, and were also used to demonstrate the most immunogenic formulation in an older subpopulation.Citation32
The three statistical methods could help facilitate the analysis of immunogenicity data from any early vaccine clinical studies where various dosage levels and formulations are being investigated for a decision which one to progress. In these early clinical development studies, an array of immunogenicity biomarker assays maybe utilized including neutralizing or binding antibodies, immunoglobulin subsets of antibodies, serum or mucosal antibodies and cellular immunity or subsets of cellular immunity (CD4 or CD8 T-cell responses, for example). In addition to analyzing the immunogenicity results univariately, the three methods provide options to jointly evaluate biomarker combinations that investigator deem important such as neutralizing antibody and cellular immunity in RSV, varicella zoster and influenza vaccines with or without adjuvant. This method may also be applicable to therapeutic cancer vaccines where some subjects may have pre-existing immunity to self- or neo-antigens.
The two ROC methods utilize the entire range of the reference distribution as threshold values. This may not be optimal for comparison when segment of the ROC curves or surfaces are none-differentiable across cohorts or when investigators have prior knowledge of a clinically meaningful range of immunity. In these cases, the methods may be modified to partial ROC methods. For combination of more than two biomarkers, the ROC surface would be greater than 3-dimentional and cannot be easily visualized. Future works including evaluation of the new methods in other vaccine studies, exploration of subset analysis and partial ROC methods would expand the utility of the methods and provide better guidance to the researchers.
In summary, we present 3 novel statistical methods to compare postdose immune responses among vaccine formulations. These approaches permit analyses of results of multiple assays simultaneously using a single combination index. Although computationally more complex, results can be presented in easily comprehensible tables and graphs. The new methods provide a simple yet comprehensive summary of complex, multivariate immunogenicity data and could be useful tools for the vaccine community and other studies that seek to differentiate multivariate response data.
Materials and methods
Phase 1a study design
The study (ClinicalTrials.gov identifier: NCT02289820) was a randomized, double-blind, placebo-controlled study conducted as previously described.Citation19 Briefly, 6 consecutively enrolled cohorts of 24 adults aged ≥60 years were randomized in a 5:1 ratio to receive placebo or a vaccine containing an RSV soluble fusion (sF) protein antigen in escalating (20, 50, and 80 μg) doses formulated with and without 2.5 µg glucopyranosyl lipid adjuvant-stable emulsion (GLA-SE) adjuvant. The study was carried out in accordance with the Declaration of Helsinki and Good Clinical Practice guidelines. The study protocol and amendments and the participant informed consent document were approved by an institutional review board. All participants provided written informed consent.
Vaccine immunogenicity assays
Assays were conducted as previously described.Citation19 Briefly, an F-specific interferon-γ enzyme-linked immunospot (ELISPOT) assayCitation21 was used to detect T-cell responses to F peptide pools on days 1 (predose) and 8. Humoral immunity was measured by an RSV microneutralizing antibody (MN) assay that detects IgM, IgA, and IgG neutralizing antibodies to RSV A2; an anti-RSV F-specific IgG (F IgG) assay that detects anti-F neutralizing and non-neutralizing antibodiesCitation22; and a palivizumab-competitive antibody (PCA) enzyme-linked immunosorbent assay that measures IgM, IgA, and IgG antibodies that compete with binding of a protective anti-F antibody, all measured on days 1 and 29.
Statistical methods
Key aspects of the 3 proposed methods are presented in and a flowchart for method selection for different comparison is provided in Supplementary Fig. 1.
Table 1. Outline of the 3 methods.
Notation, statistical method and terminology
The following general notations are used throughout the method descriptions. In a general setting, assume the dose ranging study include K formulation cohorts and nk subjects were enrolled in cohort k, k = 1, …, K. The vaccine immunogenicity effects are assessed using M biomarker assays on samples taken pre- and postdose. xikl and yikl represent value of biomarker assay i for subject l in cohort k from pre- and postdose samples respectively.
For individual biomarker assay i, i = 1, …, M, given a threshold value ti
, the probability of postdose levels greater than ti
is estimated as percentage value of pik
for subjects with postdose assay values yikl
≥ ti
in cohort k, k = 1, …, K, and pi
for subjects across all cohorts. For combination of two biomarker assays i and j and associated threshold values ti
and tj
, the joint probability of postdose assay values exceed both thresholds simotaniously is estimated as the percentage value, pijk
, of subjects with postdose values in cohort k, k = 1, …, K, and the percentage value of subjects across all cohorts is pij
. Similarly, the probability of subjects with postdose values exceed assay thresholds jointly for combination of more than 2 biomarker assays can be estimated. These joint probability estimates for biomarker combinations are used as the statistic measuring the robustness of the immunogenicity responses measured in multiple biomarker assays.
The ROC method measures the separation between two distributions. And in the context of vaccine immunogenicity, the ROC method is designed to measure the separation of distributions of postdose values relative to a reference distribution. A reference distribution is a distribution of biomarker values served as a benchmark distribution to which a distribution of postdose values is compared. Given a threshold value, ti , the probability of the reference distribution less than ti is denoted as qi . For individual biomarker i, i = 1, …, M, increasing the threshold value (ti ) from the minimum to the maximum in the range of reference distribution, a curve between the paired percentage values (qi , pik ), can be generated for each cohort k. This curve is a generalization of the classic ROC curve using paired probabilities (1 − q, p), (Supplementary Fig. 2). The ROC curve jointly displays the 2 distributions, and the area under the curve (AUC) is a global measure of separation between the distributions.Citation23,Citation24 The generalized and classic ROC curves have the same AUC value (Supplementary Figs. 2B and 2C). A higher AUC value (ranging from 0 to 1) suggests that the postvaccination value was shifted further to the right relative to the reference distribution, and an AUC of 1 means a complete separation. The AUC value for ROC curve generated between reference distribution and distribution of postdose values from cohort k is defined as
The ROC curve can be generalized to an ROC surface to evaluate multiple biomarkers jointly. Using 2 biomarkers, i and j, ranging paired threshold values (ti , tj ) from the minimum to the maximum values of respected reference distribution of biomarker values, an ROC surface can be generated from 3 paired percentage values (qi , qj , pijk ). Similar to AUC, a higher volume under the ROC surface (VUS) value (ranging from 0 to 1) implies a higher immune response in both biomarkers simultaneously. The VUS value for ROC surface generated between reference distribution and distribution of postdose values from cohort k is defined as
YI threshold method
The immunogenicity biomarker levels are expected to be boosted from the predose levels postvaccination. Thus, the distribution of postdose levels is expected to shift to the right of the baseline value distribution, and often overlapped in a seropositive population. The goal of YI method is to determine a cutoff value that best discriminates between the distributions of the overall baseline and postvaccination values. Youden Index is commonly used in this scenario which mathematically maximizing the sum (J) of percentage of subjects with postdose levels greater than the threshold and percentage of subjects with predose levels below the threshold.Citation18 The threshold value can be any value between x [j] and x [j + 1] and (x [j] + x [j + 1])/2 can be used, where x [j] is the jth largest value (i.e. order statistic) of overall baseline values at which the maximum value of J is observed.Citation19 The probability of postdose assay values exceed the YI threshold values, pik and pijk , can be calculated for each individual assay and assay combinations.
ROC-B method using all baseline values as a reference distribution
Generalized from the YI method, the ROC type of method can integrate the probability estimate at a single threshold over a range of threshold values of a reference distribution and this measures the overall separation of the two distributions. In ROC-B method, the distribution of overall predose values across all cohorts is used as the reference distribution. The distributions of postdose values are then compared to the reference distribution and the ROC curve and surface measures the separation from the distribution of overall baseline values. The formulation with better immunogenicity effect is expected to shift the postdose values further to the right relative to the distribution of overall predose values. AUC and VUS, the summary statistics of the ROC curve and surface in this method, measure the probability of postvaccination immunity greater than or equal to baseline immunity. The ROC-B method is appropriate when postdose values overlap with the distribution of overall predose values as in a seropositive population. However, the method may fail if the overlap is small and more than one formulation cohorts achieve very high or complete separation from the baseline distribution and in that scenario the ROC-P method can be implemented.
ROC-P method using pooled postdose values of all active doses as a reference distribution
Instead of evaluating the shift relative to the overall baseline immunity levels as in the ROC-B method, the postdose levels of individual formulation can be compared to the reference distribution representing overall dose effect. In the ROC-P method, the distribution of overall postdose values across all active formulation cohorts is used as the reference distribution. The distribution of postdose values from formulations achieving higher than average postdose immune response levels are expected to the right and have greater separation from the reference distribution of pooled postdose values of all doses, thus higher AUC or VUS values. The ROC-P method use postdose data only and can be broadly applied including studies in seronegative population.
Dose selection
To select the most immunogenic formulation using any of the 3 methods, summary statistics (single assay or assay combinations) from the individual formulation (individual dose effect) are compared with the values from all active formulations combined (overall dose effect).
Computation and statistical inferences
The AUC and VUS in ROC-B and ROC-P methods can be estimated through numerical integrationCitation25,Citation26 with q range from 0% to 100% and associated biomarker threshold value (t) calculated as percentile value of the reference distribution.Citation27 For implementing the computation and visualization using the three methods, the computation code using a free statistical software RCitation28 are provided in Supplementary Table 1. In an ROC type of analysis, the bootstrap method is commonly used for estimation of variability and construction of confidence intervals.Citation29-Citation31 In the following examples, bootstrap 95% confidence intervals were calculated from 1000 bootstrap samples, except for the confidence intervals of probability greater than or equal to single threshold value(s), where the Clopper-Pearson exact methodCitation32 was used.
Abbreviations
| AUC | = | area under the curve |
| ELISPOT | = | enzyme-linked immunospot |
| GLA-SE | = | glucopyranosyl lipid adjuvant-stable emulsion |
| GMFR | = | geometric mean fold rise |
| GMT | = | geometric mean titer |
| Ig | = | immunoglobulin |
| MN | = | microneutralizing antibody |
| PBMC | = | peripheral blood mononuclear cells |
| PCA | = | palivizumab-competitive antibodies |
| ROC | = | receiver-operating characteristic |
| ROC-B | = | receiver-operating characteristic relative to baseline |
| ROC-P | = | receiver-operating characteristic of postdose levels |
| RSV | = | respiratory syncytial virus |
| sF | = | soluble fusion protein |
| SFC | = | spot-forming cells |
| VUS | = | volume under the surface |
| YI | = | Youden index |
Disclosure of potential conflicts of interest
All authors are employees of MedImmune, a wholly owned subsidy of AstraZeneca, and may own AstraZeneca stock.
Author contributions
Li Yu and Harry Yang conceived of and refined the statistical analyses. The immunogenicity data were from a clinical trial for which the protocol was written by Judith Falloon with input from Mark T. Esser and Tonya Villafana, and Judith Falloon was the medical monitor for the study and responsible for its execution. Mark T. Esser, with input from Judith Falloon, Tonya Villafana, and Li Yu, led the development and implementation of immunogenicity assays that resulted in generation of the immunogenicity data. All authors participated in analyses of immunogenicity data from that study, and all authors together participated in generating the ideas that led to the development of the statistical analyses by the 2 biostatisticians, Li Yu and Harry Yang. All authors materially participated in article preparation and approved the final article.
Acknowledgments
We thank the study investigators and the study subjects for their contributions. We also thank MedImmune staff Jing Yu, Therese Takas, David Vallo, and Stephanie Chen. inScience Communications, Springer Healthcare (Philadelphia, PA, USA), provided copyediting and formatting support.
Additional information
Funding
References
- Cioppa GD, Jonsdottie I, Lewis D. Challenges in early clinical development of adjuvanted vaccines. Vaccine. 2015;33:B47–51. doi:10.1016/j.vaccine.2015.02.031. PMID:26022568.
- Plotkin SA. Correlates of protection induced by vaccination. Clin Vaccine Immunol. 2010;17:1055–65.
- Robbins HA, Kemp TJ, Porras C, Rodriguez AC, Schiffman M, Wacholder S, et al. Comparison of antibody responses to human papillomavirus vaccination as measured by three assays. Front Oncol. 2013;3:328.
- Goldblatt D, Ashton L, Zhang Y, Antonello J, Marchese RD. Comparison of a new multiplex binding assay versus the enzyme-linked immunosorbent assay for measurement of serotype-specific pneumococcal capsular polysaccharide IgG. Clin Vaccine Immunol. 2011;18:1744–51. doi:10.1128/CVI.05158-11. PMID:21813660.
- Opalka D, Matys K, Bojczuk P, Green T, Gesser R, Saah A, Haupt R, Dutko F, Esser MT. Multiplexed serologic assay for nine anogenital human papillomavirus types. Clin Vaccine Immunol. 2010;17:818–27. doi:10.1128/CVI.00348-09. PMID:20237197.
- Dias D, Doren JV, Schlottmann S, Kelly S, Puchalski D, Ruiz W, Boerckel P, Kessler J, Antonello JM, Green T, et al. Optimization and validation of a multiplexed luminex assay to quantify antibodies to neutralizing epitopes on human papillomaviruses 6, 11, 16, and 18. Clin Diagn Lab Immunol. 2005;12:959–69. PMID:16085914.
- Ruiz W, McClements WL, Jansen KU, Esser MT. Kinetics and isotype profile of antibody responses in rhesus macaques induced following vaccination with HPV 6, 11, 16 and 18 L1-virus-like particles formulated with or without Merck aluminum adjuvant. J Immune Based Ther Vaccines. 2005;3:2. doi:10.1186/1476-8518-3-2. PMID:15842730.
- Romero-Steiner S, Frasch CE, Carlone G, Fleck RA. Use of opsonophagocytosis for serological evaluation of pneumococcal vaccines. Clin Vaccine Immunol. 2006;13:165–9. doi:10.1128/CVI.13.2.165-169.2006. PMID:16467321.
- Plikaytisa BD, Carloneb GM. Statistical considerations for vaccine immunogenicity trials Part 1: introduction and bioassay design and analysis. Vaccine. 2005;23:1596–605. doi:10.1016/j.vaccine.2004.06.046. PMID:15694512.
- Madore DV, Meade BD, Rubin F, Deal C, Lynn F; Meeting Contributors. Utilization of serologic assays to support efficacy of vaccines in nonclinical and clinical trials: meeting at the crossroads. Vaccine. 2010;28:4539–47. doi:10.1016/j.vaccine.2010.04.094. PMID:20470795.
- Findlay J, Smith W, Lee J, Nordblom G, Das I, DeSilva B, Khan MN, Bowsher RR. Validation of immunoassays for bioanalysis: a pharmaceutical industry perspective. J Pharm Biomed Anal. 2000;21:1249–73. doi:10.1016/S0731-7085(99)00244-7. PMID:10708409.
- Beyer W, Palache A, Lüchters G, Nauta J, Osterhaus A. Seroprotection rate, mean fold increase, seroconversion rate: which parameter adequately expresses seroresponse to influenza vaccination? Virus Res. 2004;103:125–32. doi:10.1016/j.virusres.2004.02.024. PMID:15163500.
- Nauta J. Statistics in Clinical Vaccine Trials. Berlin Heidelberg: Springer-Verlag; 2011.
- Katz J, Hancock K, Xu X. Serologic assays for influenza surveillance, diagnosis and vaccine evaluation. Expert Rev Anti Infect Ther. 2011;9:669–83. doi:10.1586/eri.11.51. PMID:21692672.
- Wood J, Gaines-Das R, Taylor J, Chakraverty P. Comparison of influenza serological techniques by international collaborative study. Vaccine. 1994;12:167–74. doi:10.1016/0264-410X(94)90056-6. PMID:8147099.
- Jacobson RM, Grill DE, Oberg AL, Tosh PK, Ovsyannikoval IG, Poland GA. Profiles of influenza A/H1N1 vaccine response using hemagglutination-inhibition titers. Hum Vaccines Immunother 2015;11:961–9. doi:10.1080/21645515.2015.1011990.
- Collins P, Melero J. Progress in understanding and controlling respiratory syncytial virus: still crazy after all these years. Virus Res. 2011;162:80–99. doi:10.1016/j.virusres.2011.09.020. PMID:21963675.
- Youden W. Index for rating diagnostic tests. Cancer 1950;3:32–5. doi:10.1002/1097-0142(1950)3:1<32::AID-CNCR2820030106>3.0.CO;2-3. PMID:15405679.
- Fluss R, Faraggi D, Reiser B. Estimation of the Youden Index and its associated cutoff point. Biometrical J. 2005;4:458–72 doi:10.1002/bimj.200410135.
- Falloon J, Ji F, Curtis C, Bart S, Sheldon E, Krieger D, Dubovsky F, Lambert S, Takas T, Villafana T, et al. A phase 1a, first-in-human, randomized study of a respiratory syncytial virus F protein vaccine with and without a toll-like receptor-4 agonist and stable emulsion adjuvant. Vaccine 2016;34:2847–51. doi:10.1016/j.vaccine.2016.04.002. PMID:27102821.
- Patton K, Aslam S, Lin J, Yu L, Lambert S, Dawes G, Esser MT, Woo J, Janetzki S, Cherukuri A. Enzyme-linked immunospot assay for detection of human respiratory syncytial virus F protein-specific gamma interferon-producing T cells. Clin Vaccine Immunol. 2014;21:628–35. doi:10.1128/CVI.00736-13. PMID:24574540.
- Maifeld SV, Ro B, Mok H, Chu M, Yu L, Yamagata R, Leonardson T, Chio V, Parhy B, Park S, et al. Development of electrochemiluminescent serology assays to measure the humoral response to antigens of respiratory syncytial virus. PLoS One. 2016;11:e0153019 doi:10.1371/journal.pone.0153019. PMID:27070145.
- Hanley JA, McNeil BJ. The meaning and use of the area under a receiver operating characteristic (ROC) curve. Radiology. 1982;143:29–36. doi:10.1148/radiology.143.1.7063747. PMID:7063747.
- Krzanowski WJ, Hand DJ. ROC Curves for Continuous Data. Boca Raton, FL: CRC Press; 2009.
- Genz AC, Malik AA. Remarks on algorithm 006: An adaptive algorithm for numeric integration over an N-dimensional rectangular region. J Comput Applied Math. 1980;6:295–302. doi:10.1016/0771-050X(80)90039-X.
- Bernstsen J, Espelid TO, Genz A. An adaptive algorithm for the approximate calculation of multiple integrals. ACM Transactions Math Software (TOMS). 1991;17:437–51. doi:10.1145/210232.210233.
- Hyndman RJ, Fan Y. Sample quantiles in statistical packages. Am Stat 1996;50:361–5.
- The R Project for Statistical Computing. Available at: https://cran.r-project.org.
- Efron B, Tibshirani R. An Introduction to the Bootstrap. New York: Chapman & Hall; 1993.
- Qin G, Hotilovac L. Comparision of non-parametric confidence intervals for the area under the ROC curve of a continuous-scale diagnostic test. Stat Methods Med Res. 2008;17:207–21. doi:10.1177/0962280207087173. PMID:18426855.
- Good P. Permutation, Parametric and Bootstrap Tests of Hypotheses. New York: Springer; 2005.
- Clopper CJ, Pearson ES. The use of confidence or fiducial limits illustrated in the case of the binomial. Biometrika. 1934;26:404–13. doi:10.1093/biomet/26.4.404.
- Falloon J, Talbot K, Curtis C, Ervin J, Krieger D, Dubovsky F, Takas T, Yu J, Yu L, Lambert SL, et al. Dose selection for an adjuvanted respiratory syncytial virus F protein vaccine for older adults based on humoral and cellular immune responses. Clin Vaccine Immunol. 2017;24:e00157–17.