
ABSTRACT
Purpose: Hospitalized patients with an acute respiratory illness (ARI) were compared to determine if demographic characteristics, timing or influenza vaccination biased who received clinical respiratory viral panel (RVP) testing.
Methods: 171 enrollees in an influenza vaccine effectiveness study and a sample of non-enrollees (N = 1029) admitted to a community hospital with ARI during December 2015 through April 2016 comprised the study sample. Those who received clinical RVP testing (n = 292) were compared to those who did not by age, sex, influenza vaccination status, and period (pre-peak influenza season vs. peak/post peak influenza season), using Chi square- and t-tests, and logistic regression.
Results: Mean age of participants was 70 years, 58% was female and 45% had been vaccinated against influenza in the 2015–2016 season. Those with clinical RVP testing were significantly younger (67 years) than those without RVP (71 years; P < 0.001), but did not differ with respect to sex or vaccination status. The odds of clinical RVP testing were significantly (P = 0.004) related to younger age (< 65 years) (Odds ratio (OR) = 1.51; 95% CI = 1.14–2.00) and to later period (peak/post peak influenza season; OR = 2.64; 95% CI = 1.84–3.79) but were unrelated to influenza vaccination status or the interaction of time and vaccination status.
Conclusion: RVP testing was significantly higher among younger hospitalized patients with an ARI and during the peak and post peak influenza periods than earlier in the season, but influenza vaccination status was not a significant factor. Studies that enroll based on clinical RVP testing should account for potential differences by age.
Introduction
Influenza causes a large burden of hospitalizations in the United States each year.Citation1 Although influenza vaccination reduces the number of hospitalizations,Citation2 influenza vaccine effectiveness (VE) varies annually and controversy exists about VE, especially among seniors. Efficient mechanisms to accurately determine VE are needed, especially with respect to more severe illness.
Respiratory viral panel (RVPs) are reverse transcription polymerase chain reaction tests to detect the presence of multiple respiratory viruses including influenza, from a single naso-pharyngeal specimen. Given the increasing clinical use of RVPs in the inpatient setting, the question arises as to whether clinical RVPs can substitute for research-specific specimens to estimate influenza VE or if the clinicians ordering RVPs are biased by knowledge of underlying influenza vaccination status. The purpose of this brief report is to explore that potential bias, if any, among 1,200 adults hospitalized for acute respiratory illness (ARI) in a community hospital during the 2015–2016 influenza season.
Results
In Pittsburgh and generally throughout the U.S., in the 2015–2016 influenza season, influenza cases that required hospitalization began in February 2016 later than usual (December or January) and the predominant virus causing illness was influenza A(H1N1)pdm09. The characteristics of the study sample admitted during the study period are shown in by clinical RVP status. The entire study sample (N = 1,200) consisted of older adults (mean age = 70 years), 58% of whom was female and 45% of whom had been vaccinated against influenza in the 2015–2016 season (data not shown in ). In bivariate analyses during the entire study period, those who received clinical RVP testing were significantly younger (66.8 ± 14.4 years; ) than those not tested (71.3 ± 14.9 years; P < 0.001). RVP testing was more common among adults < 65 years (30.8%) than among older adults (21.1%; p = 0.0002).
Table 1. Clinical respiratory virus panel (RVP) testing by demographic characteristics and influenza vaccination status.
Of all 292 RVPs performed throughout the study period, the fewest were performed during December 2015 (n = 42, 15%) and January 2016 (n = 41, 14.3%), rising to a peak number performed in March 2016 (n = 78, 32.6%; see ), with significant differences by month (P < 0.001). The odds of ordering clinical RVP testing increased two-fold in the months of February, March and April 2016 as compared to December 2015 and they were directly related to the peak/post peak influenza circulation period. Clinical RVP testing did not vary by vaccination status either during the pre-peak or peak/post peak influenza season (P = 0.204).
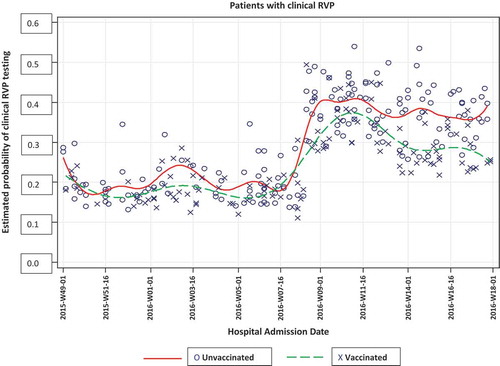
In unadjusted logistic regression, vaccination status was not related to clinical RVP testing (). This finding did not change when adjusting for age. The pattern of RVP testing for vaccinated and unvaccinated patients by hospital admission date is shown in . The logistic regression model was adjusted by age, period (pre-peak, peak/post peak influenza season) and the interaction of vaccination status by period. The odds of receiving RVP testing were significantly higher among younger individuals (< 65 years) (Odds ratio (OR) = 1.51; 95% Confidence Interval (CI) = 1.14–2.00; P = 0.004) and during the peak/post peak influenza period (OR = 2.64; 95%CI = 1.84–3.79, P = 0.0001); the interaction term of vaccination status and time was not related to likelihood of RVP testing (OR = 0.73; 95% CI = 0.43–1.26; P = 0.261, data not shown in ). In sensitivity analyses comparing the VE study enrollees and non-enrollees with RVP, significantly more females were enrolled in the VE study and a smaller proportion of RVP-tested patients were enrolled in the VE study during December when screening was intentionally light (Appendix ).
Table 2. Odds of respiratory virus panel (RVP) testing by influenza vaccination status (unadjusted), odds of respiratory virus panel (RVP) testing by influenza vaccination status adjusted by age, and odds of RVP testing by influenza vaccination status, adjusted by age group (< 65 vs. ≥ 65 years), period, and vaccination by period interaction for the 2015–2016 influenza season.
Figure 1. Spline curves showing date of clinical respiratory viral panel (RVP) testing by vaccination status for 292 inpatients using multivariable logistic model with interaction of time and vaccination status.
Discussion
At the time of this study, Centers for Disease Control and Prevention (CDC) guidelines recommended that respiratory virus testing be performed as early as possible in hospitalized patients with suspected influenza.Citation3 Current CDC guidelines recommend collecting an upper respiratory tract specimen for hospitalized patients without lower respiratory tract disease and consideration of collection of lower respiratory tract specimens if upper respiratory tract specimens are negative and if positive testing would change clinical management.Citation4 Because RVPs are relatively new and expensive, it has been speculated that physicians might restrict ordering RVPs to patients known to be unvaccinated against influenza or to younger adults who are less likely to be vaccinated, or physicians may simply be following CDC recommendations to initiate antiviral treatment empirically without waiting for test results.
We did not find any significant overall association between vaccination and RVP ordering. During the peak/post peak period, a borderline (P = 0.058) trend was noted in one subanalysis (). However, an overall analysis adjusted by time period found no association (). Whether this represents a random effect, confounding by some other unmeasured factors, or a potential bias is unknown.
Selection bias is a threat to the validity of many studies Citation5–Citation7 and should be considered both at the design phase and during the conduct of the study. In clinical research, common causes of selection bias include the use of multiple subset analyses, inclusion/exclusion criteria and investigator bias.Citation8 Selection bias also occurs when the outcome and primary exposure affect participation in the study.Citation9 However, in this study, the likelihood of RVP clinical testing increased as the season progressed, but did not vary with the primary exposure, i.e., influenza vaccination status, or with the interaction of vaccination status and period, suggesting that influenza vaccination status is not a causal effect of bias in study enrollment based on clinical RVP testing.
Strengths and limitations
To our knowledge, this is the first study to examine selection bias related to RVPs for the inpatient test-negative design. This analysis was based on patient recruitment at a community hospital at which research is less common than in other tertiary care hospitals in the health system. Thus, the results are more likely to be applicable to community hospitals than tertiary institutions. Secondly, limited clinical data such as co-morbidities were extracted for assessing confounders. Thirdly, many of the admitting physicians in this hospital were trained and mentored by a study author (DBM), which might promote uniformity of performance in deciding whether and when to order clinical RVPs based on clinical presentation. Finally, vaccination records came from our health system, which is supplemented by the state immunization registry; evidence of vaccinations received elsewhere was not sought.
Conclusion
Clinical RVPs are useful for identifying the causative agent for patients hospitalized with an acute respiratory illness. We found no evidence that influenza vaccination status was related to clinical RVP testing. Because of the potentially serious consequences of influenza in hospitalized patients, rapid turnaround testing should be initiated irrespective of the vaccination status of the patient, to enable the clinician to continue antiviral treatment if influenza has been confirmed. Clinical RVP testing may be useful in VE studies; additional studies in other influenza seasons and settings are warranted.
Methods
Electronic medical record (EMR) data extractions were conducted as part of a study of influenza VE among adult inpatients at a 240-bed community hospital in Pittsburgh. From December 1, 2015 through April 30, 2016, daily lists of all patients admitted with symptoms of new or worsening acute respiratory illness (ARI) were generated based on a bioinformatics scan of the EMR for ICD10 codes and symptoms (see Appendix ). From the patients identified with ARI, those who were ≥ 18 years of age, admitted for ≤ 72 hours were eligible. A random sample of patients meeting the enrollment criteria (n = 1029) and all enrollees of the influenza VE study (additional eligibility criterion was having a RVP collected ≤ 10 days from illness onset; n = 171) comprised the study sample (total N = 1200). (See flow diagram in .) De-identified variables for this analysis included age, sex, admission date, RVP done (yes/no), and influenza vaccination status (yes/no) from the EMR. This study was reviewed and approved by the Institutional Review Board of the University of Pittsburgh.
Figure 2. Flow diagram.
Analysis
Because influenza can begin circulating in December, screening and enrollment for the VE study began December 1, 2015 (2015-W49-01). For this study, the influenza season was defined as the time during which influenza was circulating, as indicated by the first enrolled participant with a positive influenza test result until the end of April 2016. Descriptive statistics are presented as means and standard deviations for age and as percentages for the discrete measures. Two-sample t-tests were used for comparisons between age and RVP status. Chi-square tests were used to compare the differences between, sex, vaccination status, age group (< 65 years vs. ≥ 65 years), month, pre-peak influenza vaccination status, peak/post peak influenza vaccination status and clinical RVP status. Logistic regression analyses were used to estimate the odds of receiving RVP testing with vaccination status and adjusted for age group (< 65 years vs. ≥ 65 years), period (classified as pre-peak = December 1, 2015 (2015-W49-01)-February 24, 2016 (Citation2016-W09-24) and peak/post peak = February 25, 2016 (Citation2016-W09-25)-April 30, 2016 (Citation2016-W18-30)) and the interaction of period and vaccination status. We have fitted two adjusted models one with age group and the other adjusted model with age group, period and interaction of period and vaccination status. The main interest refers to the causal effect of vaccination status after adjusting for the secondary effect(s). limits the estimates of the vaccination status under different models with the adjusted factors reported in the footnote of the .Citation10 The predicted probability of getting an RVP as a function of time for unvaccinated and vaccinated patients was determined using spline functions (). Statistical significance was defined as two-sided P value ≤ 0.05. All analytical procedures were performed using SAS® version 9.3. The week date system in this section as well as in refers to the nearest date per ISO8601 standard.
Disclosure of potential conflicts of interest
Richard Zimmerman has/had research grants from Sanofi Pasteur, Pfizer Inc. and Merck & Co., Inc. Mary Patricia Nowalk has/had grant funding from Pfizer, Inc. and Merck & Co., Inc.
Additional information
Funding
References
- Zhou H, Thompson WW, Viboud CG, Ringholz CM, Cheng P-Y, Steiner C, Abedi GR, Anderson LJ, Brammer L, Shay DK. Hospitalizations associated with influenza and respiratory syncytial virus in the United States, 1993-2008. Clin Infect Dis. 2012;54(10):1427–1436. doi:10.1093/cid/cis211.
- Reed C, Chaves SS, Kirley PD, Emerson R, Aragon D, Hancock EB, Butler L, Baumbach J, Hollick G, Bennett NM, et al. Estimating influenza disease burden from population-based surveillance data in the United States. PloS one. 2015;10(3):e0118369. doi:10.1371/journal.pone.0118369.
- Centers for Disease Control and Prevention. Guidance for clinicians on the Use of RT-PCR and Other molecular assays for diagnosis of influenza virus infection. 2016; https://www.cdc.gov/flu/professionals/diagnosis/molecular-assays.htm. Accessed 2017 Jul 1.
- Centers for Disease Control and Prevention. Information on rapid molecular assays, RT-PCR, and other molecular assays for diagnosis of influenza virus infection; https://www.cdc.gov/flu/professionals/diagnosis/molecular-assays.htm. Accessed 2018 05 30, 2018.
- Suissa S, Ernst P. Bias in observational study of the effectiveness of nasal corticosteroids in asthma. J Allergy Clin Immunol. 2005;115(4):714–719. doi:10.1016/j.jaci.2004.12.1118.
- Jackson LA, Jackson ML, Nelson JC, Neuzil KM, Weiss NS. Evidence of bias in estimates of influenza vaccine effectiveness in seniors. Int J Epidemiol. 2006;35(2):337–344. doi:10.1093/ije/dyi274.
- Lipsitch M, Tchetgen ET, Cohen T. Negative controls: a tool for detecting confounding and bias in observational studies. Epidemiology (Cambridge, Mass). 2010;21(3):383. doi:10.1097/EDE.0b013e3181e9edc4.
- Miller KD, Rahman ZU, Sledge GW Jr. Selection bias in clinical trials. Breast Dis. 2001;14(1):31–40.
- Lash T, Fox MP, Fink AK. Applying quatitative bias analysis to epidemiologic data. New York, NY: Springer-Verlag; 2009. p. 43–57.
- Westreich D, Greenland S. The table 2 fallacy: presenting and interpreting confounder and modifier coefficients. Am J Epidemiol 2013; 177(4):292–298
Table A1. Qualifying symptoms/syndromes for acute respiratory illness.
Table A2. Demographic and other characteristics of patients with RVP who were enrolled in the influenza vaccine effectiveness study and those who were not enrolled.