
ABSTRACT
Introduction: Human papillomavirus (HPV) vaccine coverage in Australia is 80% for females and 76% for males. Attitudes may influence coverage but surveys measuring attitudes are resource-intensive. The aim of this study was to determine whether Twitter-derived estimates of HPV vaccine information exposure were associated with differences in coverage across regions in Australia.
Methods: Regional differences in information exposure were estimated from 1,103,448 Australian Twitter users and 655,690 HPV vaccine related tweets posted between 6 September 2013 and 1 September 2017. Tweets about HPV vaccines were grouped using topic modelling; an algorithm for clustering text-based data. Proportional exposure to topics across 25 regions in Australia were used as factors to model HPV vaccine coverage in females and males, and compared to models using employment and education as factors.
Results: Models using topic exposure measures were more closely correlated with HPV vaccine coverage (female: Pearson’s R = 0.75 [0.49 to 0.88]; male: R = 0.76 [0.51 to 0.89]) than models using employment and education as factors (female: 0.39 [−0.02 to 0.68]; male: 0.36 [−0.04 to 0.66]). In Australia, positively-framed news tended to reach more Twitter users overall, but vaccine-critical information made up higher proportions of exposures among Twitter users in low coverage regions, where distorted characterisations of safety research and vaccine-critical blogs were popular.
Conclusions: Twitter-derived models of information exposure were correlated with HPV vaccine coverage in Australia. Topic exposure measures may be useful for providing timely and localised reports of the information people access and share to inform the design of targeted vaccine promotion interventions.
Introduction
The human papillomavirus (HPV) vaccination was introduced for Australian girls in 2007 and extended to include boys in 2013. Coverage rates in girls ranged from 62.9% to 85.6% in 2015–2016 and 62.5% to 83.5% for boys in the same time period.Citation1 Early evidence of the impact of HPV vaccination in Australia suggests substantial decreases in the prevalence of HPV type infections and the incidence of cervical lesions.Citation2 While healthcare access is a critical factor affecting coverage for vaccination programs internationally, attitudes and beliefs also play a role in uptake.Citation3
Acceptance is an ongoing challenge to HPV vaccination. Factors associated with parental acceptance of HPV vaccines and measures of uptake have been found to be associated with vaccine attitudes, Citation4,Citation5 and there is evidence showing that provider recommendation increases uptake.Citation6-Citation8 Studies that examine educational interventions designed to improve acceptance have not provided conclusive evidence of effectiveness.Citation9
The availability of online search engines and social media have provided faster access to a broader range of health information, including evidence-informed health communications. However, this broadening of information access has also meant broader access and exposure to misinformation and misinformed opinions.Citation10-Citation12 This may also affect HPV vaccination decision-making.Citation13 In Australia, reporting of the HPV vaccine in the media has varied, with positive messages and health promotion campaigns from health departments and researchers, as well as occasional negative media coverage typically describing concerns about safety.Citation14 However, Australians access health information from many places other than Australian news media, and it is not clear how much of what Australians see about HPV vaccines is related to safety concerns and conspiracies, or whether certain sub-populations or communities are disproportionately more often exposed to vaccine critical information.
Surveys have been used to sample vaccine attitudes and specific concerns relative to demographics or geography, including for HPV vaccines. Twitter, a social media platform, can be used to observe the types of information that people share and the opinions they express, and this approach has been used to characterise opinions about vaccination and a range of other public health issues.Citation15-Citation21 For population level studies that use Twitter to complement survey-based approaches to sampling attitudes, advantages are its size (from a population of 24.6 million Australians, there are 4 million monthly active users on Twitter), accessibility, and relatively low costs. The major disadvantages for population-level studies include substantial biases in representativeness, Citation22,Citation23 imperfect inference methods for accounting for geography and demographics, and the volume of flawed studies that may draw conclusions from counting tweets.Citation24-Citation29 Used properly, localised measures of what Twitter users post as tweets (as well as estimates of the information to which they may be exposed) could improve knowledge and attitudes about HPV vaccines by providing localised, real time information enabling better targeted health promotion and media messaging.
In our previous work on the representation of HPV vaccines on Twitter, we found that the opinions Twitter users express can be robustly predicted from who they follow; Citation30 that prior exposure to negative information about HPV vaccines is associated with later expression of negative opinions; Citation31 and that vaccine-critical Twitter users in Canada, the United Kingdom, and Australia tend to be better connected than vaccine-positive users.Citation32 In these studies, vaccine-critical tweets were identified using a supervised machine learning method that takes a manually-labelled sample and learns how best to classify subsequent tweets. In what follows, vaccine-critical is defined as being the expression of negative or opposing views about HPV vaccination. Our research has also shown that specific topics about HPV vaccines cluster within communities creating an uneven distribution in exposure to vaccine critical information, Citation33 and that measures of topic exposure were correlated with differences in state-level HPV vaccine coverage in the United States.Citation34 These studies used an unsupervised machine learning method called topic modelling to find natural clusters in the words and phrases; and evaluated the topics by manually checking whether a human would make the same choices as a machine when separating groups of tweets.
In this study, our aim was to examine exposure to HPV vaccine related topics among Australian Twitter users to examine associations with HPV vaccine coverage. To derive measures of potential information exposure among Australian Twitter users, we used a machine learning method to classify all known tweets related to HPV vaccines into topics and described groups of similar topics within 6 themes. We then identified any Australian Twitter users who may have seen those tweets by inferring location from their user profile information, aggregated those data into a set of 25 Australian regions, and constructed multivariable regression models examining how differences in exposure to certain themes was correlated with differences in HPV vaccine coverage across those regions, comparing the results to baseline models constructed using information about levels of employment and education.
Results
We analysed potential exposure to 655,690 HPV vaccine related tweets (from 212,891 unique Twitter users) posted to Twitter between 6 September 2013 and 1 September 2017. Of the 218.2 million user accounts following one or more of the 212,891 users posting about HPV vaccination, the Nominatim gazetteer was used to infer the locations of 80.8 million. Among these users, we were able to resolve 6,113,647 to Australia but not at a level of granularity that would allow for mapping into a PHN-based region, and 1,626,276 were resolved to cities and regions in Australia that could be mapped into one of 25 regions used in the analysis.
From a total of 21.5 million potential exposures, individual regional area exposure counts varied from 6,849 (Western Queensland) to 7.34 million (Sydney). Across the set of 30 topics, the total number of unique Australian Twitter users exposed to each topic (see Appendix Table 1) varied from 125,673 (topic 25; vaccine-critical discussions of rights and freedoms) and 128,006 (topic 28; pharmaceutical industry conspiracy theories and harms), to 427,233 (topic 10; international stories of positive impact including from Australia) and 578,292 (topic 9; new research showing a reduction in HPV incidence in the United States). As an example, proportional exposure to topic 2 (individual stories of adverse events and harm, mostly from the United States) was highest in Nepean Blue Mountains (15.4%), Northern Queensland (4.65%), Gold Coast (4.36%), Perth South (4.25%), and Tasmania (4.01%).
The modelling analysis showed that Twitter-derived proportional topic exposure measures were correlated with differences in 2016 HPV vaccine coverage across the 25 regions in Australia (). The topic exposure models produced consistent results for vaccination coverage in female adolescents (Pearson’s R = 0.75; 95% CI 0.49 to 0.88, using 7 of 31 topics as factors) and male adolescents (R = 0.76; 95% CI 0.51 to 0.89, using 9 of 31 topics as factors). Estimates of HPV vaccine coverage from models constructed using the topic exposure measures produced stronger correlations with observed HPV vaccine coverage than the estimates of coverage from models constructed using only socioeconomic factors for both female adolescents (R = 0.39; 95% CI −0.02 to 0.68, using 3 of 4 factors) and male adolescents (R = 0.36; 95% CI −0.04 to 0.66, using 3 of 4 factors).
Table 1. Models of HPV vaccination coverage for 31 Twitter-derived topic exposure and 5 socioeconomic factors in 25 combined Primary Health Network regions in Australia.
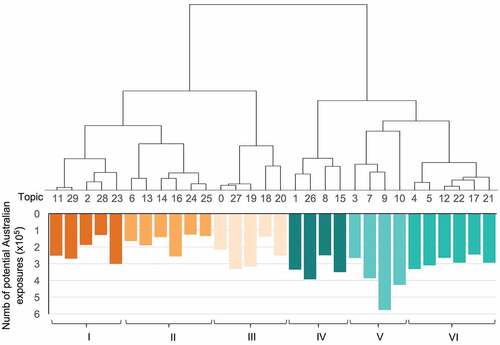
Using the intrusion tests to produce a hierarchical decomposition of the topics based on their semantic similarity, we identified 6 themes, which we describe as Groups (). Through content analysis, we found that Groups I, II, and III comprised entirely negative or mostly negative topics, and Groups IV, V, and VI comprised entirely positive or mostly positive topics ().
Table 2. Topics group descriptions and total potential exposure counts.
Figure 1. The hierarchical structure of topics determined from the set of intrusion tests performed over the 30 topics (Appendix 1), and included in one of 6 groups (). Exposure counts represent the total number of unique Australian Twitter users (of those localised to one of the 25 geographical regions) who may have been exposed to tweets from that topic. Orange groups tend to include mostly negative topics and cyan groups tend to include mostly positive topics. Differences in colour were used to denote groups across figures.
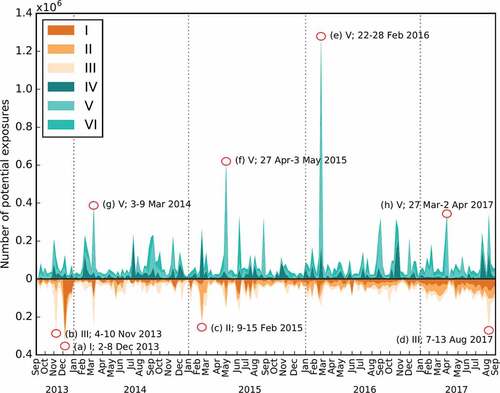
Exposure to the individual topics and Groups varied over time and region, exhibiting the typical burst-like patterns associated with issues that receive intermittent news media coverage (). Most stories associated with the largest peaks in potential exposure related to news media events including the release of new data and research about the impact that HPV vaccines are expected to have on cervical cancer in Australia and elsewhere, or debates about the representation and amplification of vocal vaccine critics in the news media.
Figure 2. Potential exposures among Australian Twitter users per week in the period 6 September 2013 to 1 September 2017. Peaks correspond to (a) Australian research showing cervical cancer risk was reduced; (b) Canadian and Australian research showing cervical cancer risk was reduced; (c) Reduction in cervical cancer risk in the United States; (d) discussions of coverage rates in Australia and reduction in risk in New Zealand; (e) research showing that one dose may be enough; (f) debates about the representation of HPV vaccines on a television show hosted by Katie Couric; (g) responses to the reversal of a false balance story written in the Toronto Star newspaper; and (h) videos and stories of adverse events and harm.
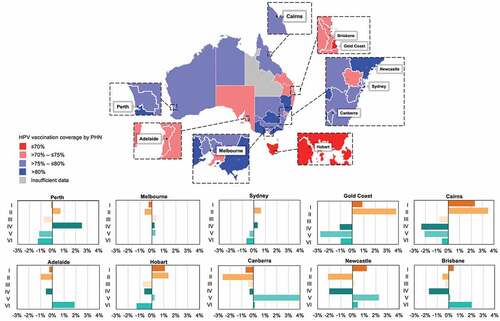
There were clear city-level differences in information exposure (). While we found that Twitter users in cities located in Primary Health Networks (PHNs) with lower vaccination rates tended to also have higher proportional exposure to themes with vaccine critical topics, we also noted specific nuanced differences. For example, the Gold Coast and Hobart were both characterised by disproportionate levels of exposure to each of the themes comprising mostly negative topics and both were in PHNs with lower HPV vaccine coverage rates. However, cities like Newcastle had less consistent patterns of exposure, including higher proportional exposure to health promotion topics, lower proportion exposure to research stories presented in mainstream news media, higher proportional exposure to pharmaceutical industry and political conspiracies, and lower proportional exposure to misrepresentations of safety research. The results indicated nuanced differences in the representation of health promotion, safety concerns, research, and distrust of governments and industry across cities and regions in Australia; suggestive of strategies that could be used to localise health promotion strategies and communication training for health practitioners.
Figure 3. Examples of topic exposure within individual cities in Australia by topic group (I-VI, inset), where bars represent the city-level difference in proportional exposure to each of the 6 topic groups relative to proportional exposure for all Australian Twitter users. The map illustrates differences in HPV vaccine coverage (population-weighted 3 dose completion aggregated for female and male adolescents) across the 31 Primary Health Networks (PHNs).
Discussion
Population-level measures of information exposure derived from Twitter can be used to model regional differences in HPV vaccine coverage in Australia. The results indicated that models using topic exposure measures produced coverage estimates that were more closely correlated with observed coverage than models derived from employment and education data. Australian Twitter users often follow users posting international news and information about HPV vaccines, showing that what happens elsewhere in the world is an important part of the information diet of Australians. While news coverage of research, vaccine promotion, and other positive messaging make up most of the HPV vaccine related information Australian Twitter users are likely to see, misinformation and vaccine critical stories are more common in cities and regions with lower HPV vaccine coverage. Our findings suggest that Twitter-derived measures of information exposure are correlated with HPV vaccine coverage in Australia. However, the results do not indicate whether differences in information exposure predict or reflect differences in HPV vaccination behaviours.
The results are generally consistent with our previous research on HPV vaccines on Twitter.Citation31 Similar results were found when modelling state-level coverage in the United States, where Twitter-derived models outperformed models based on data from the US Census Bureau. In a comparison between the United Kingdom, Canada, and Australia, Twitter users who were critical of HPV vaccines were found to be better connected across countries compared to users who posted other HPV vaccine information.Citation32 The attention of Twitter users in the United States was more likely to be consumed by North American stories presented in the mass media.Citation34 While these media-based controversies were not as dominant in the information diets of Australian Twitter users, news media appears to play a key role in shaping what people may have seen. This suggests that mainstream media retain an agenda setting role in framing public discussions and that a substantial proportion of information exposure about HPV vaccination on Twitter is driven by mainstream media. In a study where community detection algorithms were used to identify communities of Twitter users, Citation33 certain topics were found to be more commonly shared in certain communities, and this is reflected in the regional heterogeneity of information exposure in Australia.
The methodological approach of this study matches closely with this previous work, Citation34 and both studies draw on methods used to examine county-level associations between what people post on Twitter and cardiovascular mortality.Citation35 While there are a range of other studies that have examined the representation of vaccines and vaccination on Twitter, and methods for undertaking surveillance on the platform for public health applications are improving, Citation36 we know of no other studies in vaccination that use the follower network to estimate information exposure of Twitter users by location. Results may differ through using other ways of sampling information exposure among Twitter users (such as a sentinel-based approach) and other approaches to characterising outcomes by location or community (such as community detection algorithms and the use of validated survey instruments). Similarly, alternatives to topic modelling might be considered for characterising information exposure among Twitter users, including measures of the quality and credibility of the webpages to which tweets link.
The results of this study may have implications for public health practice. Organisations that undertake campaigns to improve awareness, knowledge and attitudes related to HPV vaccination may rely on surveys for information about gaps in knowledge and specific concerns. Survey development, sampling, analysis and reporting can be resource-intensive and slow. When indications of increased concern arise, the results of such investigations may be provided long after a timely response is indicated. For these instances, measures of topic exposure may be rapid and reasonable indicators of prevailing attitudes within a city or region and our findings suggest they also have the potential to reflect behavioural indicators, in this case HPV vaccine uptake. Hence a surveillance system that monitors information exposure via social media may provide a complementary source of information for informing the design of campaigns and broader communication planning that is low-cost, provides localised information, and is effectively real-time. Note however that correlations between several years of topic exposure and HPV vaccine coverage in one year do not demonstrate that these measures are a robust indicator of local knowledge and attitudes, but they are suggestive.
There were several limitations to the study. Like most surveys undertaken to measure vaccine attitudes, observing users on Twitter does not produce a representative sample of a population.Citation22
Population-level measures of information exposure represent only the types of information to which Twitter users are exposed and only the information to which they are exposed on Twitter. In addition, only users that included reconcilable information about their location in their user profiles were included in the analyses, which may introduce further biases. While the measures we proposed and evaluated are demonstrably correlated with coverage, they are not a replacement for studies that couple media diaries and survey instruments for hesitancy and intent, which can reveal individual-level associations between information exposure and attitudes. Measures of potential information exposure were imperfect and relied on a snapshot of the follower lists of Twitter users who posted about HPV vaccination. Twitter users who were suspended, became private, or deleted their accounts were not included in the study but they may have had some influence on information exposure that was not measured. Not only may changes in the follower network and other interactions on Twitter modify information exposure for Australian Twitter users, but information exposure on Twitter may not be a good proxy for the information to which people are exposed outside of social media.
The results show that despite the potential for biases in this proxy measure of information exposure, estimates from Twitter-derived models exhibited stronger correlations than estimates from models derived from socioeconomic factors. Further, we did not include a measure of access to primary care in our models. In Australia, vaccines are largely delivered via school-based programmes or publicly-funded community health services so factors related to access to HPV vaccine are less likely to be associated with access to primary care. Finally, the analyses did not consider temporal changes in vaccine coverage in Australia nor coverage outcomes based on different numbers of doses.
Conclusion
Regional measures of potential exposure to HPV vaccine information derived from Twitter data are more closely correlated with HPV vaccine coverage than regional measures derived from publicly available data about employment and education in Australia. Despite the potential biases associated with using a non-representative sample of more than 1 million Australian Twitter users, topic exposure measures may be useful as real-time, localised estimates of the specific issues and concerns circulating within cities and regions in Australia and could be used to better target and prioritise public health communication activities.
Materials and methods
Study data
The Twitter Application Programming Interface (API) was used to search Twitter for tweets that include HPV vaccine related keywords since September 2013 and included combinations of keywords “cervical”, “cervarix”, “hpv”, “human papillomavirus”, “vaccine”, “vaccination”, and “gardasil”. Details of how the keywords were used to identify, capture, and store tweets are reported elsewhere.Citation30,Citation34 In this study, all HPV vaccine related tweets posted between 6 September 2013 and 1 September 2017 were included. After removing tweets from users who were subsequently suspended, became protected (private), or had their accounts deleted, the dataset included 655,690 HPV related tweets from 212,891 unique Twitter accounts. Information extracted from each tweet included the text of the message, lists of the websites linked in the tweet (URL), the timestamp of when the tweet was posted, and the user identifier. Retweets were collected in the same way.
Each time a new user posting about HPV vaccines was encountered, the Twitter API was used to collect a list of the user’s public followers. Because of limits on the use of this functionality in the Twitter API, these lists were retrieved once per user and there may have been a delay (hours to days) between the time the user posted their first tweet about HPV vaccines and when the complete follower list was collected. For each new unique follower, user profile information was collected, including a field designated for describing a user’s home location.
Nominatim, Citation37 a gazetteer, was used to extract location information from all followers of all users who posted at least once about HPV vaccines during the study period. Twitter users provide information about their home locations in their user profile as free text and this information needs to be interpreted to be able to map them into a consistent geographical framework. Nominatim takes text as input and returns a set of possible locations with a score related to its confidence about those locations. A local implementation of Nominatim was used to reconcile user profile information and identified the set of all followers located in Australia. Note that the study design does not include locating users who may not have been exposed to any HPV vaccine related tweets.
Australia uses multiple systems for segmenting the country into geographical regions. The 31 PHNs in Australia include between 62,030 (Western Queensland) and 1.61 million (North-Western Melbourne) Australians. Because Twitter users typically do not distinguish between different parts of the same city, PHNs for cities were combined to produce a total of 25 PHN-based regions. Australian Twitter users were assigned to exactly one of those regions and if their home location could not be resolved at that level, they were not included in the analyses.
The 25 regions were characterised by socioeconomic differences using public data reported for employment (2 factors: proportion with part time employment and full-time employment); and levels of education (2 factors: proportion who have completed high school or equivalent and Bachelor level higher education). The rationale for selecting these factors and excluding others such as access to primary healthcare services was based on evidence of variation in HPV vaccine coverage in Australia.Citation38,Citation39 Where PHNs were combined for analysis, the values for each of the factors were aggregated by weighting by population. While remoteness appears to be a factor associated with HPV vaccine coverage, this information is currently only reported as maps and not as population-weighted composite scores for PHNs in Australia, so it was not included as a factor in the models. The result was a set of 4 factors (2 for employment and 2 for education) characterising the socioeconomic differences across the 25 regions in Australia.
HPV vaccine coverage estimates were provided by the National HPV Register, which includes detailed information about the number of people in Australia who have received HPV vaccinations, including the number of doses and demographic data such as age, sex, and area of residence.Citation40 Registry data for 2016 were reported by the Australian Institute of Health and Welfare by PHN.Citation1,Citation41 The data are reported by the total number of adolescent male and female HPV vaccine recipients and the total number of adolescents residing in each PHN, so where PHNs were combined as regions for analysis with the data from Twitter, HPV vaccine coverage was aggregated by combining the number of recipients and populations.
Data analysis
Topic modelling is an unsupervised machine learning technique used to find natural clusters in the language of a large collection (a corpus) of documents. Our previous work using topic modelling for clustering HPV vaccine tweets found that the Dirichlet Multinomial Mixture (DMM) modelCitation42 configured to generate 30 topics produced a useful set of topics.Citation33 Topic modelling is applied by specifying in advance the number of topics that should be used to represent the set of documents but does not require the pre-specification of the nature of the topics, as would be typical of a supervised machine learning approach aiming to label tweets according to a predefined set of themes, such as Health Belief Model constructs.Citation32 We selected 30 topics based on a previous analysis of the clustering of topics within online communities, where we found that 30 exhibited the strongest levels of topic clustering.Citation33
Because topics are not specified in advance and topic modelling is not a supervised machine learning method, there is no way to objectively measure whether the topics represented within a tweet are consistent with the topics represented in other tweets assigned to the same cluster. To evaluate the quality of the topic modelling and to group similar topics, we undertook a series of intrusion tests. In the intrusion tests an investigator, blinded to the topic labels, is presented with a set of at least three tweets randomly sampled from one topic and an extra tweet randomly sampled from another topic. For each test, the task is to identify the tweet that does not belong. Repeating these tests several times for each combination of topics reveals the dissimilarity of the tweets in the set of topics. The results of the intrusion tests were first used to check that the resulting topics were a reasonable characterisation of the types of tweets observed in the study period. The measures of semantic dissimilarity produced by the intrusion tests can then be used with multidimensional scaling to construct a hierarchy of topics where similar topics are closer to each other in the hierarchy.Citation43 The hierarchy produced in this manner can then be used to group topics according to a set of themes.
Differences in potential exposure to each of these topics by region were constructed by labelling each tweet with a topic, in turn labelling the set of 21.5 million potential exposures by the topic of the tweet, and by allocating topic exposure counts to Australian Twitter users who may have been exposed to the tweet because they followed the user who posted it. Exposures were then aggregating by assigning Australian Twitter users to one of the 25 PHN-based regions wherever possible, which produced a measure of proportional topic exposure. This resulted in a set of 31 potential factors (one for each topic plus an additional set of tweets with fewer than 3 words that were not assigned a topic label) that were used as factors in models of HPV vaccine coverage for both male and female adolescents.
Using the set of 5 socioeconomic factors and the 31 topic exposure factors, the aim was to produce parsimonious models of HPV vaccine coverage in the 25 regions. The approach was to use elastic net regression with 5-fold cross validation.Citation34 Because of the small number of regions used to represent Australia, the elastic net regression method is used to robustly select the most useful factors. The elastic net regression method is designed specifically to overcome challenges of fitting models in which there are a large number of factors and a small number of samples, and seeks to limit the number of factors used in the model (the number of non-zero coefficients) while also minimising the size of the coefficients. Cross-validation is used to find the best model while avoiding over-fitting – in each validation step, a model is trained on 20 of the regions and tested for performance in the remining 5. Models were produced for both male and female coverage in 2016 (three doses); reporting the correlation between the observed and predicted values (Pearson’s R), and the coefficient of determination (r2).
The Macquarie University Human Research Ethics committee approved the study. Statistical analyses were undertaken in Matlab, and the data collection, topic modelling, Nominatim interface, and visualisations used the Python programming language.
Disclosure of potential conflicts of interest
No potential conflicts of interest were disclosed.
Supplemental Material
Download MS Word (25.3 KB)Supplementary material
Supplemental data for this article can be accessed on the publisher’s website.
Additional information
Funding
References
- Australian Institute of Health and Welfare. Web update: HPV immunisation rates 2015–16 released 2018 March 22. [accessed 2019 Feb 1] https://myhealthycommunities.gov.au/our-reports/HPV-rates/march-2018.
- Brotherton JML, Fridman M, May CL, Chappell G, Saville AM, Gertig DM. Early effect of the HPV vaccination programme on cervical abnormalities in Victoria, Australia: an ecological study. The Lancet. 2011;377(9783):2085–92. doi:10.1016/S0140-6736(11)60551-5.
- Omer SB, Salmon DA, Orenstein WA, deHart MP, Halsey N. Vaccine refusal, mandatory immunization, and the risks of vaccine-preventable diseases. N Engl J Med. 2009;360(19):1981–88. doi:10.1056/NEJMsa0806477.
- Dempsey AF, Zimet GD, Davis RL, Koutsky L. Factors that are associated with parental acceptance of human papillomavirus vaccines: a randomized intervention study of written information about HPV. Pediatrics. 2006;117(5):1486–93. doi:10.1542/peds.2005-1381.
- Rosenthal SL, Rupp R, Zimet GD, Meza HM, Loza ML, Short MB, Succop PA. Uptake of HPV vaccine: demographics, sexual history and values, parenting style, and vaccine attitudes. J Adolesc Health. 2008;43(3):239–45. doi:10.1016/j.jadohealth.2008.06.009.
- Kester LM, Zimet GD, Fortenberry JD, Kahn JA, Shew ML. A national study of HPV vaccination of adolescent girls: rates, predictors, and reasons for non-vaccination. Matern Child Health J. 2013;17(5):879–85. doi:10.1007/s10995-012-1066-z.
- Rosenthal SL, Weiss TW, Zimet GD, Ma L, Good MB, Vichnin MD. Predictors of HPV vaccine uptake among women aged 19–26: importance of a physician’s recommendation. Vaccine. 2011;29(5):890–95. doi:10.1016/j.vaccine.2009.12.063.
- Zimet GD. Improving adolescent health: focus on HPV vaccine acceptance. J Adolesc Health. 2005;37(6 Suppl):S17–23. doi:10.1016/j.jadohealth.2005.09.010.
- Fu LY, Bonhomme LA, Cooper SC, Joseph JG, Zimet GD. Educational interventions to increase HPV vaccination acceptance: a systematic review. Vaccine. 2014;32(17):1901–20. doi:10.1016/j.vaccine.2014.01.091.
- Del Vicario M, Bessi A, Zollo F, Petroni F, Scala A, Caldarelli G, Stanley HE, Quattrociocchi W. The spreading of misinformation online. Proc Natl Acad Sci USA. 2016;113(3):554. doi:10.1073/pnas.1517441113.
- Larson HJ. The biggest pandemic risk? Viral misinformation. Nature. 2018;562:309. doi:10.1038/s41586-018-0369-7.
- Vosoughi S, Roy D, Aral S. The spread of true and false news online. Science. 2018;359(6380):1146. doi:10.1126/science.aap9559.
- Zimet GD, Rosberger Z, Fisher WA, Perez S, Stupiansky NW. Beliefs, behaviors and HPV vaccine: correcting the myths and the misinformation. Preventive Medicine. 2013;57(5):414–18. doi:10.1016/j.ypmed.2013.05.013.
- Robbins SC, Pang C, Leask J. Australian newspaper coverage of human papillomavirus vaccination, October 2006-December 2009. J Health Commun. 2012;17(2):149–59. doi:10.1080/10810730.2011.585700.
- Betsch C, Brewer NT, Brocard P, Davies P, Gaissmaier W, Haase N, Leask J, Renkewitz F, Renner B, Reyna VF, et al. Opportunities and challenges of web 2.0 for vaccination decisions. Vaccine. 2012;30(25):3727–33. doi:10.1016/j.vaccine.2012.02.025.
- Broniatowski DA, Paul MJ, Dredze M. National and local influenza surveillance through Twitter: an analysis of the 2012–2013 influenza epidemic. PLoS One. 2013;8(12):e83672. doi:10.1371/journal.pone.0083672.
- Chew C, Eysenbach G. Pandemics in the age of Twitter: content analysis of Tweets during the 2009 H1N1 outbreak. PLoS One. 2010;5(11):e14118. doi:10.1371/journal.pone.0014118.
- Dredze M. How social media will change public health. IEEE Intell Syst. 2012;27(4):81–84. doi:10.1109/MIS.2012.76.
- Hawn C. Take two aspirin and tweet me in the morning: how Twitter, Facebook, and other social media are reshaping health care. Health Affairs (Project Hope). 2009;28(2):361–68. doi:10.1377/hlthaff.28.2.361.
- Salathe M, Bengtsson L, Bodnar TJ, Brewer DD, Brownstein JS, Buckee C, Campbell EM, Cattuto C, Khandelwal S, Mabry PL, et al. Digital epidemiology. PLoS Comput Biol. 2012;8(7):e1002616. doi:10.1371/journal.pcbi.1002616.
- Salathe M, Khandelwal S. Assessing vaccination sentiments with online social media: implications for infectious disease dynamics and control. PLoS Comput Biol. 2011;7(10):e1002199. doi:10.1371/journal.pcbi.1002244.
- Mislove A, Lehmann S, Ahn YY, Onnela JP, Rosenquist JN. Understanding the demographics of Twitter users. Proceedings of the Fifth International AAAI Conference on Weblogs and Social Media; 2011; Association for the Advancement of Artificial Intelligence, Barcelona, Spain.
- Sloan L, Morgan J. Who Tweets with their location? Understanding the relationship between demographic characteristics and the use of geoservices and geotagging on Twitter. PLoS One. 2015;10(11):e0142209. doi:10.1371/journal.pone.0142209.
- Ajao O, Hong J, Liu W. A survey of location inference techniques on Twitter. J Inf Sci. 2015;41(6):855–64. doi:10.1177/0165551515602847.
- Compton R, Jurgens D, Allen D. Geotagging one hundred million Twitter accounts with total variation minimization. 2014 IEEE International Conference on Big Data (Big Data), Washington D.C., United States doi:10.1109/BigData.2014.7004256.
- Dunn AG, Mandl KD, Coiera E. Social media interventions for precision public health: promises and risks. NPJ Digit Med. 2018;1(1):47. doi:10.1038/s41746-018-0054-0.
- Jurgens D, Finethy T, McCorriston J, Xu YT, Ruths D. Geolocation prediction in Twitter using social networks: a critical analysis and review of current practice. ICWSM. 2015;15:188–97.
- Kim Y, Huang J, Emery S. Garbage in, garbage out: data collection, quality assessment and reporting standards for social media data use in health research, infodemiology and digital disease detection. J Med Internet Res. 2016;18(2):e41. doi:10.2196/jmir.4738.
- Rahimi A, Cohn T, Baldwin T. Twitter user geolocation using a unified text and network prediction model. Proceedings of the 53rd Annual Meeting of the Association for Computational Linguistics and the 7th International Joint Conference on Natural Language Processing, Beijing, China 2015;(Volume 2: Short Papers) (Vol. 2, pp. 630–36).
- Zhou X, Coiera E, Tsafnat G, Arachi D, Ong MS, Dunn AG. Using social connection information to improve opinion mining: identifying negative sentiment about HPV vaccines on Twitter. Stud Health Technol Inform. 2015;216:761–65.
- Dunn AG, Leask J, Zhou X, Mandl KD, Coiera E. Associations between exposure to and expression of negative opinions about human papillomavirus vaccines on social media: an observational study. J Med Internet Res. 2015;17(6):e144. doi:10.2196/jmir.4343.
- Shapiro GK, Surian D, Dunn AG, Perry R, Kelaher M. Comparing human papillomavirus vaccine concerns on Twitter: a cross-sectional study of users in Australia, Canada and the UK. BMJ open. 2017;7(10):e016869. doi:10.1136/bmjopen-2017-016869.
- Surian D, Nguyen DQ, Kennedy G, Johnson M, Coiera E, Dunn AG. Characterizing Twitter discussions about HPV vaccines using topic modeling and community detection. J Med Internet Res. 2016;18(8):e232. doi:10.2196/jmir.6045.
- Dunn AG, Surian D, Leask J, Dey A, Mandl KD, Coiera E. Mapping information exposure on social media to explain differences in HPV vaccine coverage in the United States. Vaccine. 2017;35(23):3033–40. doi:10.1016/j.vaccine.2017.04.060.
- Eichstaedt JC, Schwartz HA, Kern ML, Park G, Labarthe DR, Merchant RM, Jha S, Agrawal M, Dziurzynski LA, Sap M, et al. Psychological language on Twitter predicts county-level heart disease mortality. Psychol Sci. 2015;26(2):159–69. doi:10.1177/0956797614557867.
- Colditz JB, Chu K-H, Emery SL, Larkin CR, James AE, Welling J, Primack BA. Toward real-time infoveillance of Twitter health messages. Am J Public Health. 2018;108(8):1009–14. doi:10.2105/AJPH.2018.304497.
- Nominatim. 2018. [accessed 2019 Feb 1] https://nominatim.openstreetmap.org/.
- Barbaro B, Brotherton JM. Assessing HPV vaccine coverage in Australia by geography and socioeconomic status: are we protecting those most at risk? Aust N Z J Public Health. 2014;38(5):419–23. doi:10.1111/1753-6405.12218.
- Mak DB, Bulsara MK, Wrate MJ, Carcione D, Chantry M, Efller PV. Factors determining vaccine uptake in Western Australian adolescents. J Paediatr Child Health. 2013;49(11):895–900. doi:10.1111/jpc.12030.
- Australian Government Department of Health. National HPV vaccination program register. 2018. [accessed 2019 Feb 1] http://www.hpvregister.org.au/.
- Australian Government Department of Health. Primary health networks: population health data. 2018. [accessed 2019 Feb 1] http://www.health.gov.au/internet/main/publishing.nsf/Content/PHN-Population-Health-Data.
- Yin J, Wang J. A dirichlet multinomial mixture model-based approach for short text clustering. Proceedings of the 20th ACM International Conference on Knowledge Discovery and Data Mining (SIGKDD), New York; 2014. pp. 233–42.
- Borg I, Groenen PJF. Modern multidimensional scaling: theory and applications (2nd Ed.). J Stat Softw. 2005;14. ISBN 978-0-387-28981-6