
 ?Mathematical formulae have been encoded as MathML and are displayed in this HTML version using MathJax in order to improve their display. Uncheck the box to turn MathJax off. This feature requires Javascript. Click on a formula to zoom.
ABSTRACT
The hepatitis B (HB) vaccine effectively prevents the incidence of hepatitis B virus (HBV) infection. However, vaccine failure occurs in 5–10% of the recipients. The precise mechanisms leading to responsiveness to the HB vaccine are poorly understood. High-throughput sequencing (HTS) may help clarify the immune response to the HB vaccine, so we applied this method to investigate whether the HB vaccine induced a specific change in the T-cell receptor (TCR) and B-cell receptor (BCR) repertoires. We conducted HTS of the TCR β chain and BCR IgG heavy (H) chain complementary determining region 3 (CDR3) repertoires in five volunteers before and after the second and third immunizations with the HB vaccine. The HB surface antibody (HBsAb) levels were >10 mIU/ml after the third vaccination in all five participants. The TCR β chain CDR3 repertoire diversity significantly increased, while the BCR IgG H chain CDR3 repertoire diversity significantly decreased after the second vaccination. Although there was no marked inter-individual variation in terms of the numbers of unique reads, it is possible that the TCR β chain and BCR IgG H chain CDR3 repertoires may have changed within the same numbers of unique reads. Our data failed to identify the specific dominant clones that responded to the HB vaccine. In summary, the TCR β chain CDR3 repertoire diversity significantly increased, while the BCR IgG H chain CDR3 repertoire diversity significantly decreased, after the second HB vaccination. These diversity changes might be associated with a better response to the HB vaccine.
Introduction
Hepatitis B virus (HBV) infection, which can lead to chronic hepatitis, liver cirrhosis, and hepatocellular carcinoma, is a global public health problem. According to the 2017 Global Hepatitis Report, an estimated 257 million people worldwide are infected with HBV;Citation1 additionally, an estimated approximately 1 million people were believed to be HBV carriers in Japan in 2011.Citation2 The hepatitis B (HB) vaccine is generally effective at preventing HBV infection. Vaccination delivered in a three-dose series at zero, one, and six months induces long-term protection in most recipients.Citation3,Citation4 Following vaccination, antigen-presenting cells (APCs) capture fragments from the vaccine that are then hydrolyzed. Major histocompatibility complex class II (MHC-II) secreted at the surface of APCs interacts with CD4+ T cells through the T-cell receptor (TCR), activating these cells, which then transform into T helper 2 (Th2) cells. B cells can directly recognize HB surface antigen (HBsAg) through the B-cell receptor (BCR). Once activated by T cells, these B cells subsequently differentiate into plasma cells that secrete protective anti-HBsAg antibody (HBsAb). Additionally, sequential class-switch recombination can occur not only with exposure to a single antigen but also with consecutive antigen exposure. In this manner, B cells switch from producing IgM to producing IgG. Effective vaccination generates long-lived memory immunity capable of recognizing and rapidly responding to infection.Citation5
Unfortunately, vaccine failure occurs in 5‒10% of the recipients, who are unable to produce a protective level of antibodies against HBsAg after a standard vaccine course.Citation6 While the precise mechanisms leading to non-responsiveness to the HB vaccine are not yet clearly understood, an interplay among many elements, including the HBsAg and host factors, likely influences vaccine failure. Age, gender, and genetic factors are all important in the production of vaccine-generated immunity.Citation7,Citation8 Several studies investigating the correlation between the immune response to the HB vaccine and human leukocyte antigen (HLA) polymorphisms, immunoregulatory cytokine genes, cytokine receptor genes, toll-like receptors, and microRNA polymorphisms have been reported.Citation9-Citation18 There has been a distinct focus on the association between HLA alleles and responsiveness to HB vaccination. However, few reports have described the relationship between responsiveness to the HB vaccine and the TCR and BCR repertoires.
The TCR and BCR genes are comprised of variable (V), diversity (D), joining (J), and constant (C) gene segments. The short region (about 45 bp) that spans the VD and VJ junction is known as complementary determining region 3 (CDR3). This region has the most variety, and it directly contacts the peptide‒MHC complexes on the surface of antigen-presenting cells. Each TCR and BCR was produced via the rearrangement of many gene sequences. More than 90% of T cells are αβT cells, with the remaining 10% being γδT cells. The antigen specificity of each TCR is largely determined by the CDR3 of the receptor β chain. The theoretical diversity of the TCR β chain amino acid sequence in humans is estimated to be 1014 Furthermore, the human B-cell immunoglobulin repertoire can theoretically include up to 1011 unique BCR variants.Citation19-Citation23 In recent years, high-throughput next-generation sequencing (NGS) has been applied to vaccine studies.Citation24-Citation27 NGS is a powerful tool, and a huge amount of data that have been used to analyze the TCR and BCR were acquired through NGS. High-throughput sequencing (HTS) may help clarify the immune response to the HB vaccine. It is presumed that the HB vaccine induces HBsAg-specific T cells and B cells, and that, concomitantly, the TCR β and BCR IgG H chain CDR3 repertoires change significantly in response to antigenic stimuli.
In this study, we investigated whether the HB vaccine induced specific changes in the TCR and BCR repertoires because this information may be useful in clarifying the mechanisms that underlie responsiveness to the HB vaccine.
Results
Demographical and clinical characteristics
All five healthy subjects (5 males, mean age: 23.4 years) remained healthy for the duration of the study and were able to participate in the full study. The demographical and clinical characteristics of these subjects are summarized in . The findings for HLA-DPB1, HLA-DQB1, and HLA-DRB1 as well as for HBsAg, antibodies against HB core antigen (HBcAb), and HBsAb levels before and after immunization with the recombinant HB vaccine are shown. Regarding HLA-DPB1, HLA-DQB1, and HLA-DRB1, part of the HLA-DQB1 site was identical among participants, whereas most of the HLA-DRB1 and HLA-DPB1 sites were different. All participants had negative results from the initial screening of HBV markers (i.e., negative findings for HBsAg, HBcAb, and HBsAb before immunization with the recombinant HB vaccine). The HBsAb levels were increased after the second HB vaccination, although they remained at <10 mIU/ml. However, the HBsAb levels in all five participants eventually exceeded 10 mIU/ml after the third HB immunization. We noted no relationship between the immune response to the HB vaccine and the HLA type II variant, as all five participants obtained protective levels of HBsAb after the third immunization with recombinant HB vaccine despite their HLA differences.
Table 1. Demographic and clinical characteristics.a
Features of the sequence data
In the present study, the mean number of analyzed sequences identified in the TCR β chain repertoire was 153,151 (range: 132,935–172,649) before HB vaccination, 180,093 (range: 166,077–194,238) after the second HB vaccination, and 129,044 (range: 98,872–142,279) after the third HB vaccination. Additionally, the mean number of sequences analyzed for the BCR IgG heavy (H) chain repertoires was 106,664 (range: 87,402–120,630) before HB vaccination, 126,237 (range: 87,674–169,030) after the second HB vaccination, and 135,663 (range: 113,956–147,101) after the third HB vaccination. The percentage of assigned sequences in the TCR β and BCR IgG H chains ranged from 94.1% to 96.7% and from 97.6% to 98.4%, respectively. The number of unique sequences in the TCR β chain repertoire before HB vaccination, after the second HB vaccination, and after the third HB vaccination were 6,249–11,184, 10,004–11,805, and 6,953–11,874, respectively. Similarly, the number of unique sequences in the BCR IgG H chain repertoire before HB vaccination, after the second HB vaccination, and after the third HB vaccination were 13,1172–6,628, 5,5071–9,841, and 12,680–23,004, respectively.
Supplementary Table 1 shows the features of the sequence data, including the values for each of the following: total (all reads obtained by NGS; one per clone), analyzed, in-frame (reads expressing a functional TCR or BCR protein), assigned (reads determined as TCR or BCR genes), unique (distinct assigned sequence reads), and out-of-frame (reads expressing a non-functional TCR or BCR protein) sequences in the five healthy volunteers before and after HB immunization.
Diversity of the TCR β and BCR IgG H chain repertoires
To determine the diversity of the TCR and BCR repertoires, we calculated the Shannon–Weaver index (). The mean Shannon–Weaver index of the TCR β chain repertoire was 6.90 (range: 6.41–7.37) before HB immunization, 7.61 (range: 7.43–7.95) after the second HB immunization, and 7.34 (range: 7.01–8.09) after the third HB immunization. There were significant differences (p= 0.0072) in the Shannon–Weaver index of the TCR β chain repertoires before and after the second HB immunization. The mean Shannon–Weaver index of the TCR β chain repertoire after the third HB vaccination trended lower than that after the second HB vaccination. However, no significant difference was noted between the Shannon–Weaver indices before HB vaccination and after the third HB vaccination. This result indicates that the immune diversity for the TCR β chain became wider after the second HB vaccination compared with the TCR β chain immune diversity before vaccination.
Figure 1. Diversity index.
(a–b) The diversity indices of the TCR β (a) and BCR IgG H (b) chains sorted from PBMCs from five pre-HB-vaccinated and post-HB-vaccinated healthy volunteers. Blue closed circles indicate data from before HB immunization (Before); Red closed circles indicate data from after the second HB immunization (After 2nd); and green closed circles indicate data from after the third HB immunization (After 3rd).
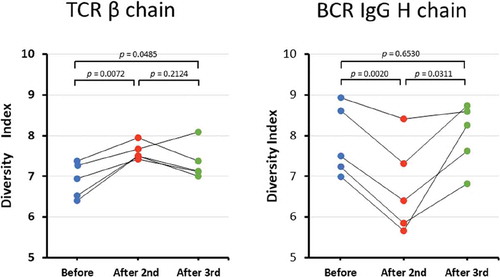
Next, we examined whether the diversity in the BCR IgG H chain repertoire was different before and after HB vaccination. The mean Shannon–Weaver index of BCR IgG H chain repertoire was 7.86 (range: 7.00–8.94) before HB immunization, 6.73 (range: 5.66–8.41) after the second HB immunization, and 8.01 (range: 6.82–8.74) after the third HB immunization. The mean Shannon–Weaver index of the BCR IgG H chain repertoire significantly decreased after the second HB vaccination compared with before vaccination (p= 0.0020), but then it significantly increased after the third HB vaccination compared with the mean Shannon–Weaver index after the second HB vaccination (p = 0.0311). This finding indicates that the immune diversity for the BCR IgG H chain after the second HB vaccination became narrower than that before HB vaccination; however, the third HB vaccination restored the immune diversity for the BCR IgG H chain to the baseline level.
Percentages of the unique TCR β chain and BCR IgG H chain reads
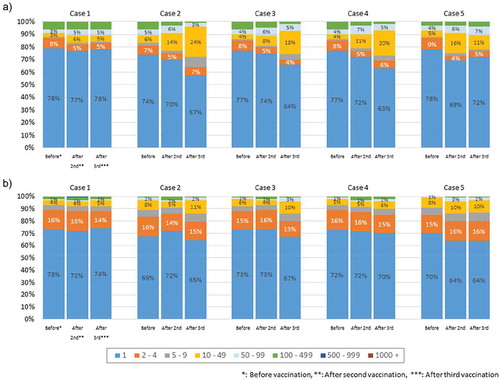
The pie charts in show the distribution of the numbers of unique TRC β chain and BCR IgG H chain reads. For both the TCR β and BCR IgG chains, >50% of the reads were a unique sequence with only one read. The numbers of unique TCR β and BCR IgG chain reads did not differ significantly within the same individuals among the three time points (before HB vaccination, after the second HB vaccination, and after the third HB vaccination). There was no marked inter-individual variation in terms of the numbers of unique reads; however, it is possible that the TCR β chain and BCR IgG H chain CDR3 repertoires may have changed while maintaining the same numbers of unique reads.
Figure 2. Distribution of the numbers of unique TCR β and BCR IgG H chain reads.
(a–b) The pie charts (copy number/unique) show the distribution of the numbers of unique TCR β (a) and BCR IgG H (b) chain reads. For both the TCR β and BCR IgG chains, >50% of the reads were a unique sequence with only one read.
Three-dimensional (3D) images of the TCR β chain and BCR IgG H chain repertoires
3D images are particularly useful for TCR β and BCR IgG H chain repertoire studies because the dominance of certain combinations of TRBV with TRBJ genes and of IGHV with IGHJ genes as well as the extent of TCR or BCR diversity can easily be observed. Therefore, we produced 3D images of the TCR β and BCR IgG H chain repertoires to visualize the usage of TCR bearing a combination of TRBV with TRBJ genes and of BCR bearing a combination of IGHV with IGHJ genes ().
Figure 3. Three-dimensional images of TCR β and BCR IgG H chain repertoires.
(a) TRB V-J repertoire 3D graph: Results from NGS of the T-cell repertoire identifying the CDR3 amino acid sequences and expression levels of TRBV and TRBJ region genes. The x-, y-, and z-axes indicate the TRBV, TRBJ, and frequency percentage, respectively. (b) IGH V-J repertoire 3D graph: The numbers of BCR IgG H chain sequence reads bearing a given gene recombination of IGHV with IGHJ were counted. The x-, y-, and z-axes indicate the IGHV, IGHJ, and frequency percentage, respectively.
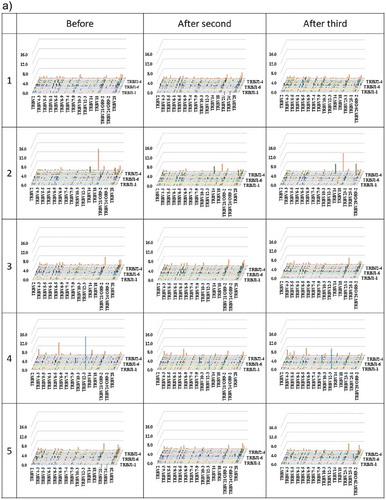
Figure 3. (Continued)
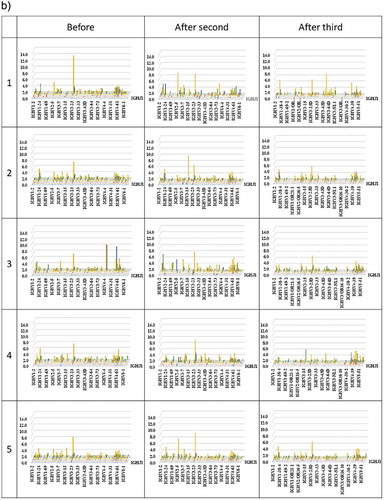
The frequency of combinations of TRBV with TRBJ genes differed among the five healthy individuals as well as among the three time points. Similarly, the frequency of combinations of IGHV with IGHJ genes also differed among the five healthy individuals as well as among the three time points. Specific changes were not observed.
Overlapping (common) sequences in the TCR β and BCR IgG H chain repertoires before and after HB vaccination
We analyzed the TCR β and BCR IgG H chain CDR3 gene segments to identify the epitopes that were amplified in response to the HB vaccine. First, we examined the robust regions in the TCR β chain CDR3 and the BCR IgG H chain CDR3. shows the common sequences in the TCR β chain CDR3 and BCR IgG H chain CDR3 repertoires before and after HB vaccination.
Table 2. The amount and frequency of sequences that overlapa in the TCR β and BCR IgG H chain repertoires.
The overlapping proportions of the TCR β chain CDR3 repertoires ranged from 0.69% to 3.36% between before and after the second HB vaccination, from 0.42% to 4.72% between before and after the third HB vaccination, and from 0.71% to 3.99% between after the second and after the third HB vaccination. The overlapping proportions of the BCR IgG H chain CDR3 repertoires ranged from 0.21% to 1.94% between before and after the second HB vaccination, from 0.10% to 2.25% between before and after the third HB vaccination, and from 0.08% to 1.81% between after the second and after the third HB vaccination. Overall, the overlapping proportions of the TCR β chain and BCR IgG H chain CDR3 repertoires were low.
The top three ranked unique TCR β and BCR IgG H chain reads
The top three most-enriched clones of unique TCR β and BCR IgG H chains before HB vaccination, after the second HB vaccination, and after the third HB vaccination are shown in . Tracking the top three TCR β chain VJ and CDR3 clones revealed that three out of five participants shared the same TCR β chain VJ and CDR3 clones among their top three most-enriched clones. Additionally, the top three most-enriched BCR IgG H chain VJ and CDR3 clones showed the largest differences in frequencies among the three time points.
Table 3. Characteristics of high-frequency CDR3 sequences before and after HB immunization.
We extracted the clones from after the second HB vaccination that had increased in comparison with their levels before immunization with the HB vaccine and did not disappear after the third HB vaccination (). We also investigated the immune response to the HB vaccine among all five individuals. However, no common clone was found among the five individuals in this study.
Table 4. Characteristics of increasing sequences after immunization.
Discussion
An analysis of the TCR and BCR repertoires in the blood may provide important information about responsiveness to the HB vaccine. In this study, we explored the TCR β and BCR IgG H chain repertoires in peripheral blood before and after HB vaccination to investigate the mechanisms underlying the responsiveness to HB vaccine.
Notably, after the second HB vaccination, the TCR β chain CDR3 repertoire diversity significantly increased, while the BCR IgG H chain CDR3 repertoire diversity significantly decreased. The mechanism underlying the increase in the TCR β chain CDR3 repertoire diversity after the second HB vaccination remains unclear at present, but we speculate that interaction among T cells or collaboration between T cells and B cells played a role. To clarify this, future work will need to separate sub-populations of T cells, such as CD8+, CD4+CD25−, and CD4+CD25+Foxp3+ T cells, and then perform a detailed analysis. The decreased BCR IgG H chain CDR3 repertoire diversity after the second HB vaccination suggests that the HB vaccine induces HBsAg-specific B cells and that HBsAb is simultaneously produced and prepared for secretion after the second HB vaccination. A third HB vaccination is needed for acquisition of HBsAb (i.e., the object of the third vaccination is to obtain additional immunity via a booster effect). Indeed, HBsAb levels were <10 mIU/ml after the second HB vaccination, but they exceeded 10 mIU/ml after the third immunization with the HB vaccine in all five participants. As for the return to baseline levels of the BCR IgG H chain repertoire diversity after the third HB vaccination, this could be explained by suppression of follicular helper T cells by regulatory T cells leading to a suppression of B cells that specifically produce HBsAb. Alternatively, memory B cells may have been formed.
3D images are particularly useful for repertoire studies, as the dominance of certain combinations of TRBV or IGHV with TRBJ or IGHJ genes, respectively, as well as the extent of TCR or BCR diversity, can be observed easily. In the present study, no identical or dominant combinations of TRBV or IGHV with TRBJ or IGHJ, respectively, were observed among any of the five participants. However, this might be a function of our small sample size; additional studies with more participants should be conducted to investigate this issue further.
Subsequently, we analyzed the TCR β CDR3 gene segments to identify the epitopes that expanded in response to the HB vaccine. In agreement with Long’s work,Citation28 we found a low proportion of overlapping TCR β chain CDR3 and BCR IgG H chain CDR3 sequences after HB vaccination, suggesting that most of the TCR β chain CDR3 and BCR IgG H chain CDR3 sequences had changed. Specifically, we found that the TCR CDR3 gene segments detected following administration of the HB vaccine consisted of a few unique dominant clones and other less-dominant clones. However, we were unable to confirm the specific dominant clones after HB vaccination. All five participants in the present study achieved protective levels of HBsAb (>10 mIU/ml) after the third immunization with the HB vaccine; none showed single or unique high-frequency CDR3 sequences of the BCR IgG H chain after HB immunization, whereas multiple high-frequency CDR3 sequences of the BCR IgG H chain were detected. This finding is also consistent with Long’s results,Citation28 suggesting that the current recombinant HB vaccine contains multiple HBsAg conformational epitopes that can trigger a humoral immune response and, thus, can activate multiple B-cell clones in the body. Alternately, in light of the report by Tajili et al. that 70% of the human molecular antibodies bound to the loop domain of the small-HBsAg and showed increased neutralizing activities,Citation29 the same antigenic epitope might have been recognized by many different B-cell clones. Therefore, these points need to be explored in further studies.
All five of our study subjects participated from spring to early winter. It is theoretically possible that the season could have influenced the diversity of their TCR and BCR repertoires, but the most likely mechanism for this would be an infection with a seasonal virus, such as influenza virus. Notably, none of our subjects were infected with any seasonal virus during this study; therefore, it is improbable that the season influenced the diversity observed in this work.
Several limitations associated with the present study warrant mention. First, because the number of samples tested was small and all five participants acquired immune protective levels of HBsAb after the third HB vaccination, we were unable to compare HB vaccine responders with non-HB vaccine responders. We were also unable to compare sex differences among subjects because only male subjects were used. Additionally, the reported changes in the TCR and BCR repertoires are from the total blood, and data were not collected from control subjects who remained unvaccinated; thus, it is not possible to determine if these changes are HBV-specific. Furthermore, T- and B-cell interactions with the HB vaccine were not clarified in this study. Lastly, some reports suggest that there is a relationship between age and repertoire diversity;Citation30–Citation33 however, the participants in the present study were all the same young age, so we were unable to evaluate the age-related response to the HB vaccine or the relationship between age and repertoire diversity during HB vaccination. Despite these limitations, our results suggest that an increased TCR β chain diversity and a decreased BCR IgG H chain diversity after the second HB vaccination could potentially serve as a surrogate prediction marker for a better response to the HB vaccine; further studies with additional subjects are needed to confirm this possibility. In addition, while the sample size of the present work is too small for detecting correlations between anti-HBV responses and specific factors, our data may be useful for future metadata reviews.
Here, we investigated the TCR β and BCR IgG H chains in the peripheral blood before and after HB vaccination. The TCR β chain CDR3 repertoire diversity significantly increased, and the BCR IgG H chain CDR3 repertoire diversity significantly decreased after the second HB vaccination in comparison with baseline levels. Further studies with more cases are needed to clarify if the repertoire diversity changes that occur in the TCR β and BCR IgG H chains following HB vaccination are associated with a better response to the HB vaccine.
Participants and methods
Participants
Five healthy medical students at Iwate Medical University, Japan with no history of HB vaccination or infection were recruited as healthy volunteers for this study. Potential subjects with active medical problems and/or concomitant medication use were excluded. Additionally, participants who were seropositive for HBsAg and/or antibodies against HBcAb or who had detectable HBsAb prior to enrollment were also excluded. All participants received their first HB vaccination as part of our study. For the duration of the study, the subjects did not receive any non-HB vaccinations and were monitored for illness. This research was conducted in 2017 at Iwate Medical University.
Vaccination and serological test
The subjects were immunized with three separate 10-µg doses of recombinant HB vaccine (Heptavax-II®; MSD K.K). The vaccine was administered via subcutaneous injections at 0, 1, and 6 months. Blood was taken before vaccination as well as within 21 days after both the second and third vaccinations. The serum HBsAb titer was measured by a chemiluminescent immunoassay (Architect; Abbott Japan Co., Ltd.) before the first immunization and within 21 days after both the second and third immunizations with recombinant HB vaccine.
HLA typing
All participants were screened for HLA-DPB1, HLA-DQB1 and HLA-DRB1 typing using the sequencing-based typing (SBT) method prior to vaccination. In brief, DNA was extracted and purified from whole blood, in accordance with the manufacturer’s instructions (QIAamp 96 DNA QIAcube HT, Qiagen).Citation34 Thereafter, HLA-DRB1, HLA-DQB1, and HLA-DPB1 were amplified via polymerase chain reaction (PCR) assays using HLA-DRB1-, HLA-DQB1-, and HLA-DRB1-specific primers, respectively. Selected regions in the amplified products were then sequenced by sequencing primers. The reactants were electrophoresed by a DNA analyzer. The resulting measurements were compared with the HLA sequence database to determine the allele type.
Isolation of peripheral blood mononuclear cells (PBMCs), cell sorting, and RNA extraction
Whole blood was collected from the five healthy volunteers. PBMCs were isolated with Ficoll-Paque PLUS™ (GE Healthcare Health Sciences) via density gradient centrifugation and washed with phosphate-buffered saline (PBS). Cell numbers were counted, and >106 cells were used for each RNA extraction. RNA was extracted and purified with an RNeasy Mini Kit (Qiagen) in accordance with the manufacturer’s instructions. RNA amounts and purity were measured with an Agilent 2200 TapeStation (Agilent Technologies) (Supplementary Table 2).
Unbiased amplification of TCR and BCR genes and sequencing
An NGS analysis was performed with the unbiased TCR/BCR repertoire analysis technology developed by Repertoire Genesis, Inc. In brief, unbiased adaptor-ligation PCR was performed in accordance with previous reports.Citation35,Citation36 Total RNA was converted to complementary DNA (cDNA) with Superscript III reverse transcriptase (Invitrogen). The BSL-18E primer(AAAGCGGCCGCATGCTTTTTTTTTTTTTTTTTTVN) containing polyT18 (Supplementary Table 3) and a NotI site was used for cDNA synthesis. After cDNA synthesis, double-stranded (ds)-cDNA was synthesized with Escherichia coli DNA polymerase I (Invitrogen), E. coli DNA ligase (Invitrogen), and RNase H (Invitrogen). The ds-cDNA was blunted with T4 DNA polymerase (Invitrogen). A P10EA/P20EA (GGGAATTCGG/TAATACGACTCCGAATTCCC) adaptor was ligated to the 5ʹ end of the ds-cDNA and then cut with a NotI restriction enzyme. After removal of the adaptor and primer with a MinElute Reaction Cleanup kit (Qiagen), PCR was performed with KAPA HiFi DNA polymerase (Kapa Biosystems) using either a TCR β chain constant region-specific primer (CB1: GAACTGGACTTGACAGCGGAACT, for TCR) or an IgG constant region-specific primer (CG1: CACCTTGGTGTTGCTGGGCTT, for BCR) and P20EA (Supplementary Table 3). The PCR conditions were as follows: 98°C (20 s), 65°C (30 s), and 72°C (1 min) for 20 cycles. The second PCR was performed with either CB2 (AGGCAGTATCTGGAGTCATTGAG) or CG2 (TCCTGAGGACTGTAGGACAGC) and P20EA primers using the same PCR conditions. Amplicons were prepared by the amplification of the products from the second PCR using P22EA-ST1 (GTCTCGTGGGCTCGGAGATGTGTATAAGAGACAGCTAATACGACTCCGAATTCCC) and either CB-ST1-R (TCGTCGGCAGCGTCAGATGTGTATAAGAGACAGGCTCAAACACAGCGACCTC) or CG-ST1-R (TCGTCGGCAGCGTCAGATGTGTATAAGAGACAGTGAGTTCCACGACACCGTCAC). After PCR amplification, index (barcode) sequences were added by amplification with Nextera XT index kit v2 setA (Illumina). The indexed amplicon products were mixed in an equal molar concentration and quantified by a Qubit 2.0 Fluorometer (Thermo Fisher Scientific). Sequencing was performed with the Illumina Miseq paired-end platform (2 × 300 bp).
Data analyses
All the paired-end reads were classified by index sequences. Sequence assignment was performed by determining the sequences with the highest identity in a dataset of reference sequences from the international ImMunoGeneTics information system® (IMGT) database (http://www.imgt.org). Data processing, assignment, and aggregation were performed automatically using a repertoire analysis software program originally developed by Repertoire Genesis Inc. The CDR3 nucleotide sequences ranging from a conserved cysteine at position 104 (Cys104) of IMGT nomenclature to a conserved phenylalanine at position 118 (Phe118) and the following glycine (Gly119) were translated to deduced amino acid sequences. Unique sequence reads (USRs) were defined as distinct sequence reads within the population of assigned sequence reads that had been identified as a TCR or BCR gene. The copy numbers of identical USRs in each sample were automatically counted using the RG software program and then ranked numerically. The percentage occurrence frequencies of sequence reads with a TCR β variable region (TRBV) and TCR β joining region (TRBJ) or BCR IgG H chain variable region (IGHV) and BCR IgG H chain joining region (IGHJ) in the total sequence reads were calculated.
Diversity index
To estimate the TCR and BCR diversity in deep sequence data, the Shannon–Weaver index (Hʹ) was calculated using the following formula:
where N is the total number of sequence reads, ni is the number of ith USRs, and S is the species number of USRs.Citation37 The greater the Hʹ value, the greater the sample diversity.
Statistical analyses
The SPSS software package (SPSS Statistics for Windows, SPSS Inc.), Easy R (EZR) version 1.37 (http://www.jichi.ac.jp/saitama-sct/SaitamaHP.files/statmed.html), and GraphPad software package (GraphPad Prism version 6.0, GraphPad Software Inc.) were used for statistical analyses. The distribution of normality was first assessed using the Shapiro–Wilk test, and then the difference in the diversity index between the groups was tested for significance using the paired t-test. Two-tailed p-values of <0.05 were considered statistically significant.
Ethical statement
This study was performed in accordance with the Declaration of Helsinki and the Ethical Guidelines on Biomedical Research Involving Human Subjects. This study was also approved by the Ethics Committees of Iwate Medical University. Written informed consent was obtained from all participants before enrollment.
Disclosure of potential conflicts of interest
The authors report no conflict of interest.
Supplemental Material
Download MS Word (44 KB)Acknowledgments
The authors are grateful to the five healthy volunteers for participating this study, to the nurses at the health management center of Iwate Medical University for assisting with the sample collection, and to Ms. Kouko Motodate for her assistance. We also thank Takaji Matutani, Kazutaka Kitaura, and Yukio Nakamura (Repertoire Genesis, Inc.) for their advice and help with the analysis and thank Katie Oakley, PhD, from Edanz Group (www.edanzediting.com/ac) for editing a draft of this manuscript.
Supplementary data
Supplemental data for this article can be accessed on the publisher’s website.
Additional information
Funding
References
- WHO, Global hepatitis report, 2017. https://www.who.int/hepatitis/publicatons/global-hepatitis-report2017/en/.
- Tanaka J, Akita T, Ohisa M, Sakamune K, Ko K, Uchida S, Satake M. Trends in the total numbers of HBV and HCV carriers in Japan from 2000 to 2011. J Viral Hepat. 2018;25:363–72. doi:10.1111/jvh.12828.
- Chaves SS, Fischer G, Groeger J, Patel PR, Thompson ND, Teshale EH, Stevenson K, Yano VM, Armstrong GL, Samandari T, et al. Persistence of long-term immunity to hepatitis B among adolescents immunized at birth. Vaccine. 2012;30:1644–49. doi:10.1016/j.vaccine.2011.12.106.
- Schönberger K, Riedel C, Rückinger S, Mansmann U, Jilg W, Kries R. Determinants of long-term protection after hepatitis B vaccination in infancy: a meta-analysis. The Pediatric Infec Dis J. 2013;32:307–13. doi:10.1097/INF.0b013e31827bd1b0.
- Ada G. Vaccines and vaccination. N Engl J Med. 2001;345:1042–53. doi:10.1056/NEJMra011223.
- Yoshioka N, Deguchi M, Hagiya H, Kagita M, Tsukamoto H, Takao M, Yoshida H, Yamamoto N, Akeda Y, Nabetani Y, et al. Durability of immunity by hepatitis B vaccine in Japanese health care workers depends on primary response titers and duration. PLoS One. 2017;12:e0187661. 10.137/journal. pone. 0187661. doi:10.1371/journal.pone.0187661.
- Young MD, Schneider DL, Zuckerman AJ, Du W, Dickson B, Maddrey WC; Group USHS. Adult hepatitis B vaccination using a novel triple antigen recombinant vaccine. Hepatology. 2001;34:372–76. 10.1053/jhep. 2001. 26167. doi:10.1053/jhep.2001.26167.
- Rosenberg C, Bovin NV, Bram LV, Flyvbjerg E, Erlandsen M, Vorup-Jensen T, Petersen E. Age is an important determinant in humoral and T cell responses to immunization with hepatitis B surface antigen. Hum Vaccin Immunother. 2013;9:1466–76. doi:10.4161/hv.24480.
- Van Loveren H, Van Amsterdam JG, Vandebriel RJ, Kimman TG, Rümke HC, Steerenberg PS, Vos JG. Vaccine-induced antibody responses as parameters of the influence of endogenous and environmental factors. Environ Health Perspect. 2001;109:757–64. doi:10.1289/ehp.01109757.
- Chen J, Liang Z, Lu F, Fang X, Liu S, Zeng Y, Zhu F, Chen X, Shen T, Li J, et al. Toll-like receptors and cytokines/cytokine receptors polymorphisms associate with non-response to hepatitis B vaccine. Vaccine. 2011;29:706–11. doi:10.1016/j.vaccine.2010.11.023.
- Jafarzadeh A, Bagheri-Jamebozorgi M, Nemati M, Golsaz-Shirazi F, Shokri F. Human leukocyte antigens influence the antibody response to hepatitis B vaccine. Iran J Allergy Asthma Immunol. 2015;14:233–45.
- Macedo LC, Isolani AP, Visentainer JE, Moliterno RA. Association of cytokine genetic polymorphisms with the humoral immune response to recombinant vaccine against HBV in infants. J Med Virol. 2010;82:929–33. doi:10.1002/jmv.21762.
- McDermott AB, Zuckerman JN, Sabin CA, Marsh SG, Madrigal JA. Contribution of human leukocyte antigens to the antibody response to hepatitis B vaccination. Tissue Antigens. 1997;50:8–14. doi:10.1111/tan.1997.50.issue-1.
- Mineta M, Tanimura M, Tana T, Yssel H, Kashiwagi S, Sasazuki T. Contribution of HLA class I and class II alleles to the regulation of antibody production to hepatitis B surface antigen in humans. Int Immunol. 1996;8:525–31.
- Sakai A, Noguchi E, Fukushima T, Tagawa M, Iwabuchi A, Kita M, Kakisaka K, Miyasaka A, Takikawa Y, Sumazaki R. Identification of amino acids in antigen-binding site of class II HLA proteins independently associated with hepatitis B vaccine response. Vaccine. 2017;35:703–10. doi:10.1016/j.vaccine.2016.08.068.
- Wang C, Tang J, Song W, Lobashevsky E, Wilson CM, Kaslow RA. HLA and cytokine gene polymorphisms are independently associated with responses to hepatitis B vaccination. Hepatology. 2004;39:978–88. doi:10.1002/hep.20142.
- Wang Y, Xu P, Zhu D, Zhang S, Bi Y, Hu Y, Zhou YH. Association of polymorphisms of cytokine and TLR-2 genes with long-term immunity to hepatitis B in children vaccinated early in life. Vaccine. 2012;30:5708–13. doi:10.1016/j.vaccine.2012.07.010.
- Xiong Y, Chen S, Chen R, Lin W, Ni J. Association between microRNA polymorphisms and humoral immunity to hepatitis B vaccine. Hum Vaccin Immunother. 2013;9:1673–78. doi:10.4161/hv.24938.
- Yucesoy B, Sleijffers A, Kashon M, Garssen J, de Gruijl FR, Boland GJ, van Hattum J, Simeonova PP, Luster MI, van Loveren H. IL-1beta gene polymorphisms influence hepatitis B vaccination. Vaccine. 2002;20:3193–96.
- Arnaout R, Lee W, Cahill P, Honan T, Sparrow T, Weiand M, Nusbaum C, Rajewsky K, Koralov SB. High-resolution description of antibody heavy-chain repertoires in humans. PLoS One. 2011;6:e22365. doi:10.1371/journal.pone.0022365.
- DeKosky BJ, Ippolito GC, Deschner RP, Lavinder JJ, Wine Y, Rawlings BM, Varadarajan N, Giesecke C, Dorner T, Andrews SF, et al. High-throughput sequencing of the paired human immunoglobulin heavy and light chain repertoire. Nat Biotechnol. 2013;31:166–69. doi:10.1038/nbt.2492.
- Hou XL, Wang L, Ding YL, Xie Q, Diao HY. Current status and recent advances of next generation sequencing techniques in immunological repertoire. Genes Immun. 2016;17:153–64. doi:10.1038/gene.2016.9.
- Kitaura K, Shini T, Matsutani T, Suzuki R. A new high-throughput sequencing method for determining diversity and similarity of T cell receptor (TCR) alpha and beta repertoires and identifying potential new invariant TCR alpha chains. BMC Immunol. 2016;17:38. doi:10.1186/s12865-016-0177-5.
- Woodsworth DJ, Castellarin M, Holt RA. Sequence analysis of T-cell repertoires in health and disease. Genome Med. 2013;5:98. doi:10.1186/gm502.
- Laserson U, Vigneault F, Gadala-Maria D, Yaari G, Uduman M, Vander Heiden JA, Kelton W, Taek Jung S, Liu Y, Laserson J, et al. High-resolution antibody dynamics of vaccine-induced immune responses. Proc Natl Acad Sci U S A. 2014;111:4928–33. doi:10.1073/pnas.1323862111.
- Truck J, Ramasamy MN, Galson JD, Rance R, Parkhill J, Lunter G, Pollard AJ, Kelly DF. Identification of antigen-specific B cell receptor sequences using public repertoire analysis. J Immunol. 2015;194:252–61. doi:10.4049/jimmunol.1401405.
- Xu L, You X, Zheng P, Zhang BM, Gupta PK, Lavori P, Meyer E, Zehnder JL. Methodologic considerations in the application of next-generation sequencing of human TRB repertoires for clinical use. J Mol Diagn. 2017;19:72–83. doi:10.1016/j.jmoldx.2016.07.009.
- Ma L, Wang X, Bi X, Yang J, Shi B, He X, Ma R, Ma Q, Yao X. Characteristics peripheral blood IgG and IgM heavy chain complementarity determining region 3 repertoire before and after immunization with recombinant HBV vaccine. PLoS One. 2017;12:e0170479. doi:10.1371/journal.pone.0170479.
- Tajiri K, Ozawa T, Jin A, Tokimitsu Y, Minemura M, Kishi H, Sugiyama T, Muraguchi A. Analysis of the epitope and neutralizing capacity of human monoclonal antibodies induced by hepatitis B vaccine. Antiviral Res. 2010;87:40–49. doi:10.1016/j.antiviral.2010.04.006.
- Britanova OV, Putintseva EV, Shugay M, Merzlyak EM, Turchaninova MA, Staroverov DB, Bolotin DA, Lukyanov S, Bogdanova EA, Mamedov IZ, et al. Age-related decrease in TCR repertoire diversity measured with deep and normalized sequence profiling. J Immunol. 2014;192:2689–98. doi:10.4049/jimmunol.1302064.
- Dunn-Walters DK. The ageing human B cell repertoire: a failure of selection? Clin Exp Immunol. 2016;183:50–56. doi:10.1111/cei.12700.
- Goronzy JJ, Weyand CM. T cell development and receptor diversity during aging. Curr Opin Immunol. 2005;17:468–75. doi:10.1016/j.coi.2005.07.020.
- Naylor K, Li G, Vallejo AN, Lee WW, Koetz K, Bryl E, Witkowski J, Fulbright J, Weyand CM, Goronzy JJ. The influence of age on T cell generation and TCR diversity. J Immunol. 2005;174:7446–52.
- Dunn PP. Human leucocyte antigen typing: techniques and technology, a critical appraisal. Int J Immunogenet. 2011;38:463–73. doi:10.1111/j.1744-313X.2011.01040.x.
- Kitaura K, Yamashita H, Ayabe H, Shini T, Matsutani T, Suzuki R. Different somatic hypermutation levels among antibody subclasses disclosed by a new next-generation sequencing-based antibody repertoire analysis. Front Immunol. 2017;8:389. doi:10.3389/fimmu.2017.00389.
- Matsutani T, Yoshioka T, Tsuruta Y, Iwagami S, Suzuki R. Analysis of TCRAV and TCRBV repertoires in healthy individuals by microplate hybridization assay. Hum Immunol. 1997;56:57–69.
- Kim BR, Shin J, Guevarra R, Lee JH, Kim DW, Seol KH, Lee JH, Kim HB, Isaacson R. Deciphering diversity indices for a better understanding of microbial communities. J Microbiol Biotechnol. 2017;27:2089–93. doi:10.4014/jmb.1709.09027.