
ABSTRACT
Subjects receiving the same vaccine often show different levels of immune responses and some may even present adverse side effects to the vaccine. Systems vaccinology can combine omics data and machine learning techniques to obtain highly predictive signatures of vaccine immunogenicity and reactogenicity. Currently, several machine learning methods are already available to researchers with no background in bioinformatics. Here we described the four main steps to discover markers of vaccine immunogenicity and reactogenicity: (1) Preparing the data; (2) Selecting the vaccinees and relevant genes; (3) Choosing the algorithm; (4) Blind testing your model. With the increasing number of Systems Vaccinology datasets being generated, we expect that the accuracy and robustness of signatures of vaccine reactogenicity and immunogenicity will significantly improve.
Introduction
Vaccines can protect us from infectious diseases by preparing the immune system to elicit antibody- and/or cell-mediated responses which are specific against the pathogen. The vaccine ability in inducing such responses is called immunogenicity. To become effective and to yield long-lasting immunity, vaccines must properly activate both innate and adaptive responsesCitation1 to generate memory T and B cells. Upon subsequent infection, these memory cells will differentiate into effector T cells and/or will produce neutralizing antibodies.
Vaccines may also cause adverse and non-intentional effects. Manufacturing issues, inappropriate handling, route of administration, genetic factors (e.g., race, sex, hormones, body mass index) among other factors have been associated with vaccine-associated adverse effects.Citation2-Citation4 Also, highly immunogenic vaccines usually trigger more adverse events than low immunogenic ones.Citation5 The events range from mild manifestations (e.g., itching, swelling, redness, fever, headache, and pain at the injection site) to more severe physiological alterations that may even culminate with the death of the vaccinee.Citation6
Methods that use molecular data to predict vaccine-induced immunogenicity or reactogenicity before or soon after vaccination are highly desired. Systems VaccinologyCitation7 achieved this by utilizing omics data and machine learning techniques to identify sets of genes that can predict vaccine immunogeniticy. By measuring the expression levels of few genes in the blood of vaccinees up to 1 week after vaccination, it is possible to predict whether the vaccinee will induce a high or low antibody or CD8 T cytotoxic responses several weeks after vaccination. Such approaches were successfully applied to vaccines against Yellow Fever,Citation8 Influenza,Citation9-Citation11 shingles,Citation12 meningococcusCitation13 and Malaria.Citation14 Similarly, the same strategy can be used to predict reactogenicity of vaccines.Citation15
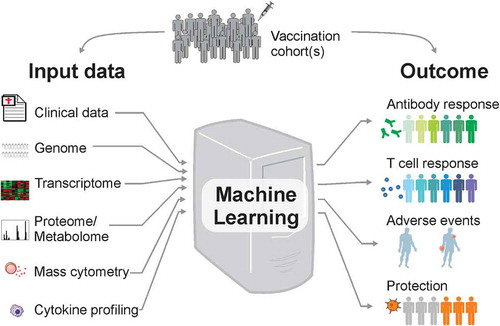
Despite the enormous importance of machine learning methods in predicting the beneficial or harmful effects of vaccination, most vaccinologists do not understand the technical details of these methods. We try to describe here, in an accessible way, how machine learning can be utilized within systems vaccinology. For simplicity, we will assume that the input data are derived from the blood transcriptome of vaccinees before or soon after vaccination (). In general, any type of medium- to high-throughput data such as proteomics and metabolomics, cytokine profiling, mass cytometry, among others can serve as input. The machine learning module then establishes a classification/predictive rule. The output of this rule predicts the status of immunogenicity (e.g., vaccinees that generated high or low antibody titers and CD8 T cell frequencies) or reactogenicity (e.g., vaccinees with low number of adverse events or with high/severe adverse events).
Figure 1. Using machine learning methods to predict vaccine-induced immunity and reactogenicity.
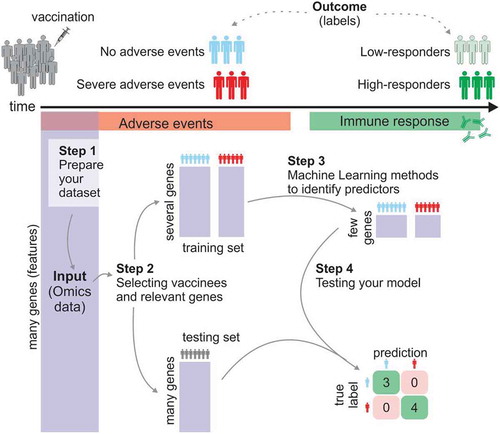
shows the basic four steps for the prediction framework. There are several software and packages that perform part of these steps. For instance, the open-source Java software WekaCitation16 provides a great collection of commonly used machine learning algorithms for data mining. In addition, the open-source software Orange contains several machine learning and data visualization featuresCitation17 that are designed for researchers with no bioinformatics training or background in computational biology.
Figure 2. The main four steps for identifying discriminatory signatures for vaccine-induced immunity and reactogenicity.
Step 1: assessing and preprocessing (prepare your dataset)
The quality of the input data directly impacts the performance of the predictive model. Thus, it is critical to have good quality data which are also properly normalizedCitation18 Because most datasets are large, samples are often processed on different days, with different kits and protocols, and by different people. To minimize the impact of these practice variance technical factors on the downstream analysis, systems vaccinologists may randomize samples across different batches and run batch correction methods.Citation19 In addition, the Bioconductor R tool PVCA (Principal Variance Component Analysis) can be usedCitation20 to assess the effect of the technical batches, as well as the effect of biological confound factors (gender, age, immunological parameters, etc.) on your dataset. The good quality of the immune response (to be predicted) should also be ensured. And the best way to improve data reliability is to assure that the serological assay is qualified if not validated according to known parameters for assay development. It is usually required that the serological assay being used for a clinical trial be at least qualified. Such parameters include LLOQ, LLOD, ULOQ, linearity, specificity, reproducibility, ruggedness, etc.
In supervised machine learning, the goal is to identify sets of features (i.e., biological components) that can predict an outcome (see ). The outcome represents the “labels” of vaccinees that must be previously defined in the training process. In classification models, the aim is to predict discrete class of labels. For instance, subjects that received the inactivated influenza vaccine may be labeled “high-responders” if their antibody titers 28 days post-vaccination had increased fourfold or more when compared to their baseline antibody titers.Citation10 Labels related to vaccine protection after challengeCitation14,Citation21,Citation22 or to the occurrence of severe adverse eventsCitation23 after vaccination can also be used for classification. Regression predictive modeling should be applied instead when the goal is to predict continuous values, such as the magnitude of the response (i.e., increase of antibody titers, number of adverse events or frequency of activated CD8 T cells) ().
Step 2: select the vaccinees and relevant genes
In systems vaccinology, the main goal of machine learning techniques is to use a set of known data to train the model to uncover the combination of genes and parameters that best predict the outcome of vaccinees. This initial dataset (e.g., data derived from omics experiments) that is used to identify this combination is called the training set. Feature selection and model training are performed through k-fold cross-validation (see ) or take-one-out on the training set to obtain an unbiased accuracy of the established rule. It is possible that feature selection fails to find the representative discriminatory gene signatures. In this case, the resulting model may have poor unbiased accuracy; or that even if it has high unbiased accuracy on the training set, that is, it is able to predict the response of vaccinees that were part of the training set, it fails to predict the response of new vaccinees (that were not part of the training set). To properly evaluate the predictive power of the model, and thus ensuring that the model can be generalized to future vaccinees, additional datasets are required. Such datasets are called testing, validating or blind prediction sets.
This step aims to select which vaccinees or vaccine cohorts will be used to train and which to test the model. Ideally, the testing set should comprise vaccinees from an independent cohortCitation8 or from a different Influenza season in the case of influenza vaccine.Citation9 When it is not possible to have an independent dataset, the initial dataset can be split randomly into training and testing sets. While there is no rule for defining the fraction of vaccinees that should be used for training, a fraction between 50% and 70% is recommended since using too high of a fraction will lead to overfitting (see ).
Let’s now assume that in a hypothetical cohort 90% of the vaccinees are low-antibody responders and 10% are high-antibody responders. If your classification model predicts that all vaccinees are low responders, the overall accuracy of your prediction appears to be 90%. However, this does not mean your model did a good job – although the sensitivity is 100% (that is all low responders are predicted correctly), the specificity is 0% (all high responders are predicted wrongly). Hence, it is very critical to report accuracy for each group rather than the overall accuracy. Imbalanced data, as in this example, remains a major challenge in machine learning. In this case, the overall accuracy reflects little confidence in the predictive accuracy for each group. Better performance metrics, such as the F1 score, or the confusion matrix, which reports accuracy of both groups (sensitivity and specificity) should be employed.
Active research is currently pursued in managing imbalanced data. One approach is to collect more data, though this may not be viable in practice. If the number of vaccinees is large enough, one tactic is to resample the dataset to have more balanced data. However, resampling does not guarantee a better outcome. Some machine learning techniques are designed to address imbalanced data (see step 3 below). For example, the penalized models (i.e., mistakes on the minority class receives higher costs during training) may help in dealing with this problem.
System vaccinology utilizes high-throughput omics data that describe the levels of tens of thousands of genes, proteins or metabolites before or after vaccination. Most of these biological components (i.e., the “features”) do not contribute to the model (that is they are not predictors). In fact, they may negatively impact model performance. Thus, feature selection is a fundamental step to remove the irrelevant or partially relevant genes. This step can be performed before the training is initiated, which helps simplify the models while facilitate their interpretation, reduces training time, and increases the generalization of the model.Citation24 Feature selection can also be embedded successfully within the classification machine learning process, which offers a more unbiased system feature selection.Citation25
There are three main types of feature selection methods that can be applied to Systems vaccinology: (i) Filter, (ii) Wrapper and (iii) Embedded. These methods differ in the way they combine the selection algorithm and the machine learning model. The choice of the feature selection methods can be based on the dataset size and outcome complexity. Also, Filter methods can often be combined with either Wrapper or Embedded ones.
Filter methods
Filter methods are faster than others because they work independently of any learning algorithm and of cross-validation performance. These methods can select or remove features based on different criteria. Low-expressed genes or genes whose expression does not vary between samples (low variance) can be removed because they are either not reliable or not informative. Filters can select features based upon their ability to distinguish between groups of samples (e.g., low- versus high-responders) or based upon their association with the response (e.g., correlation with antibody titers). A variety of predefined metrics or information content is available and widely used, including the traditional t-statistic,Citation9 the information gain,Citation26 and the mutual information.Citation27
(ii) Wrapper methods
Wrapper methods measure the usefulness of features based on the classifier performance. Because they are computationally more expensive when compared to other feature selection methods, a wrapper method works well when the dataset contains a relatively small number of features. Cytokine profiling data are a good example of a “small dataset”. Recursive feature elimination (RFE) is a method that follows an iterative procedure where features are ranked based upon their importance in classifying the training set and then the feature(s) with smallest ranking criterion is(are) removed. The RFE was implemented from Support Vector MachinesCitation28 or Random ForestCitation29 algorithms. Besides that, both algorithms can be used to rank the feature importance and also remove correlated predictors.
(iii) Embedded methods
Embedded algorithms also select features during classification process as part of the learning. It differs from filter and wrapper strategies which perform selection in a preprocessing phase.Citation30 Classification algorithms that employ an embedded feature selection strategy include decision trees,Citation31 Random Forest,Citation32 neural networks,Citation33 discrete support vector machineCitation11,Citation25 among others.
Step 3: choose the machine learning algorithm
Supervised learning is the process of establishing a predictive model by using labeled data for training, whereas unsupervised learning is applied when there is no a-priori knowledge about the labels present in the dataset. A semi-supervised learning combines both strategies and it is used when only a fraction of the training data is labeled.
For supervised learning approaches, there is a wide range of open-source algorithms to choose from.Citation34 Each algorithm has specific characteristics and several of them operate in a “Black Box” mode.Citation35 Depending on the input data set and the prediction objectives, the algorithms will produce varying performances. Therefore, it is important to test different machine learning algorithms, such as Support Vector Machines, K-nearest neighbor, Artificial Neural Networks, Logistic Multiple Network-constrained Regression, Classification And Regression Tree, Random Forest, Adaboost and XGboost. The applications of such methods in systems biology and genomics were extensively reviewed by Eraslan et al.Citation34 and Camacho et al.Citation35
Regression analysis is a statistical method which has long been used in analyzing medical data.Citation36 This type of analysis examines the influence of one or more independent variables (e.g., genes, metabolites, cytokines) on a dependent variable (e.g., antibody titers). This simple approach can reveal novel insights about the molecular mechanisms of vaccine-induced immunity.Citation37
The Support Vector Machines are supervised linear or nonlinear optimization-based classification algorithms that, given a training data set, identify a hyperplane that separates the two classes (e.g., high- or low-vaccine responders) and thus assembles a model capable of classifying new samples.Citation38 Discriminant analysis via mixed integer programming (DAMIP) is a multi-group classifier with an embedded combinatorial feature selection algorithm.Citation25 The multi-group predictive model can incorporate heterogeneous types of data as input; it has a high-dimensional data transformation that reduces noise and errors; it incorporates constraints to limit the rate of misclassification, and a reserved-judgment region that provides a safeguard against over-training (which tends to lead to high misclassification rates from the resulting predictive rule). The DAMIP classifier is totally universally consistent, and hence handles imbalanced data very well. DAMIP has been applied successfully to predicting vaccine immunogenicity in yellow fever, influenza, and malaria.Citation8-Citation10,Citation14
The artificial neural networks are statistical methods capable of modeling nonlinear systems, where the relationship between the variables is unknown or complex. Its name is due to the representation of its architecture, which refers to the human neural network, and its ability to “learn/assimilate”.Citation39
Two other predictive frameworks were recently developed and applied to assess influenza vaccine responses.Citation40,Citation41 The Logistic Multiple Network-constrained Regression (LogMiNeR)Citation40 incorporates prior knowledge on human signaling pathways to produce models that help us understand how the immune system responds to influenza vaccination at molecular level. This method identified associations between specific B cell genes and mTOR signaling and an effective response to influenza vaccination.Citation40 The Sequential Iterative Modeling “OverNight” (SIMON)Citation41 is an automated machine learning approach that combines results from 128 different algorithms and can be applied to analyze multidimensional clinical data collected across multiple vaccine cohorts. SIMON was able to reveal a strong association between CD4+ and CD8 + T cell subsets with a robust antibody response to influenza antigens.Citation41
Step 4: test your model
Cross-validation is a technique to evaluate the quality of the classifiers by partitioning the dataset into a training set to train the model, and a test set to evaluate it. In k-fold cross-validation (see ), the dataset is randomly partitioned into k roughly equal size. In each iteration, a single partition is withheld as the validation/testing data for the model, and the remaining k-1 partitions are used as training data. The cross-validation process is then repeated k times (the folds), with each of the k partitions used exactly once as the validation data. The k results from the folds are then combined to produce the unbiased estimate for the classifier. The advantage of this method is that all observations are used for both training and validation, and each observation is used for validation exactly once. Furthermore, when the patient cohort is relatively small, cross-validation provides some confidence in the predictive accuracy.
More ideally, the testing dataset should be an independent set of patient data. When that is not available, the hold-out method can be used. Specifically, the vaccine cohorts are divided into intro training and testing sets before the training starts. The testing set is only utilized at the end to evaluate the model accuracy in predicting the class of new vaccines.
In our recent work on yellow fever,Citation8 human influenzaCitation9,Citation10 and malariaCitation14 vaccine immunogenicity prediction, we employed 10-fold cross-validation on the training set to establish the predictive rules with the set of discriminatory signatures, and use hold-out and an independent testing set for blind prediction to establish confidence in the predictive accuracy.
The choice of evaluation metrics depends on the specific machine learning task. Some common metrics include Accuracy, Confusion matrix, Logarithmic Loss, and Area Under the ROC Curve (see ). Accuracy is a common metric and it is calculated as the number of correct predictions divided by the total number of input data. However, this may not be sufficiently informative since the model can learn to classify only the most frequent class, as shown in the imbalanced data scenario. In general, the confusion matrix, which reports true positives, true negatives, false positives, false negatives, provides a more detailed of unbiased analysis of correct and incorrect classifications for each class. Confusion Matrix forms the basis for the other types of metrics.
In regression problems, the most common metrics for evaluating are Mean Absolute Error and Root Mean Squared Error. The former is equivalent to the sum of the absolute differences between predictions and actual values, while the latter measures the average magnitude of the error by taking the square root of the average of squared differences between prediction and actual observation.
Challenges and perspectives
In systems vaccinology, there are several potential confounding variables. These variables may influence both the independent variables (e.g., expression levels of genes) and dependent variable (e.g., vaccine immune response). If not properly managed, confounding variables may directly impact the machine learning results. Also, in addition to the intrinsic heterogeneity between individuals, the noise and biases introduced by high-throughput technologies make systems vaccinology analyses even more challenging.
The gender of vaccinees is associated with differences in the immune responses to certain vaccines. Females may display greater responses than male upon vaccination against pneumococcal,Citation42 influenza,Citation43 yellow fever,Citation2 among others. Similarly, the route of vaccine administration may also be a critical confounding variable.Citation43 Finally, the vaccinee’s preexisting immunity,Citation44 microbiota,Citation45 and existing chronic inflammatory conditions or infectionsCitation46 may directly impact vaccine immunogenicity. These data can all serve as part of the input to the model, in addition to the omics and biological data.
Response to vaccination relies on the orchestration of multiple biological processes, including differentiation and interaction of multiple cell types. Most system vaccinology papers have applied transcriptomics to study the dynamics of vaccine response in PBMCs.Citation47 Nevertheless, variation in mRNA levels observed in blood can reflect both changes in cell frequency and in mRNA abundance.Citation7 Moreover, different cell populations present diverse patterns in activation of biological pathways, production of proteins or gene methylation in response to perturbations. Bulk phenotype assessment is not equipped to resolve the contributions of different cell types to these perturbations. Exciting new technological developments offer the possibility to quantify complete sets of biological molecules at a single-cell level and at a high-resolution. For example, a time course single-cell experiment performed by Jaitin et al.Citation48 revealed that a high-fat diet causes a massive reorganization of the immune cell populations in visceral adipose tissue in mice. A similar longitudinal experiment at single-cell level may better characterize human immune responses to vaccination.
Recent technological developments can interrogate and question millions of variables in the same sample. Nevertheless, this can also bring disadvantages. Increasing the number of measured variables without an exponential increase in sample size implies that data points will not be evenly distributed in this n-dimensional space. This is known as the “curse of dimensionality”.Citation49 To circumvent this issue and increase the predictive power of classifiers, one can design experiments with enough vaccinees.Citation50 More importantly, dimension reduction and feature selection approaches must be advanced within machine learning framework to uncover the small set of critical predictive system features.
The predictive power of signatures increases when more data are available for training.Citation51,Citation52 With the current high-throughput techniques, many laboratories can easily generate large amounts of data. As more and more systems vaccinology studies are published, the greater the chances of obtaining very robust predictive signatures of vaccine reactogenicity and immunogenicity. These can contribute to the development and design not only of new vaccines but also to the optimization of current ones.
Box. Glossary of common Machine Learning jargons applied to Systems Vaccinology.
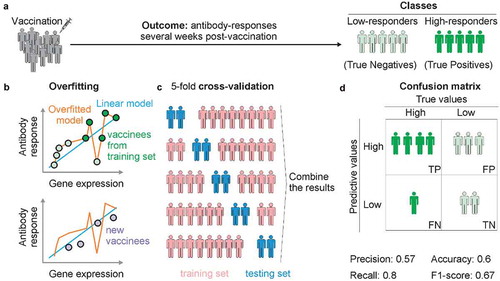
Let us consider a set of 10 vaccinated people, of which 5 had a high-antibody response and 5 had a low-antibody response post-vaccination. For explanation, let the positive response people be denoted by the dark green dots, and the light green dots correspond to the low antibody group (Panel A).
Overfitting
In statistics, overfitting is “the production of an analysis that corresponds too closely or exactly to a particular set of data, and may therefore fail to fit additional data or predict future observations reliably”. In our context, in a cohort of vaccinated people, we may identify genes and relationships that align and describe perfectly this given set of people. However, the genes and its relationship fail to describe another set of vaccinated people. Overfitting leads to poor prediction. In a cohort of vaccinated people, we can identify a gene that has a linear correlation between its expression and the vaccine-induced antibody response. By plotting each vaccinee as a dot on a scatter plot where the x-axis is the gene expression level and the y-axis is the antibody levels, it is possible to draw a line that explains this linear model (Panel B). The graph will show that most of the vaccinees are not exactly over the line that represents the model. It is possible to create a non-linear model that goes through all dots of the graph. In this case, the model will perfectly explain the gene and antibody expression levels of all vaccinees in the cohort. However, fitting the model this way would not make it applicable to a different cohort of vaccinees. In this situation, we say that the model is overfitted.
K-fold cross-validation
Ten-fold cross-validation is a standard technique used in classification to unbiased estimate of the resulting predictive rule. Ideally, it is also important to blind test the predictive power of the resulting rule using an independent set of samples. However, this may not be possible in practice. In this case, one can partition the cohort of patients randomly into two sets, the training set, and the blind validation set. Usually, 70% of the samples are used for training to establish the predictive rule. For the 100 vaccinees, we can withhold 30 of them for blind test. To perform a 10-fold cross-validation (k = 10), 10 subgroups containing 7 random vaccinees are created. For each of the subgroups, the model is trained on 63 people who are not in the subgroup and then validated in the subgroup. The sum of the results of these processes are calculated, providing the unbiased estimate of the model. Leave-one-out cross-validation is when the value of “k” is equal to the total number of samples, i.e., each single sample is separated from the whole and used to validate the accuracy of the model. Once the rule is established, it will be used to blind test the group status of the blind test set. This provides a predictive accuracy of the resulting classification rule. The Panel C shows a fivefold cross-validation example.
Confusion matrix
A confusion matrix is a table that is often used to describe the performance of a classification model (or “classifier”) on a set of test data for which the true values are known. It allows the visualization of the performance of the classification model. If there are two groups, then the confusion matrix includes 22 entries: true positives (TP), true negatives (TN), false positives (FP) and false negatives (FN), precisely as shown in Panel D. For example, assume that in the cohort of 10 vaccinees shown in Panel A, the algorithm predicts seven high-responders and three low-responders. Of the seven vaccinees predicted as high-responders, four are truly high-responders (True Positives) and three others are therefore False Positives. Of the three people predicted as low-responders, two are really low-responders (True Negatives) and one is a high-responder (False Negative). The confusion matrix will show how many people predicted as one of the classes (high or low responders) actually belong to this class (Panel D). From this table, we can calculate the precision, recall, F1 score and accuracy (among other metrics). Accuracy is the sum of true positives (four vaccinees) and true negatives (two vaccinees) divided by the total of true positives (5) and true negatives (5). In our example, the accuracy is 0.6. Precision is the number of predicted results that are true positives (4) divided by the number of true positives (4) plus the false positives (3). In our example, precision is 0.57. Recall is the number of predicted results that are true positives (4) divided by the number of true positives (4) plus false negatives (1). So, Recall is then given by 4/(4 + 1) = 0.8. The F1-score metric is a harmonic mean of precision and recall. It is calculated with the formula 2 * [(precision * recall)/(precision + recall)]. So, F1-score would be 2 * [(0.57 * 0.8)/(0.57 + 0.8)] = 0.67.
Disclosure of potential conflicts of interest
No potential conflicts of interest were disclosed.
Additional information
Funding
References
- Pulendran B, Ahmed R. Immunological mechanisms of vaccination. Nat Immunol. 2011;12:509–17. doi:10.1038/ni.2039.
- Klein SL, Jedlicka A, Pekosz A. The Xs and Y of immune responses to viral vaccines. Lancet Infect Dis. 2010;10:338–49. doi:10.1016/S1473-3099(10)70049-9.
- Beyer WE, Palache AM, Kerstens R, Masurel N. Gender differences in local and systemic reactions to inactivated influenza vaccine, established by a meta- analysis of fourteen independent studies. Eur J Clin Microbiol Infect Dis. 1996;15:65–70. doi:10.1007/BF01586187.
- Nichol KL, Margolis KL, Lind A, Murdoch M, McFadden R, Hauge M, Magnan S, Drake M. Side effects associated with influenza vaccination in healthy working adults. A randomized, placebo-controlled trial. Arch Intern Med. 1996;156:1546–50.
- Nakayama T. Causal relationship between immunological responses and adverse reactions following vaccination. Vaccine. 2019;37:366–71. doi:10.1016/j.vaccine.2018.11.045.
- Martins RM, Maia MDLS, Farias RHG, Camacho LAB, Freire MS, Galler R, Yamamura AMY, Almeida LFC, Lima SMB, Nogueira RMR, et al. 17DD yellow fever vaccine: a double blind, randomized clinical trial of immunogenicity and safety on a dose-response study. Hum Vaccin Immunother. 2013;9:879–88. doi:10.4161/hv.22982.
- Pulendran B, Li S, Nakaya HI. Systems vaccinology. Immunity. 2010;33:516–29. doi:10.1016/j.immuni.2010.10.006.
- Querec TD, Akondy RS, Lee EK, Cao W, Nakaya HI, Teuwen D, Pirani A, Gernert K, Deng J, Marzolf B, et al. Systems biology approach predicts immunogenicity of the yellow fever vaccine in humans. Nat Immunol. 2009;10:116–25. doi:10.1038/ni.1688.
- Nakaya HI, Wrammert J, Lee EK, Racioppi L, Marie-Kunze S, Haining WN, Means AR, Kasturi SP, Khan N, Li G-M, et al. Systems biology of vaccination for seasonal influenza in humans. Nat Immunol. 2011;12:786–95. doi:10.1038/ni.2067.
- Nakaya HI, Hagan T, Duraisingham S, Lee E, Kwissa M, Rouphael N, Frasca D, Gersten M, Mehta A, Gaujoux R, et al. Systems analysis of immunity to influenza vaccination across multiple years and in diverse populations reveals shared molecular signatures. Immunity. 2015;43:1186–98. doi:10.1016/j.immuni.2015.11.012.
- Nakaya HI, Clutterbuck E, Kazmin D, Wang L, Cortese M, Bosinger SE, Patel NB, Zak DE, Aderem A, Dong T, et al. Systems biology of immunity to MF59-adjuvanted versus nonadjuvanted trivalent seasonal influenza vaccines in early childhood. Proc Natl Acad Sci USA. 2016;113:1853–58. doi:10.1073/pnas.1519690113.
- Li S, Sullivan NL, Rouphael N, Yu T, Banton S, Maddur MS, McCausland M, Chiu C, Canniff J, Dubey S, et al. Metabolic phenotypes of response to vaccination in humans. Cell. 2017;169:862–877 e817. doi:10.1016/j.cell.2017.04.026.
- Li S, Rouphael N, Duraisingham S, Romero-Steiner S, Presnell S, Davis C, Schmidt DS, Johnson SE, Milton A, Rajam G, et al. Molecular signatures of antibody responses derived from a systems biology study of five human vaccines. Nat Immunol. 2014;15:195–204. doi:10.1038/ni.2789.
- Kazmin D, Nakaya HI, Lee EK, Johnson MJ, van der Most R, van den Berg RA, Ballou WR, Jongert E, Wille-Reece U, Ockenhouse C, et al. Systems analysis of protective immune responses to RTS,S malaria vaccination in humans. Proc Natl Acad Sci USA. 2017;114:2425–30. doi:10.1073/pnas.1621489114.
- Campbell-Tofte J, Vrahatis A, Josefsen K, Mehlsen J, Winther K. Investigating the aetiology of adverse events following HPV vaccination with systems vaccinology. Cell Mol Life Sci. 2019;76:67–87. doi:10.1007/s00018-018-2925-6.
- Witten I, Frank E, Hall M, Pal C. Data mining: practical machine learning tools and techniques. 4th ed. Elsevier; 2017. ISBN: 9780128043578(eBook).
- Demsar J, Curk T, Erjavec A, Gorup Č, Hočevar T, Milutinovič M, Možina M, Polajnar M, Toplak M, Starič A, et al. Orange: data mining toolbox in python. J Mach Learn Res. 2013;14:2349–53.
- Conesa A, Madrigal P, Tarazona S, Gomez-Cabrero D, Cervera A, McPherson A, Szcześniak MW, Gaffney DJ, Elo LL, Zhang X, et al. A survey of best practices for RNA-seq data analysis. Genome Biol. 2016;17. doi:10.1186/s13059-016-0881-8.
- Gradin R, Lindstedt M, Johansson H. Batch adjustment by reference alignment (BARA): improved prediction performance in biological test sets with batch effects. PLoS One. 2019;14:e0212669. doi:10.1371/journal.pone.0212669.
- Scherer A, editor. Batch effects and noise in microarray experiments: sources and solutions. J. Wiley; 2009. doi:10.1002/9780470685983; ISBN:9780470741382.
- Blohmke CJ, Hill J, Darton TC, Carvalho-Burger M, Eustace A, Jones C, Schreiber F, Goodier MR, Dougan G, Nakaya HI, et al. Induction of cell cycle and NK cell responses by live-attenuated oral vaccines against typhoid fever. Front Immunol. 2017;8:1276. doi:10.3389/fimmu.2017.01276.
- Jochems SP, Marcon F, Carniel BF, Holloway M, Mitsi E, Smith E, Gritzfeld JF, Solórzano C, Reiné J, Pojar S, et al. Inflammation induced by influenza virus impairs human innate immune control of pneumococcus. Nat Immunol. 2018;19:1299–308. doi:10.1038/s41590-018-0231-y.
- Huttner A, Combescure C, Grillet S, Haks MC, Quinten E, Modoux C, Agnandji ST, Brosnahan J, Dayer JA, Harandi AM, et al. A dose-dependent plasma signature of the safety and immunogenicity of the rVSV-Ebola vaccine in Europe and Africa. Sci Transl Med. 2017;9. doi:10.1126/scitranslmed.aaj1701.
- Langley P. Elements of machine learning. Morgan Kaufmann; 1996. ISBN-13: 978-1558603011.
- Lee EK. Large-scale optimization-based classification models in medicine and biology. Ann Biomed Eng. 2007;35:1095–109. doi:10.1007/s10439-007-9317-7.
- Lai CM, Yeh WC, Chang CY. Gene selection using information gain and improved simplified swarm optimization. Neurocomputing. 2016;218:331–38. doi:10.1016/j.neucom.2016.08.089.
- Battiti R. Using mutual information for selecting features in supervised neural-net learning. IEEE T Neural Network. 1994;5:537–50. doi:10.1109/72.298224.
- Guyon I, Weston J, Barnhill S, Vapnik V. Gene selection for cancer classification using support vector machines. Mach Learn. 2002;46:389–422. doi:10.1023/A:1012487302797.
- Darst BF, Malecki KC, Engelman CD. Using recursive feature elimination in random forest to account for correlated variables in high dimensional data. BMC Genet. 2018;19. doi:10.1186/s12863-018-0633-8.
- Pereira RB, Plastino A, Zadrozny B, Merschmann LHC. Categorizing feature selection methods for multi-label classification. Artif Intell Rev. 2018;49:57–78. doi:10.1007/s10462-016-9516-4.
- Saeys Y, Inza I, Larranaga P. A review of feature selection techniques in bioinformatics. Bioinformatics. 2007;23:2507–17. doi:10.1093/bioinformatics/btm344.
- Breiman L. Random forests. Mach Learn. 2001;45:5–32. doi:10.1023/A:1010933404324.
- Cai J, Luo JW, Wang SL, Yang S. Feature selection in machine learning: A new perspective. Neurocomputing. 2018;300:70–79. doi:10.1016/j.neucom.2017.11.077.
- Eraslan G, Avsec Z, Gagneur J, Theis FJ. Deep learning: new computational modelling techniques for genomics. Nat Rev Genet. 2019;20:389–403. doi:10.1038/s41576-019-0122-6.
- Camacho DM, Collins KM, Powers RK, Costello JC, Collins JJ. Next- generation machine learning for biological networks. Cell. 2018;173:1581–92. doi:10.1016/j.cell.2018.05.015.
- Godfrey K. Simple linear regression in medical research. N Engl J Med. 1985;313:1629–36. doi:10.1056/NEJM198512263132604.
- Lever M, Silveira EL, Nakaya HI. Systems vaccinology applied to DNA vaccines: perspective and challenges. Curr Issues Mol Biol. 2017;22:1–16. doi:10.21775/cimb.022.001.
- Hu Y, Hase T, Li HP, Prabhakar S, Kitano H, Ng SK, Ghosh S, Wee LJK. A machine learning approach for the identification of key markers involved in brain development from single-cell transcriptomic data. BMC Genomics. 2016;17:1025. doi:10.1186/s12864-016-3317-7.
- Amato F, López A, Peña-Méndez EM, Vaňhara P, Hampl A, Havel J. Artificial neural networks in medical diagnosis. J Appl Biomed. 2013;11:47–58. doi:10.2478/v10136-012-0031-x.
- Avey S, Mohanty S, Wilson J, Zapata H, Joshi SR, Siconolfi B, Tsang S, Shaw AC, Kleinstein SH. Multiple network-constrained regressions expand insights into influenza vaccination responses. Bioinformatics. 2017;33:I208–I216. doi:10.1093/bioinformatics/btx384.
- Tomic A, Tomic I, Rosenberg-Hasson Y, Dekker CL, Maecker HT, Davis MM. SIMON, an automated machine learning system, reveals immune signatures of influenza vaccine responses. J Immunol. 2019;203:749–59. doi:10.4049/jimmunol.1900033.
- Cook IF. Evidence based route of administration of vaccines. Hum Vaccines. 2008;4:67–73. doi:10.4161/hv.4.1.4747.
- Furman D, Hejblum BP, Simon N, Jojic V, Dekker CL, Thiebaut R, Tibshirani RJ, Davis MM. Systems analysis of sex differences reveals an immunosuppressive role for testosterone in the response to influenza vaccination. Proc Natl Acad Sci USA. 2014;111:869–74. doi:10.1073/pnas.1321060111.
- Tsang JS, Schwartzberg P, Kotliarov Y, Biancotto A, Xie Z, Germain R, Wang E, Olnes M, Narayanan M, Golding H, et al. Global analyses of human immune variation reveal baseline predictors of postvaccination responses. Cell. 2014;157:499–513. doi:10.1016/j.cell.2014.03.031.
- Nakaya HI, Bruna-Romero O. Is the gut microbiome key to modulating vaccine efficacy? Expert Rev Vaccines. 2015;14:777–79. doi:10.1586/14760584.2015.1040395.
- Zimmermann P, Curtis N. Factors that influence the immune response to vaccination. Clin Microbiol Rev. 2019;32:e00084–18. doi:10.1128/CMR.00084-18.
- Davis MM, Tato CM. Will systems biology deliver its promise and contribute to the development of new or improved vaccines? Seeing the forest rather than a few trees. Cold Spring Harbor Perspect Biol. 2018;10:10.1101/cshperspect.a028886.
- Jaitin DA, Adlung L, Thaiss CA, Weiner A, Li B, Descamps H, Lundgren P, Bleriot C, Liu Z, Deczkowska A, et al. Lipid-associated macrophages control metabolic homeostasis in a trem2-dependent manner. Cell. 2019;178:686–698 e614. doi:10.1016/j.cell.2019.05.054.
- Clarke R, Ressom HW, Wang A, Xuan J, Liu MC, Gehan EA, Wang Y. The properties of high-dimensional data spaces: implications for exploring gene and protein expression data. Nat Rev Cancer. 2008;8:37–49. doi:10.1038/nrc2294.
- Figueroa RL, Zeng-Treitler Q, Kandula S, Ngo LH. Predicting sample size required for classification performance. BMC Med Inform Decis Mak. 2012;12:8. doi:10.1186/1472-6947-12-8.
- de Fortuny EJ, Martens D, Provost F. Predictive modeling with big data: is bigger really better? Big Data-Us. (vol 14, pg 215, 2013). 2019;7:83–83. doi:10.1089/big.2013.0037.correx.
- Kim SY. Effects of sample size on robustness and prediction accuracy of a prognostic gene signature. BMC Bioinformatics. 2009;10. doi:10.1186/1471-2105-10-147.