
ABSTRACT
The “big six” countries (Bangladesh, India, Indonesia, Myanmar, Nepal, and Thailand) in the World Health Organization South-East Asia Region (WHO SEAR) are currently facing severe challenges in measles elimination and consequent childhood mortality reduction, with inadequacies and inequalities in the coverage of the measles-containing-vaccine first-dose (MCV1) being major obstacles. However, these issues of inequality in MCV1 coverage have not yet been systematically examined. We used data from the latest Demographic and Health Surveys and Multiple Indicator Cluster Surveys. To provide a comprehensive picture of existing MCV1 coverage gaps, data were disaggregated by geographic location, as well as by socioeconomic and nutritional dimensions. National MCV1 coverage ranged from 77% in Myanmar to 92% in Thailand. Only nine of the 104 sub-national districts had achieved the 95% MCV1 coverage goal as set by the WHO. Geographic inequalities were more pronounced in countries with lower coverage levels. Areas in clusters with poor MCV1 coverage performances as well as disadvantaged socioeconomic profiles require increased attention. Inequalities were evident in all countries, except Thailand, and were more pronounced in the sectors of wealth, education, antenatal care (ANC) status, and vitamin A supplementation (VAS) when compared against the areas of gender and urban/rural residence. Wealth-related inequality in Bangladesh, education-related inequality in Indonesia, ANC-related inequalities in Myanmar and Nepal, and VAS-related inequalities in Indonesia and Myanmar were all noteworthy. Equity-oriented changes in policies focusing on health promotion and integrated interventions among disadvantaged populations need to be implemented in order to increase MCV1 coverage and reduce childhood mortality.
Introduction
Measles is a highly contagious disease and remains as a major cause of childhood mortality, accounting for 142,300 related deaths globally in 2018.Citation1 In 2013, all countries within the World Health Organization South-East Asia Region (WHO SEAR) committed to eliminating measles by 2020.Citation2 As a result, significant progress has been made toward eliminating measles in this region. Thus far, it has been confirmed that Bhutan, the Maldives, the Democratic People’s Republic of Korea, and Timor-Leste have all eliminated measles, with Sri Lanka nearly having done so.Citation3,Citation4 However, 27% of global measles deaths still occurred in the WHO SEAR in 2018.Citation1 The “big six” countries (comprised of Bangladesh, India, Indonesia, Myanmar, Nepal, and Thailand), so-called because they constitute 95% of the population of the WHO SEAR, remain endemic for measles.Citation3
Measles can be inexpensively and safely prevented through the utilization of vaccinations. From 2000 to 2018, measles vaccinations prevented an estimated 23.2 million deaths globally.Citation1 The WHO SEAR recorded the highest growth in measles-containing-vaccine first-dose (MCV1) coverage in all six regions, increasing from 63% in 2000 to 89% in 2018.Citation1 However, substantial between-country inequalities are still evident in this area, shown by the fact that these “big six” countries bore 98% of the unvaccinated population of the WHO SEAR.Citation5 In 2018, India and Indonesia were among the six countries (Nigeria, India, Pakistan, Indonesia, Ethiopia, and Philippines) with the highest number of unimmunized infants globally.Citation1 One objective outlined by the Strategic Plan for attaining the aforementioned 2020 WHO SEAR goal is “achieving and maintaining at least 95% population immunity against measles within each district of each country in the region through routine and/or supplementary immunization.”Citation6 Achieving this goal will require the MCV1 coverage to be effectively measured by using population-based household surveys instead of aggregated administrative reports. Furthermore, the Sustainable Development Goal (SDG) 17 calls for data to be disaggregated by “income, gender, age, race, ethnicity, migratory status, disability, geographic location, and other characteristics relevant in national contexts.”Citation7 Geographic, socioeconomic, and nutritional characteristics might all be significant contributing factors to vaccination inequalities. Different determinants of inequalities, such as these factors, can affect vaccination coverage through different pathways and subsequently lead to different magnitudes of inequality for each individual.Citation8 Measuring MCV1 coverage in terms of the multiple relevant aspects of inequality serves to provide a more comprehensive picture of multidimensional immunity gaps, thereby helping to create more effective policies aimed at benefiting the most vulnerable members of the population.Citation9
However, to date, most work in this area emphasizes wealth-related inequality in healthcare service delivery.Citation10 An inequality analysis, using the Demographic and Health Surveys (DHS) surveys conducted from 2005 to 2012, discovered that wealth and education-related MCV1 coverage inequalities existed in Bangladesh, India, Indonesia, and Nepal.Citation10 However, MCV1 coverage and its relevant inequalities have not been systematically examined using the latest DHS that was conducted in the past 3–5 y in those same countries, with these estimates from Bangladesh, Myanmar, and Thailand were rarer. In addition, geographically heterogeneous vaccination coverage can result in the clustering of unvaccinated individuals and subsequently threaten herd immunity, which may then increase the likelihood of a sustained virus circulation and measles outbreak despite high national vaccine coverage.Citation11 Substantial spatial heterogeneity in measles vaccination coverage has been demonstrated previously in Sub-Saharan Africa,Citation12,Citation13 but spatial patterns of MCV1 coverage in the “big six” countries are still poorly understood. Poorly nourished young children, especially those with insufficient vitamin A levels, are more susceptible to contracting and developing severe measles.Citation14 Their inadequate access to nutrition might serve as a predictor for the presence of related barriers in accessing vaccinations,Citation15 which is another core issue that has not been examined in the “big six” countries.
Our objectives were to assess the magnitude of MCV1 coverage inequalities across geographic, socioeconomic, and nutritional dimensions. Based on this analysis, we identified priority areas for action, as well as population subgroups that require more focused attention. Using these results, we recommend equity-oriented adjustments to current immunization policies that will improve the health and well-being of all population groups.
Methods
Design
We used disaggregated data gained from the DHS and Multiple Indicator Cluster Surveys (MICS). DHS and MICS are both cross-sectional household-based surveys using two-stage cluster sampling. In the first stage, sampling frames were constructed using a preceding national population and housing census, with primary sampling units being selected through the use of probability proportional to size sampling. During the second stage, about 20–30 households within sampled clusters were randomly selected for a standardized, face-to-face interview that collected social, demographic, reproductive, neonatal, childhood, and adolescent-related information from women, men, and other household members. Using similar sampling strategies and standardized questionnaires ensures that the data collected are comparable across countries and over time. All questionnaires were validated through the use of several iterations of pretesting and field surveying.Citation16,Citation17
We selected the aforementioned “big six” countries using available data gained from the DHS and MICS. Appendix A shows the country-wise survey characteristics. We downloaded the most recent dataset for each country from the DHS/MICS website with approval to use the data for further analysis. We downloaded the administrative boundaries data for the “big six” countries as well as their sub-divisions from the Global Administrative Areas (GADM) database.Citation18
Variables
MCV1 coverage was defined as the percentage of children aged 12–23 months who had received the MCV1 at any time before the survey according to either their vaccination card or mother’s report.Citation19
We selected the dimensions related to vaccination inequalities from the framework used for monitoring equity in Gavi-supported countries, which has both widespread applicability and between-country comparability.Citation8 The dimensions included are wealth quintiles, mothers’ education levels, urban/rural residence, child’s gender, and child malnutrition.Citation8 We also selected dimensions of inequality related specifically to the MCV1 vaccination. The number of antenatal care (ANC) visits carried out was reported as a probable basis for determining inequality in the coverage of childhood vaccinations.Citation20 To investigate missing MCV1 vaccinations among children already exposed to any other disease that can cause an increase in the case-fatality rate of measles, such as vitamin A deficiency (VAD),Citation14 the application of vitamin A supplementation (VAS) was also selected as a dimension of inequality.
In the survey data, participants’ asset scores were based on their ownership of durable assets, housing characteristics, and access to services. This asset score was then calculated through the use of a principal component analysis on the information provided by respondents. Based on the asset score of each respondent, the whole sample was divided into five wealth quintiles, arranged from poorest to richest. Maternal education was categorized into four levels based on the highest education level of the mother and was grouped as follows: no education, primary, secondary, and higher education. Participants were also grouped into five levels according to their number of ANC visits as follows: no visit, one visit, two visits, three visits, and at least four visits. The child’s gender, urban/rural residence, and the specific district of their residence were taken directly from the DHS and MICS data. VAS was considered received if the caregiver reported that the child had received a dose of vitamin A in the 6 months preceding their survey interview date. We selected stunting and wasting as two indicators of malnutrition, which were also used as proxies for both the chronic and acute forms of nutritional deficiencies.Citation21 A child is identified as stunted if their height-for-age Z-score is below minus two standard deviations (−2 SD) of the median height identified for their age according to the WHO standard. Similarly, a child is identified as wasted if their weight-for-height Z-score is below minus two standard deviations (−2 SD) of the median weight identified for people at their height by the WHO standard.Citation22
Statistical analysis
We plotted the national MCV1 coverage, with the district-level MCV1 coverages being additionally mapped for improved visualization. The presence of significant spatial autocorrelations of the district-level MCV1 coverages was assessed using the Moran’s I test in ArcGIS version 10.7.Citation23 Spatial clustering of districts with a low MCV1 coverage was detected utilizing the Bernoulli probability model using SaTScan version 9.6.Citation24 Clusters of districts with similar socioeconomic status (SES) and MCV1 coverages were identified through using a k-means analysis.Citation25 The variables used to create clusters in the k-means analysis were the standardized values of district-level MCV1 coverages and district-level proportions of children aged 12–23 months who were from households lying in the top three wealth quintiles, whose mothers had attended secondary school or higher, and whose mothers had received ANC four or more times during their pregnancy. The thresholds set for the above sociodemographic characteristics were consistent with the requirements stated by the specific SDG goals aimed at ending poverty and ensuring access to both education and ANC.Citation7,Citation26,Citation27 The optimal number of clusters was selected using gap statistics and within-group sum of squares.Citation28
We examined both the absolute and relative MCV1 coverage inequalities along the socioeconomic and nutritional dimensions to reveal a holistic picture of the relevant disparities in these areas.Citation29 Relative inequality was estimated using the concentration index (CIX), which quantified these inequalities with an index range from −1 to 1 and intuitively showed the differences in the degree of inequality across both dimensions and countries. CIX is defined as twice the area between the concentration curve and the 45° line of equality.Citation30 This study used a CIX with Erreygers correction (i.e., the Erreygers Concentration Index [ECI]), which was modified specifically for the bounded health outcomes, including binary indicators such as immunization coverage.Citation31 Absolute inequality highlights the actual MCV1 coverage gap that exists between the highest and lowest values of the socioeconomic indicator rank and thus gives an indication of the appropriate efforts needed to close it. For dimensions with only two subgroups (i.e., child gender, residence, VAS, and malnutrition), pairwise comparisons were conducted in the absolute scale by subtracting the MCV1 coverage for the disadvantaged subgroup from that of the advantaged subgroup using lincom post-estimation commands in Stata.Citation30 For indicators in multiple-ordered subgroups, including wealth quintiles, mothers’ education levels, and the number of ANC visits, we conducted whole spectrum comparisons in the absolute scale by calculating the slope index of inequality (SII). The SII was created by assigning each child a continuous rank weighted by their social group proportions for each dimension and using logistic regression models to estimate the association between each child’s relative rank and their individual measles vaccination outcome. We calculated the absolute differences in the probabilities of children aged 12–23 months receiving MCV1 at the extremes of the ranks for each dimension as predicted by the margins command in Stata.Citation29,Citation32 In the multivariate analysis, for each dimension of inequality, we added the other seven variables to the regression model used to estimate the SII. For each indicator in multiple-ordered subgroups, we included their ranks that were used to calculate the SII in the model.Citation33,Citation34 Only children without any missing information were included in the model for each dimension. In addition, based on the study design, the analysis considered the cluster and sample strata statements in order to estimate the standard errors. A p-value of 0.05 was considered as significant, with all analyses being conducted in Stata version 14.0.
Results
Our data were derived using the latest DHS or MICS conducted between 2014 and 2017 in the specified “big six” countries. The weighted number of children aged 12–23 months in Bangladesh, India, Indonesia, Myanmar, Nepal, and Thailand were 1633, 47839, 3399, 852, 1034, and 2137, respectively. Other survey characteristics, including the number of sampled clusters and households, are presented in Appendix A. Characteristics related to the vulnerability and inequality of study participants are presented in Appendix B.
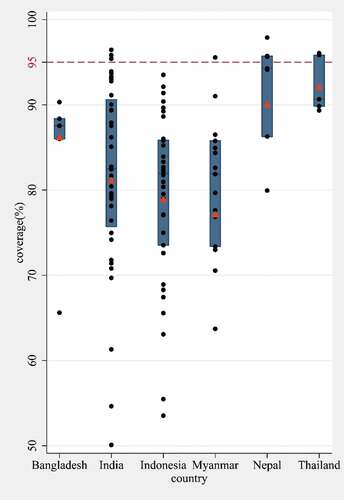
There are currently substantial gaps between the 2020 goal and the actual MCV1 coverage in all of the “big six” countries, both at the national and sub-national levels (). The estimated national coverage, according to both the DHS and MICS was lower than the 2020 goal in all six countries, ranging from 77.1% in Myanmar to 92.0% in Thailand. Out of all the included countries, nine districts met the 2020 target of achieving 95% MCV1 coverage at the sub-national level. Regarding the between-country observations, the average percentages of districts with more than 95% MCV1 coverage were above 40% in Nepal and Thailand; however, no districts had reportedly reached 95% coverage in either Bangladesh or Indonesia. Regarding the within-country findings, sub-national MCV1 coverage varied by more than 20% in four of the six countries (Appendix C). Notably, the countries with the largest sub-national absolute inequalities in MCV1 coverage were those with the lowest national MCV1 coverage overall – namely India, Indonesia, and Myanmar.
Figure 1. Distribution of MCV1 coverage at the district level for the “big six” countries in the WHO SEAR. Each dot displays the MCV1 coverage in second administrative units for each country. The box portion of the plot is defined by the upper lines at the 25th percentile, the middle lines at the 50th percentile, and the lower lines at 75th percentile. WHO and UNICEF estimates of MCV1 coverage are shown as red triangles.
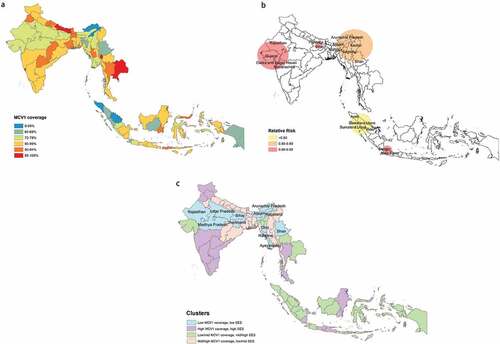
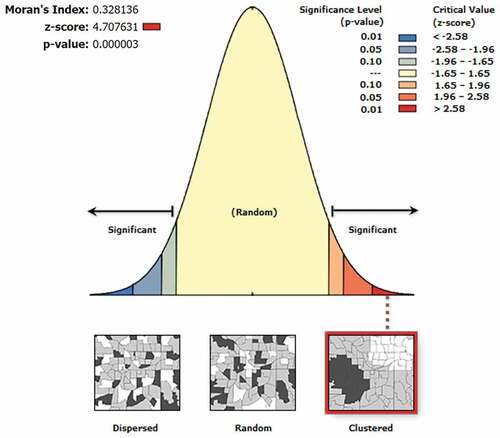
Spatial heterogeneity in MCV1 vaccination coverage can be found across all six of the included countries ()). The global spatial autocorrelation analysis revealed a clustering pattern of low MCV1 coverage across all six countries (Appendix D). The largest area with a clustering of low MCV1 coverage spanned across northeast India (including Arunachal Pradesh, Manipur, and Nagaland), northern Myanmar (including Sagaing, Shan, and Kachin), and Sylhet in Bangladesh ()). The ratio of the probability of receiving MCV1 within this area to that of receiving MCV1 outside of it comes to 0.85 (RR = 0.85, p < .001). The other two clusters were mainly located in Gujarat and Bihar. In Indonesia, low-coverage clusters were detected in the northern region of Sumatra Island and the western region of Java Island. The four clusters identified based on SES and MCV1 coverage were low MCV1 coverage, low SES; high MCV1 coverage, high SES; low to middle MCV1 coverage, middle to high SES; and middle to high MCV1 coverage, low to middle SES ()). The sociodemographic characteristics of the centers of each cluster of districts are presented in Appendix E. Districts within the “low MCV1 coverage, low SES” cluster were mainly distributed in a continuous band, stretching from the northwest to the northeast of India. This cluster also contained Chin, Rakhine, Ayeyarwady, and Shan in Myanmar.
Figure 2. MCV1 coverage at the district level, spatial clustering of low MCV1 coverage, and clusters based on both socioeconomic status (SES) and MCV1 coverage for in the “big six” countries in the WHO SEAR. (a) The district-level MCV1 coverage. (b) Using the Kulldorff’s statistic, we identified the low-coverage clusters and classified them by the relative risk, i.e., the ratio of the probability of receiving MCV1 inside the cluster to that outside the cluster. (c) Using the k-means analysis, we identified clusters with similar SES and MCV1 coverage.
We found significant socioeconomic and nutrition-related inequalities in MCV1 coverage between the most and least vulnerable children, both absolute and relative, in all countries except Thailand. On the relative scale, MCV1 coverage inequalities were uneven across all countries and dimensions (). In Bangladesh, the wealth quintiles and mothers’ education levels were predominant sources of MCV1 coverage inequalities. In India, Myanmar, and Nepal, ANC-related inequalities were found to be conspicuous.
Table 1. Inequality in MCV1 coverage quantified by Erreygers concentration index.
On the absolute scale, the results of the univariate analysis are shown in Appendix F. There were narrower MCV1 coverage inequalities found for all dimensions in the multivariate analysis (). The heaviest burdens due to wealth- and education-related inequality were borne by Bangladesh and Indonesia, respectively. Evident gaps in the MCV1 coverage between the children of mothers with at least four ANC visits and those of mothers with no prior ANC visits were found in Indonesia, Myanmar, and Nepal. MCV1 coverage was 24-percentage points higher among children who had received VAS in the 6 months preceding their survey interview date when compared to those who had missed it in both Indonesia and Myanmar. Gender-related inequality in India, rural-urban inequalities in India and Bangladesh, and malnutrition-related inequalities in India and Myanmar were all found to be significant, but substantially lower.
Table 2. Inequality in MCV1 coverage quantified by whole spectrum comparisons (for wealth index, mother’s education, and antenatal care visits) and pairwise comparisons (for child’s gender, residence, VAS, and malnutrition) conducted in the absolute scale, adjusted for sociodemographic factors.
Discussion
Our results are based on the latest disaggregated data gained from both the DHS and MICS, which enabled an update of the gap between the WHO 2020 goal and the current status quo, as well as a detailed examination of MCV1 coverage in specific sub-national districts and population groups. Between-country MCV1 coverage inequality was noted in the WHO SEAR. Compared to the four member-states that have already eliminated measles, the 2020 goal of at least 95% coverage in each district of each country was not met by any of the “big six” countries. Within-country inequalities varied according to each nation. More than half of the districts that had achieved 95% coverage were located in Nepal and Thailand, with these also being the two countries with the narrowest geographical gaps in MCV1 coverage. In the other four countries, marked geographic inequalities remained. The spatial scan statistics detected a total of five statistically significant clusters of districts with low MCV1 coverage. There were also clear clusters of districts with similar MCV1 coverage and SES throughout the “big six” countries. Wealth, education, and ANC-related inequalities were more pronounced than those based on gender and urban/rural residence, and were present existed in all countries except Thailand. Children exposed simultaneously to the risks of VAD and measles (who were found in all countries with available data) deserve special attention from both researchers and policymakers.
The geographic identification of clusters with low MCV1 coverage would facilitate the identification of population members more susceptible to outbreaks – this is crucial, as these clusters of low coverage can weaken the overall herd immunity of each country. Districts that were in the “low MCV1 coverage, low SES” cluster were also those facing the most severe issues of societal inequalities. Sustainable financing and additional resources aimed at the promotion of campaigns and interventions to increase access to basic healthcare services should be allocated specifically to these areas. Brief interventions providing mothers, on a face-to-face basis, with information on the benefits of the tetanus vaccine through home visits were found to be effective in increasing diphtheria-pertussis-tetanus (DPT) vaccine coverage in Uttar Pradesh – a district found in the “low MCV1 coverage, low SES” cluster.Citation35
Locally designed and evidence-based interventions targeting low-income or ethnically diverse populations were effective in both the improvement of vaccination coverage and the elimination of relevant inequalities.Citation36 Conversely, indiscriminate interventions may improve the entire population’s overall healthcare but may also maintain or even widen health inequalities between deprived and affluent groups.Citation37 The gradient pattern for MCV1 coverage formed by different the various included dimensions differed across the included countries, signifying a need for different and specialized approaches to increase MCV1 coverage among disadvantaged groups. Wealth and education constituted important sources of MCV1 coverage inequalities in Bangladesh. In India, Indonesia, and Myanmar, the main reason for MCV1 coverage inequalities might be related to the number of maternal ANC visits. MCV1 was introduced into the national immunization programs of all the “big six” countries, with these programs remaining free of charge.Citation6 Therefore, being of a higher economic status might reflect maternal empowerment, which then leads to healthier lifestyle choices, including decisions around vaccine uptake.Citation38 The number of ANC visits represents the acceptance of and adherence to healthcare services. Higher ANC visit frequencies might also be a reflection of a person’s level of healthcare education and an increased awareness of the importance of vaccinations, which they would learn about during visits.Citation20 Therefore, investment in health promotion strategies, especially those aimed at women without access to education and displaying a lack of ANC visits, is fundamental in increasing overall MCV1 uptake. We found no inequalities in MCV1 coverage by child gender in most countries, which has been corroborated by previous publications.Citation8,Citation39 India, the only country where gender-related inequality remained,Citation40 needs to strengthen its gender justice, especially that targeting girl’s rights in terms of access to basic healthcare services.
To the best of our knowledge, this is the first application of a healthcare inequalities assessment to nutrition-related vaccination coverage inequalities. In 2013, the prevalence of VAD in the WHO SEAR was 36% (95% CI 9%-67%), accounting for 10.4% (95% CI 1.8%–23.2%) of all deaths due to measles among children aged younger than 5 y in this region.Citation14 As a result, VAS is the best strategy to control VAD and prevent diseases and deaths attributable to VAD among children aged six to 59 months. All of the “big six” countries, except Thailand, are priority nations for VAS where increased national VAS programs are recommended.Citation41 However, groups of people who missed both the VAS and MCV1, and who are therefore at a doubled risk of contracting VAD and measles, existed in all of the priority countries, especially Myanmar and Indonesia. The simultaneous administration of VAS and MCV1 to a child aged 9 months leads to increased measles-specific antibody concentrations at the age of 18 months and again at 6 to 8 y.Citation42,Citation43 Sierra Leone conducted a twice-yearly nationwide Maternal and Child Health Week, providing integrated services that offer both VAS and measles vaccinations for all children aged six to 59 months.Citation44 This method has been shown to help improve the coverage of both styles of healthcare interventions.Citation44 Combining interventions, including ANC, MCV1, and VAS, may then lead to synergistic healthcare benefits in all of the “big six” countries.
For the dimensions of inequality containing multiple ordered categories (i.e., wealth quintiles, mother’s education levels, and numbers of ANC visits), we compared the results obtained from both the relative (ECI) and absolute (SII) inequity measures. Most of the conclusions revealed by these two measures were consistent, except for the increase in the magnitude of ANC-related inequalities when compared to those along other dimensions in absolute measures in Indonesia and Thailand. It is worth noting that the ECI is sensitive to changes in the distribution of the population across different socioeconomic categories.Citation45 Therefore, the small ANC-related inequality in Indonesia and Thailand quantified by ECI needs to be interpreted with care, for a considerable proportion of mothers of children aged 12–23 months (91.4% in Indonesia and 95.6% in Thailand) accessed at least four ANC visits (Appendix B). SII does not have this disadvantage and provides a more reliable estimate of ANC-related inequality. Furthermore, the multivariate analysis considering the effects of the other sociodemographic and nutritional sources of inequalities in the model functioned to reduce the overestimation of these inequalities. A significant proportion of the absolute wealth-related inequalities in both Indonesia and Myanmar is explained by other sociodemographic variables. Education and ANC-related inequalities remained after an adjustment for all covariates were conducted. Efforts aimed at equitable immunization coverage should thus pivot from monitoring coverages in different economic strata to guaranteeing high MCV1 coverages for children of mothers with lower education levels and/or less frequent ANC visits in these two countries.
The survey data and analysis methods are subject to several limitations. First, the DHS and MICS are typically conducted every 5 y and are thus not able to provide real-time data, making the initiation of timely actions difficult. Second, respondent recall biases in an unknown direction may be significant, particularly because we considered both the children’s vaccination cards and their mothers’ recall as reliable sources of vaccination information. Third, both DHS and MICS collected information on vaccination coverage for children who were alive at the time of the survey, and the response rate ranged from 95.8% in Myanmar to 98.4% in Thailand (Appendix A). Therefore, the unavailability of information on children who died before the survey and nonrespondents may also be a source of bias. Fourth, the Thailand MICS 2015–2016 only produced estimates at the national level and only for five regions (Bangkok, Central, North, Northeast, and South) of the country, but cannot provide high-resolution details on local performances.
In conclusion, the MCV1 coverage was not on track to achieve the ambitious 2020 goal outlined for the “big six” countries. Geographic inequalities persisted, not only within each of these countries, but also across national borders. Economic status, mothers’ education levels, and access to healthcare services prior to receiving the MCV1 vaccination were all important sources of inequalities, notably in Bangladesh, India, Indonesia, and Myanmar. Equity-oriented and context-appropriate programs, such as precise supplementary immunization activities targeting vulnerable districts and the integration of VAS and MCV1, are required to achieve the WHO’s 2020 goal, with the SDG that seeking to ensure eventual universal access to the essential healthcare benefits of vaccinations. Care must be taken in that, when applying policies and interventions aimed at specific disadvantaged groups, the gaps between them and other smaller groups are not inadvertently widened. As such, strategies focusing simultaneously on multiple disadvantaged groups need also be considered when one is aiming to improve the healthcare disadvantage people.
Disclosure of potential conflict of interest
All authors approved the final manuscript as submitted and had complete access to the study data that support the publication. This manuscript, including data and tables, has not been published elsewhere in whole or part, and is not under review for publication elsewhere. There is no conflict of interest that could inappropriately influence (bias) our work.
References
- Patel MK, Dumolard L, Nedelec Y, Sodha SV, Steulet C, Gacic-Dobo M, Kretsinger K, McFarland J, Rota PA, Goodson JL. Progress toward regional measles elimination - Worldwide, 2000-2018. MMWR Morb Mortal Wkly Rep. 2019;68(48):1105–11. doi:10.15585/mmwr.mm6848a1.
- World Health Organization. 2015 Global vaccine action plan 2011–2020; [accessed 2019 May 25]. http://www.who.int/immunization/global_vaccine_action_plan/GVAP_doc_2011_2020/en/.
- World Health Organization Regional Office for South-East Asia. WHO South-East Asia Regional Immunization Technical Advisory Group (SEAR-ITAG): Report of the Ninth Meeting; 2018 July 17–20; New Delhi, India. [accessed 2019 June 10]. http://www.who.int/iris/handle/10665/277458.
- World Health Organization Regional Office for South-East Asia. DPR Korea, Timor-Leste eliminate measles, six countries in WHO South-East Asia achieve rubella control. [accessed 2019 June 10]. http://www.searo.who.int/mediacentre/releases/2018/1693/en/.
- World Health Organization Regional Office for South-East Asia. Lessons from the Big Six – closing the immunity gap for measles elimination and rubella/CRS control. New Delhi (India); 2018.
- World Health Organization Regional Office for South-East Asia. Strategic plan for measles elimination and rubella and congenital rubella syndrome control in the South-East Asia region, 2014–2020. WHO Regional Office for South-East Asia; 2015.
- United Nations. Sustainable Development Goals; 2015 [accessed 2019 May 25]. https://sustainabledevelopment.un.org/sdgs.
- Arsenault C, Harper S, Nandi A, Mendoza Rodríguez JM, Hansen PM, Johri M. Monitoring equity in vaccination coverage: A systematic analysis of demographic and health surveys from 45 Gavi-supported countries. Vaccine. 2017;35(6):951–59. doi:10.1016/j.vaccine.2016.12.041.
- Hosseinpoor AR, Bergen N, Schlotheuber A, Grove J. Measuring health inequalities in the context of sustainable development goals. Bull World Health Organ. 2018;96(9):654–59. doi:10.2471/BLT.18.210401.
- Arsenault C, Harper S, Nandi A, Rodriguez JM, Hansen PM, Johri M. An equity dashboard to monitor vaccination coverage. Bull World Health Organ. 2017;95(2):128–34. doi:10.2471/BLT.16.178079.
- Takahashi S, Metcalf CJE, Ferrari MJ, Tatem AJ, Lessler J. The geography of measles vaccination in the African Great Lakes region. Nat Commun. 2017;8(1):15585. doi:10.1038/ncomms15585.
- Brownwright TK, Dodson ZM, van Panhuis WG. Spatial clustering of measles vaccination coverage among children in sub-Saharan Africa. BMC Public Health. 2017;17(1):957. doi:10.1186/s12889-017-4961-9.
- Takahashi S, Metcalf CJE, Ferrari MJ, Tatem AJ, Lessler J. The geography of measles vaccination in the African Great Lakes region. Nat Commun. 2017;8(1):15585. doi:10.1038/ncomms15585.
- Stevens GA, Bennett JE, Hennocq Q, Lu Y, De-Regil LM, Rogers L, Danaei G, Li G, White RA. Flaxman SR and others. Trends and mortality effects of vitamin A deficiency in children in 138 low-income and middle-income countries between 1991 and 2013: a pooled analysis of population-based surveys. Lancet Glob Health. 2015;3(9):e528–36. doi:10.1016/S2214-109X(15)00039-X.
- Upadhyay RP, Chowdhury R, Mazumder S, Taneja S, Sinha B, Martines J, Bahl R, Bhandari N, Bhan MK. Immunization practices in low birth weight infants from rural Haryana, India: findings from secondary data analysis. J Glob Health. 2017;7(2):020415. doi:10.7189/jogh.07.020415.
- UNICEF. Multiple Indicator Cluster Survey (MICS); 2019 [accessed 2019 June 10]. http://mics.unicef.org.
- USAID. The Demographic and Health Surveys (DHS) Program; 2019 [accessed 2019 June 10]. https://www.dhsprogram.com/.
- Global Administrative Areas. GADM database of global administrative areas. [accessed 2019 Nov 28]. http://www.gadm.org/.
- Croft TN, Allen CK, Marshall AMJ. Guide to DHS Statistics. Rockville (Maryland, USA); 2018.
- Tsehay AK, Worku GT, Alemu YM. Determinants of BCG vaccination coverage in Ethiopia: a cross-sectional survey. BMJ Open. 2019;9(2):e023634. doi:10.1136/bmjopen-2018-023634.
- Richard SA, Black RE, Gilman RH, Guerrant RL, Kang G, Lanata CF, Mølbak K, Rasmussen ZA, Sack RB, Valentiner-Branth P. Valentiner-Branth P and others. Wasting is associated with stunting in early childhood. J Nutr. 2012;142(7):1291–96. doi:10.3945/jn.111.154922.
- WHO Multicentre Growth Reference Study Group. WHO Child Growth Standards: length/height-for-age, weight-for-age, weight-for-length, weight-for-height and body mass index-for-age: methods and development. Geneva (Switzerland): World Health Organization; 2006.
- Anselin L, Getis A. Spatial statistical analysis and geographic information systems. 1992;26(1):19–33.
- Kulldorff M. A spatial scan statistic. Commun Statist - Theor Methods. 1997;26(6):1481–96. doi:10.1080/03610929708831995.
- Wallace M, Sharfstein JM, Kaminsky J, Lessler J. Comparison of US county-level public health performance rankings with county cluster and national rankings: assessment based on prevalence rates of smoking and obesity and motor vehicle crash death rates. JAMA Network Open. 2019;2(1):e186816–e186816. doi:10.1001/jamanetworkopen.2018.6816.
- World Health Organization. World Health Statistics 2016: monitoring health for the SDGs. Geneva; 2016.
- Emerson E, Savage A, Llewellyn G. Significant cognitive delay among 3- to 4-year old children in low- and middle-income countries: prevalence estimates and potential impact of preventative interventions. Int J Epidemiol. 2018;47(5):1465–74. doi:10.1093/ije/dyy161.
- Tibshirani R, Walther G, Hastie T. Estimating the number of clusters in a data set via the gap statistic. J Royal Statist Soc Ser B. 2001;63:411–23. doi:10.1111/1467-9868.00293.
- Barros AJD, Victora CG. Measuring coverage in MNCH: determining and interpreting inequalities in coverage of maternal, newborn, and child health interventions. PLoS Med. 2013;10(5):e1001390–e1001390. doi:10.1371/journal.pmed.1001390.
- World Health Organization. Handbook on health inequality monitoring: with a special focus on low- and middle-income countries. Geneva: WHO; 2013.
- Erreygers G. Correcting the Concentration Index. J Health Econ. 2009;28(2):504–15. doi:10.1016/j.jhealeco.2008.02.003.
- Torsheim T, Nygren JM, Rasmussen M, Arnarsson AM, Bendtsen P, Schnohr CW, Nielsen L, Nyholm M. Social inequalities in self-rated health: A comparative cross-national study among 32,560 Nordic adolescents. Scand J Public Health. 2018;46(1):150–56. doi:10.1177/1403494817734733.
- Lohela TJ, Nesbitt RC, Pekkanen J, Gabrysch S. Comparing socioeconomic inequalities between early neonatal mortality and facility delivery: cross-sectional data from 72 low- and middle-income countries. Sci Rep. 2019;9(1):9786–9786. doi:10.1038/s41598-019-45148-5.
- Arsenault C, Jordan K, Lee D, Dinsa G, Manzi F, Marchant T, Kruk ME. Equity in antenatal care quality: an analysis of 91 national household surveys. Lancet Glob Health. 2018;6(11):e1186–e1195. doi:10.1016/S2214-109X(18)30389-9.
- Powell-Jackson T, Fabbri C, Dutt V, Tougher S, Singh K. Effect and cost-effectiveness of educating mothers about childhood DPT vaccination on immunisation uptake, knowledge, and perceptions in Uttar Pradesh, India: A randomised controlled trial. PLoS Med. 2018;15(3):e1002519. doi:10.1371/journal.pmed.1002519.
- Crocker-Buque T, Edelstein M, Mounier-Jack S. Interventions to reduce inequalities in vaccine uptake in children and adolescents aged <19 years: a systematic review. J Epidemiol Community Health. 2017;71(1):87–97. doi:10.1136/jech-2016-207572.
- Reading R, Colver A, Openshaw S, Jarvis S. Do interventions that improve immunisation uptake also reduce social inequalities in uptake? BMJ. 1994;308(6937):1142. doi:10.1136/bmj.308.6937.1142.
- Forshaw J, Gerver SM, Gill M, Cooper E, Manikam L, Ward H. The global effect of maternal education on complete childhood vaccination: a systematic review and meta-analysis. BMC Infect Dis. 2017;17(1):801. doi:10.1186/s12879-017-2890-y.
- Restrepo-Méndez MC, Barros AJ, Wong KL, Johnson HL, Pariyo G, França GV, Wehrmeister FC, Victora CG. Inequalities in full immunization coverage: trends in low- and middle-income countries. Bull World Health Organ. 2016;94(11):794–805b. doi:10.2471/BLT.15.162172.
- Shrivastwa N, Wagner AL, Boulton ML. Analysis of state-specific differences in childhood vaccination coverage in rural India. Vaccines (Basel). 2019;7(1). doi:10.3390/vaccines7030071.
- UNICEF DATA. Vitamin A Deficiency in Children; 2019 [accessed 2019 Jul 9]. https://data.unicef.org/topic/nutrition/vitamin-a-deficiency/.
- Benn CS, Aaby P, Bale C, Olsen J, Michaelsen KF, George E, Whittle H. Randomised trial of effect of vitamin A supplementation on antibody response to measles vaccine in Guinea-Bissau, west Africa. Lancet. 1997;350(9071):101–05. doi:10.1016/S0140-6736(96)12019-5.
- Benn CS, Balde A, George E, Kidd M, Whittle H, Lisse IM, Aaby P. Effect of vitamin A supplementation on measles-specific antibody levels in Guinea-Bissau. Lancet. 2002;359(9314):1313–14. doi:10.1016/S0140-6736(02)08274-0.
- Sesay FF, Hodges MH, Kamara HI, Turay M, Wolfe A, Samba TT, Koroma AS, Kamara W, Fall A, Mitula P. Mitula P and others. High coverage of vitamin A supplementation and measles vaccination during an integrated maternal and child health week in Sierra Leone. Int Health. 2015;7(1):26–31. doi:10.1093/inthealth/ihu073.
- Regidor E. Measures of health inequalities: part 2. J Epidemiol Community Health. 2004;58(11):900–03. doi:10.1136/jech.2004.023036.
Appendices
Appendix A. Survey characteristics of the “big six” countries in the WHO SEAR
Appendix B.
Characteristics of study participants
Appendix C.
District-level MCV1 coverage and sociodemographic characteristics of the “big six” countries in the WHO SEAR
Appendix D.
Spatial autocorrelation based on the district-level MCV1 coverage for the “big six” countries in the WHO SEAR using the Global Moran’s I statistic.
The spatial patterns of the district-level MCV1 coverage can be clustered (Moran’s I value close +1), dispersed (Moran’s I value close −1), or randomly distributed (Moran’s I index value zero). Given the z-score of 4.707631, there is a less than 1% likelihood that this clustered pattern could be the result of random chance.
Appendix E Sociodemographic characteristics of the cluster centers