
 ?Mathematical formulae have been encoded as MathML and are displayed in this HTML version using MathJax in order to improve their display. Uncheck the box to turn MathJax off. This feature requires Javascript. Click on a formula to zoom.
ABSTRACT
Introduction
To deliver specific antigens in tumor immunotherapy, tumor cell lysates are commonly used to sensitize dendritic cells (DCs). However, the lysates possess low immunogenicity and contain many types of non-tumor-related antigens, which may induce autoimmune diseases. Tumor antigen peptides can provide high specificity but are expensive and their short half-lives limit their clinical application.
Methods
In this study, we used adenovirus to transfer the carbonic anhydrase IX (CA9) gene into DCs to generate specificity to renal cell carcinoma (RCC) which is the most common space-occupying lesion in humans. Inhibition of antigen presentation attenuators (iAPA) technology was also used to enhance the DC delivery capacity. Finally, DCs were co-cultured with cytotoxic T-lymphocytes (CTLs) and the anti-tumor effects were evaluated.
Results
The results showed that the CA9-DC-CTLs possessed a high specificity to CA9-positive cells and showed stronger anti-tumor activity than GFP-DC-CTLs both in vitro and in vivo.
Discussion
These findings may suggest a novel treatment option for RCC.
Introduction
Renal cell carcinoma (RCC) is the most common space-occupying lesion in humans and its incidence is increasing by 1.5% to 5.9% each year.Citation1 To date, surgical resection is the most effective treatment for RCC, but 20–40% of the patients experience recurrences after surgery.Citation2 Furthermore, some patients present with advanced-stage disease or distal metastasis at the initial diagnosis and RCC has multiple resistance genes that render it insensitive to radiotherapy and chemotherapy. The poor survival rate (median survival time <12 months, 5-y survival <10%) of patients with RCC is contributed by these factors.Citation3 New targeted agents, such as Sunitinib, Sorafenib, Temsirolimus, and Bevacizumab, have been developed and are used as first-line therapy in many clinical centers.Citation4 However, all of these are palliative treatments and rarely produce durable complete remissions. Immunotherapy with agents such as IL-2 and IFN-α is an effective treatment for RCC.Citation5 However, these cytokine therapies are associated with serious liver and kidney toxicity. Extensive literatures have reported that adoptive immune cell therapy is a new technique being used after cytokine therapy. Xiubao Ren et al. evaluated the effects of CIK cell therapy compared with cytokine therapy in RCC and reported positive survival results (n = 148, progression-free survival (PFS): 12 vs. 8 months, overall survival (OS): 46 vs. 19 months).Citation6
The effect of traditional cell therapy is limited by low antigen specificity. Therefore, dendritic cells (DCs) are usually used in combination. Tumor cell lysates are most widely used to sensitize DCs but also have some limitations. They cannot provide enough antigen specificity and non-tumor-associated antigens may induce autoimmune diseases. In contrast, although single-antigen-sensitized DCs are effective, the high cost and short half-life limit their application. Then, the inhibition of antigen-presentation attenuator (iAPA) technology emerged.Citation7 It utilizes siRNA to specifically block negative immune regulatory factors in the DCs via an adenovirus while combining tumor-specific antigens with specific cytotoxic T-lymphocytes (CTL). The significance of iAPA-DC-CTLs lies in the effective enhancement of the targeting ability of the CTLs, thus avoiding damage to autologous cells.Citation8
Suppressor Of Cytokine Signaling 1 (SOCS1) is a negative immune regulatory gene that is generally silenced to enhance the effectiveness of DC vaccines.Citation9 Although inhibition of SOCS1 contributes to break self-tolerance, SOCS1 inhibitors alone are insufficient to activate DCs. Flagellin polypeptides as proinflammatory stimulants are additionally required to initiate the proinflammatory signaling cascade. Carbonic anhydrase IX (CA9) is a glycoprotein which has extensively been investigated in RCCsCitation10 and a high percentage of these tumors (up to 94%) express CA9.Citation11 The fact that CA9 is not detectable in normal kidney tissue and other normal tissues suggests that the expression level of CA9 can be used as a tumor marker of RCC.Citation12,Citation13
In this study, we used a replication-defective adenovirus as a vector to down-regulate the expression of the SOCS1 gene and transfer CA9 and S-Flagellin into DCs. We also explored the specificity and tumor cytotoxicity of CA9-DC-CTL in vitro and in vivo.
Materials and methods
Materials
Cord blood was donated by the Shandong Cell-Tissue Bank for research purposes, 293 FT was purchased from the China Center for Type Culture Collection (CCTCC). Recombinant adenovirus was purchased from Vigene Biosciences, Inc (Jinan, China). Lymphocyte serum-free KBM581 medium (88–581-CM) was purchased from Corning Life Science Co., Ltd. (Jiangsu, China). Dendritic cell culture factor (88–581-CM) and dendritic cell maturation factor (GMP-1806) were purchased from Novoprotein Scientific Inc (Shanghai, China). A*2402/EYRALQLHL-APC (WF2655-APC), the carbonic anhydrase-specific MHCI dextramer, was purchased from IMMUDEX (Fruebjergvej, Denmark). Anti-CA9-antibody-PE (MBS603443) was purchased from MyBiosource (San Diego, CA, USA). Anti-CD11c-antibody-FITC (301603), anti-CD11c-antibody-PE (337205) anti-CD3-antibody-FITC (300305), anti-CD8-antibody-PE (344705), anti-CD4-antibody-PE (357403), and anti-CD56-antibody-PE (362507) were purchased from Biolegend (San Diego, CA, USA). PE Mouse Anti-Human CD11c (555392), FITC Mouse Anti-Human CD80 (557226), FITC Mouse Anti-Human CD83 (556910), FITC Mouse Anti-Human CD86 (555657), FITC Mouse IgG2a, k Isotype Control, PE Mouse IgG1, k Isotype Control, APC Mouse Anti-Human IFNγ, APC Mouse Anti-Human TNF-α, and APC Mouse Anti-Human CD126 were purchased from BD Pharmingen (San Diego, CA, USA). PMA (50601ES02), BFA (50502ES03), Ionomycin (50401ES03) were purchased from YEASEN (Shanghai, China).
Plasmid construction and adenovirus production
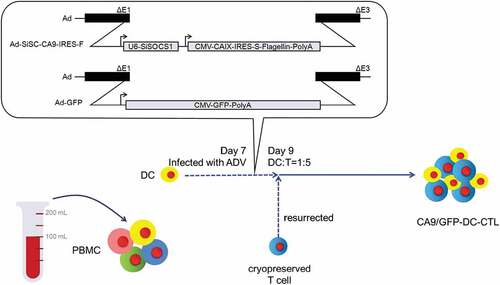
The target gene fragment was constructed according to the method of Si-Yi Chen,Citation5 as shown in . Plasmid construction and adenovirus production were conducted by Vigene Biosciences, Inc. Briefly, the SOCS1 siRNA hairpin sequence was inserted into pHBAdU6CMV-GFP to generate pHBAd-U6-SOCS1 siRNA+SOCS1 siRNA reverse-CMV-GFP. The CA9-IRES-Flagellin-polyA sequence was inserted to replace the GFP sequence to generate the shuttle plasmid pHBAd – U6 – SOCS1 siRNA + SOCS1 siRNA reverse – CMV – CA9 – IRES – S-Flagellin – polyA. The sequence of the RNAi is 5ʹCACGCACTTCCGCACATTC3ʹ.Citation14 All vectors were confirmed by DNA sequencing. The resultant shuttle vectors were co-transformed with the adenoviral backbone plasmid, pBHGlox (delta) E1, 3 Cre, into HEK-293A and concentrated by ultracentrifugation. The recombinant Ad-siSC-CA9-IRES-F adenoviruses were generated at 1.31 × 10¹¹ pfu/mL.
Figure 1. The construction of recombinant adenovirus and the preparation process of the CA9-DC-CTLs. In the diagram of recombinant adenovirus vector, the Ad-SiSC-CA9-IRES-F insertion sequence is constituted by U6 Promotor, SOCS1 siRNA sequence, CMV promoter sequence, CA9 protein, IRES (internal ribosome entry site), s-fagellin sequence, and poly A tail; The Ad-GFP insertion sequence is constituted by CMV launcher, GFP sequence, and poly A tail. To prepare CA9/GFP-DC-CTL, the DCs were firstly isolated from whole blood. After inducing culture for 7 d, the DCs were infected with adenovirus. The CA9/GFP-DCs were obtained after 48 h infection. The CA9/GFP-DC-CTL was then obtained by mixing cultured with T cells in a 1:5 ratio.
Preparation and phenotype of dendritic cells
CB-MNCs were cultured in lymphocyte serum-free KBM581 medium for 2 h, the adherent cells were isolated and served as pre-DCs. The cell suspension was cryopreserved in liquid nitrogen. The DCs were cultured in 2 U/mL of DC culture factor until day 5, then 2 U/mL of DC maturation factor was added and the cells were cultured for 48 h. DC culture factor and DC maturation factor were purchased from Novoprotein Scientific Inc (Shanghai, China). Mature DCs were collected on day 7 and infected with Ad-siSC-CA9-IRES-F and Ad-GFP as a control group at 100 multiplicity of infection (MOI). CD80, CD83, and CD86 were used as membrane-specific markers of mature DCs detected by flow cytometer Guava easyCyte (MERCK Millipore) and analyzed using FlowJo software on day 9. The infection efficiency was evaluated by the expression of CA9.
Preparation and phenotype of CA9-DC-CTL
On day 7, the frozen cells were thawed and cultured in the presence of anti-CD3 antibody (50 ng/mL), anti-CD28 antibody (50 ng/mL), and IL-2 (1000 U/mL). The Ad-siSC-CA9-IRES-F/Ad-GFP-infected DCs were mixed with pre-cultured T-cells at a ratio of 1:10 and cultured in the presence of IL-2 (1000 U/mL). The proliferation and phenotype of CA9-DC-CTL/GFP-DC-CTL were monitored every 3 d ().
Cytokine production assays
The CA9-DC-CTL group and control group were co-cultured with CA9-293 FT cells overnight. PMA (4 μM) was used as an activator, whereas BFA (18 μM) and ionomycin (5 μM) were used as blocking agents to block the release of cytokines for 4 h. Then, the expression of intracellular cytokines IFN-γ, TNF-α, and IL-6 was detected by flow cytometry. The samples of CA9-DC-CTL group and control group were fixed and permed using BD Cytofix/Cytoperm Kit purchased from BD Pharmingen (San Diego, CA, USA) and stained with the intracellular antibodies, APC Mouse Anti-Human IFNγ, APC Mouse Anti-Human TNF-α, and APC Mouse Anti-Human CD126 for 30 min at 4°C. Then the cells were stained with anti-CD3-antibody-FITC used to mark the CTLs. IFN-γ, TNF-α, and IL-6 were detected by flow cytometer Guava easyCyte (MERCK Millipore) and analyzed using FlowJo software.
Immunoblotting analysis
DCs were infected with Ad-siSC-CA9-IRES-F and Ad-GFP adenoviruses. The cells were harvested 48 h later and lysed using RIPA lysis buffer. Lysate (40 µg) was resolved on a 10% SDS-PAGE gel and transferred onto nitrocellulose membrane. Primary antibodies used were SOCS1 antibody (1:500, SOCS1-101AP) and β-actin (1:500, ACTINB-101AP) which were purchased from FabGennix (USA). Secondary HRP-conjugated antibody (1:200, ab6721, Abcam, Cambridge, UK) was used in conjunction with chemiluminescence detection. SOCS-1/actin bands were quantified with ImageQuant software (Molecular Dynamics). The intensity of SOCS1band was normalized to the intensity of actin bands.
Specific detection of CA9-DC-CTL
Dextramer technology (MHC-EYRALQLHL) was used to evaluate the antigenic specificity of the cells. Briefly, MHC dextramer was mixed with cells at room temperature for 10 min, then anti-CD3 antibody was added, followed by an incubation at 2–8 °C for 20 min under an opaque background. The cells were washed twice followed by re-suspension in phosphate-buffered saline (PBS) and finally analyzed by flow cytometry.
CA9-293 FT cells construction
Briefly, for CA9 lentiviral plasmid construction, the CA9 gene fragments were sent for PCR reaction with custom primers (CA9-F:5ʹ-atggctcccctgtgcc-3ʹ; CA9-R: 5ʹ-ggctccagtctcggctac-3ʹ), while the adenovirus shuttle plasmid were used as templates. The CA9 gene fragments were digested and then ligated to modified pLENTI-Blast vector to obtain pLENTI-CA9. To generate CA9-encoding lentivirus, HEK-293 FT-cells were transfected with a mixture of 10 μg of CA9 lentiviral plasmid, 7.5 μg psPAX2 for virus packaging; and 2 μg pLP/VSVG for expression of the virus G glycoprotein. All the plasmids were purchased from Vigene Biosciences, Inc (Jinan, China). Supernatants with the viruses were collected after 48 h transfection. Another set of conventionally cultured HEK293 cells were transfected with the CA9 lentiviruses for 48 h. Positive cells were identified by flow identification after staining of anti-CA9-antibody-PE. The positive clones were then subcloned to get monoclone cell lines by limit dilution. The negative control is CA9-PE stained non-infected HEK293 cells.
Cytotoxicity and cell death
Cytotoxicity was dynamically monitored by a real-time cell analyzer (RTCA), xCELLigence System (Roche Applied Science, Mannheim, Germany), by measuring the electrical impedance across micro-electrodes on the bottom of tissue culture E-plates.Citation15 In brief, CA9-293 FT cells were inoculated into a 16-well plate at a concentration of 1 × 10⁴ cells/100 μL/well and the cells were allowed to completely adhere during a 6–8 h incubation. CA9-DC-CTLs or GFP-DC-CTLs (100 μL) were added to the E-plates according to the set target ratio and monitored by RTCA.
Nude mice bearing 786-o
Nude mice (female, 5-weeks-old) were purchased from Beijing Vital River Laboratory Animal Technology Co., Ltd. Human kidney cancer 786-o cells were used to establish a tumor-bearing mice model. Experimental animals and operation were reviewed by Shandong Academy of Pharmaceutical Sciences with the permit number 2019010. A total of 18 nude mice were used in animal experiments, all of which were raised in IVC cages in SPF-class animal rooms. The mice were divided into three groups, the normal saline control group (n = 6), the GFP-DC-CTL cell treatment group (n = 6), and the CA9-DC-CTL cell treatment group (n = 6). The activities and behaviors of mice were observed every day, and the body weight of each mouse was measured and recorded every 2 d. All mice were euthanized by excess CO2 after 30 d of tumor inoculation. CO2 flow rate was set to 20% of the euthanasia box volume per minute. In brief, the CO2 cylinder and the pressure relief valve were opened, the pressure was adjusted to 0.15 MPa, and the CO2 flow meter was set to 2 L/min. The mouse euthanasia box (10 L) was then filled with CO2. After 5 min, the CO2 inflatable bottle was turned off. Animal death was detected by assessing the heartbeat and touching eyes. Blood-letting was performed for confirmation of death. A 200 μL cell suspension (1 × 10⁷ cells) was subcutaneously transplanted into the right groin. One week after the inoculation, the xenografted tumor grew to a diameter greater than 0.5 cm and the experimental mice were randomly divided into three groups, the normal saline control group (n = 6), the GFP-DC-CTL cell treatment group (n = 6), and the CA9-DC-CTL cell treatment group (n = 6). The spirit, diet, defecation, body weight, and tumor volume of the nude mice were recorded every 2 d. The experiment ended when the animal lost 15–20% of its body weight. At day 30, the nude mice were euthanized by excess CO2 and the tumors were dissected and photographed for recording. The tumor volume was determined based on the following equation:
where V is the volume of the xenografted tumor (mm3), a is the length of the xenografted tumor (mm), b is the width of the xenografted tumor (mm).Citation16
Statistical analyses
The results are presented as mean ± standard deviation (S.D.). In all experiments, statistical comparison of the mean values between two groups was performed with a Student’s T-test, and a one-way ANOVA followed by Tukey’s multiple comparisons test was used to analyze data among three groups. Statistical significance was set at p-values of <0.05. All statistical analyses were conducted with GraphPad 6.0 software (San Diego, CA, USA).
Results
Preparation and identification of CA9-DC-CTL
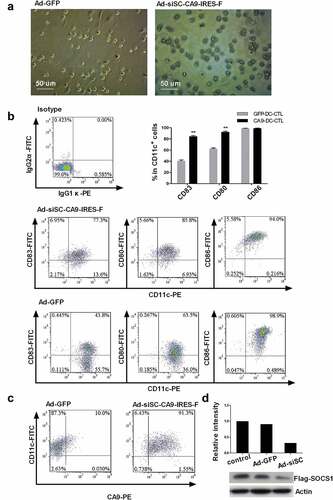
We successfully cultured DCs from the CB-MNCs. The recombinant adenovirus Ad-siSC-CA9-IRES-F vector consisted of siRNA-SOCS1 (siSOCS1), CA9, and flagellin. The recombinant vector and the control group Ad-GFP were transfected into DCs on day 7 (). The purity of the DCs was above 95%, identified by CD11c+ positivity. As shown in , the Ad-siSC-CA9-IRES-F-infected matured DCs (CD83+) accounted for about 77% of all the CD83+ DCs. The costimulatory molecules CD80 and CD86 were positively expressed at 85.84 ± 1.38% and 94.03 ± 1.09%, respectively. In contrast, in the control group, the Ad-GFP-infected mature DCs expressed 43.8% ± 1.35% CD83 positivity and 63.5 ± 2.12% CD80 costimulatory molecule positivity. Statistical results showed that there were significant differences in the expression of CD83 (p = .0011) and CD80 (p = .007) between two groups of adenovirus infected DCs. The experiment was replicated four times (n = 4). The expression of each CD molecular group between GFP-DC-CTL group and CA9 -DC-CTL group was analyzed by a Student’s t-test. The adenovirus infection efficiency was determined by detecting the expression of CA9 on the DCs using flow cytometry. Ad-GFP-infected mature DCs expressed 10.02 ± 0.8% CA9 protein positivity, while after Ad-siSC-CA9-IRES-F infection, the expression of CA9 in the DCs significantly increased to 91.37 ± 2.84% (n = 4), indicating that the adenovirus successfully infected the DCs (). The result of inmunoblotting showed that the expression of SOCS1 in DCs was down-regulated about 66.3% after infection with Ad-siSC-CA9-IRES-F quantified with ImageQuant software (Molecular Dynamics) (). After infection with the adenovirus Ad-siSC-CA9-IRES-F, DCs changed in morphology to increase the number and length of dendrites. The phenotype of DCs is more mature, and has CA9 specificity.
Figure 2. Cellular morphology of DCs and the expression levels of CD11c, CD80, CD83, CD86 and ca9 after infection with adenovirus. A. Cellular morphology of DCs infected with adenovirus Ad-siSC-CA9-IRES-F and Ad-GFP. Magnification: 200X. B. After infection with Ad-siSC-CA9-IRES-F, the proportion of DCs which express CD11c+CD80+ and CD11c+CD83+ is increased, while the proportion of DCs which express CD11c+CD86+ was not changed much. The percentage of CD83+ and CD80+ cells in CD11c+ cells showed significant differences between GFP-DC-CTL group and CA9 -DC-CTL group, whereas the percentage of CD86+ cells in CD11c+ cells showed no significant differences analyzed by a Student’s t-test. **p < .01. C. The expression of CA9 at protein level in adenovirus Ad-siSC-CA9-IRES-F infected DCs. The P value indicate the difference of the comparisons between GFP-DC-CTL group and CA9 -DC-CTL group. CA9: carbonic anhydrase IX. D. SOCS1 down-regulation by infected with adenovirus Ad-siSC-CA9-IRES-F.
Phenotype, and proliferation and specificity of CA9-DC-CTL
CTL cells were cultured separately or co-cultured with adenovirus-infected DCs. Flow cytometry was used to analyze the phenotypes of cells and the results are shown in . Compared to the control group, the percentage of CD8+ cells in the CA9-DC-CTLs was slightly decreased (64.67 ± 2.05% vs. 79.67 ± 1.70% in the CA9-DC-CTLs vs. control cells, respectively, on day 15) and the differences were statistically significant (p = .0006, n = 4). The percentage of CD56+ cells increased gradually in each group but there was no significant difference among these groups. The percentage of CD4+ cells decreased over time in the control group, however, it was relatively stable in the CA9-DC-CTL group (33.67 ± 2.49% vs. 12.78 ± 1.80% on day 15 (p = .0013, n = 4). In general, the CA9-DC-CTL group had a higher CD4+/CD8+ ratio than the GFP-DC-CTL group (p = .0002, n = 4) (). We have provided a representative set of flow cytometry plots in the supplementary figure. The data was analyzed by a Student’s t-test between GFP-DC-CTL group and CA9-DC-CTL group. The proportion of CD4+ cells in CA9-DC-CTL cells is increased, while the proportion of CD8+ cells is decreased. The final CD4+/CD8+ ratio is increased, which indicates that when applying CA9-DC-CTL cells in vivo, the body’s immunity may be improved.
Figure 3. Differences in phenotype, specificity, and proliferation of GFP-DC-CTLs and CA9-DC-CTLs. A. Detection of the cellular phenotypes of CD3+ CD4+, CD3+ CD8+, CD3+ CD56 + T-cells and CD4+/CD8+ ratio in GFP-DC-CTLs and CA9-DC-CTLs by flow cytometry. *p < .05, **p < .01. The bars indicate standard deviation (SD). B. Detection of HLA.A*2402/EYRALQLHL dextramer-specific T-cells in the culture system. C. Fold-amplification in the CA9-DC-CTL and control groups. *p < .05, **p < .01. The bars indicate standard deviation (SD). The P value indicate the difference of the comparisons between GFP-DC-CTL group and CA9 -DC-CTL group analyzed by a Student’s t-test.
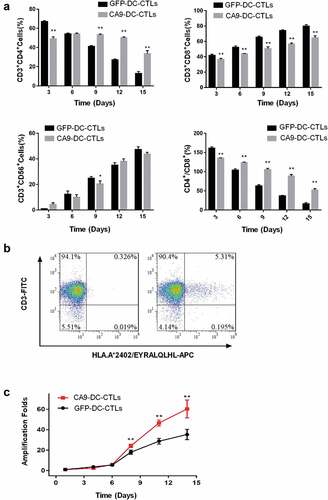
The proliferation of CA9-DC-CTL cells and GFP-DC-CTL cells was also evaluated every 3 d. Compared to the control group, the CA9-DC-CTL cells possessed a higher proliferative potential. As shown in , the number of CA9-DC-CTL cells was increased by 60.36 ± 7.16% vs. 35.38 ± 4.14% in the GFP-DC-CTL cells analyzed by a Student’s t-test on day 14. As shown above, the phenotype of CA9-DC cells is more mature than that of GFP-DC cells, which is mainly manifested in higher maturity of CD11c and increased expression of CD80 co-stimulation molecules. These suggest that compare to GFP-DC, CA9-DC is more capable of transmitting signals to stimulate the proliferation and differentiation of CTL, making that the proliferation rate of CA9-DC-CTL is significantly higher than that of GFP-DC-CTL.
DCs infected with adenovirus Ad-siSC-CA9-IRES-F and the Ad-GFP control were co-cultured with T-cells and the specificity of the CTL cells to CA9 was analyzed using A*2402/EYRALQLHL-APC, a dextramer of the EYRALQLHL peptide-specific MHC.Citation17 The results are shown in . The percentage of HLA.A*2402/EYRALQLHL dextramer-specific cells in the CA9-DC-CTL cells after infection was maintained at 4.90 ± 0.79%. EYRALQLHL peptide is CA9 protein-specific polypeptide. CTL cells present CA9 protein peptide segment to the cell surface, the positive staining of the MHC-EYRALQLHL complex indicates that CA9-DC induced CTL cells have the ability to specifically recognize CA9 protein.
Tumor cytotoxicity in vitro
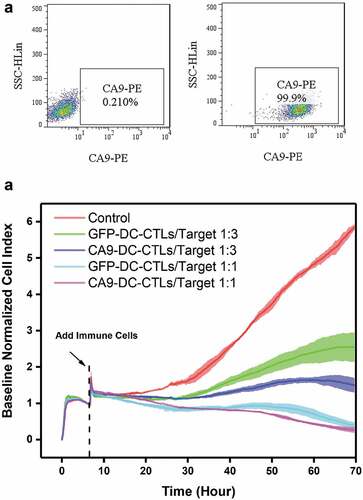
The resistance value of the adherent cells was recorded by RTCA and is presented as the number of cells. Lentiviruses that express CA9 were constructed and used to infect 293 FT cells (). CA9-293 FT cells were used at target cell ratios of 1:3 and 1:1 (effective cells to target cells, E:T). The results showed that both the CA9-DC-CTL and GFP-DC-CTL groups exhibited cytotoxicity to CA9-293 FT cells from day 10 to day 12 and the cytotoxicity increased with the increasing effective target ratio (). Compared to the GFP-DC-CTL group, the CA9-DC-CTL group showed stronger anti-tumor activity (74.55 ± 3.30% vs. 56.59 ± 6.75%, p = .0012). The data was analyzed by a one-way ANOVA followed by Tukey’s multiple comparisons test among control, GFP-DC-CTL group and CA9-DC-CTL group in each E:T ratio at 70 h.
Figure 4. In vitro detection of the killing capacity of CTLs to HEK293-CA9 cells by RTCA after 3 d of co-culturing CTLs with DCs. A. HEK293 cells were infected with CA9 Lentiviruses, the expression of CA9 were detected by flow cytometry. Left: negative control; Right: HEK293-CA9 cells which express CA9 protein after infection. B. HEK293-CA9 cells were inoculated into the RTCA plate. After 7–8 hculture, the cells were spread out on the plate. GFP-DC-CTLs and CA9-DC-CTLs were then added according to the E:T ratio of 1:3 or 1:1, respectively, followed by 60 h observation. At E:T = 1:1, there was no significant difference in the killing effect between GFP-DC-CTLs and CA9-DC-CTLs on HEK293-CA9 cells, while at E:T = 3:1, the killing effect of CA9-DC-CTLs on HEK293-CA9 cells is significantly higher than GFP-DC-CTLs. The data was analyzed by a one-way ANOVA followed by Tukey’s multiple comparisons test.
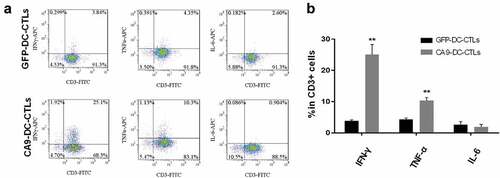
The expression of intracellular immune cell cytokines was detected in the mixed target cell cultures. As shown in , the CA9-DC-CTL cells secreted more IFN-γ (p = .002, n = 4) and TNF-α (p = .005, n = 4) when specifically killing target cells, which is associated with a higher killing activity. However, there was no significant difference in the secretion of the inflammatory factor IL-6 (p = .082, n = 4). The data was analyzed by a Student’s t-test between GFP-DC-CTL group and CA9-DC-CTL group. We found that compare to GFP-DC-CTL, CA9-DC-CTL has a higher cytotoxicity to target cells. We also found that the release amount of IFN-γ and TNF-α is increased significantly, which may be one of the reasons for the higher cytotoxicity of CA9-DC-CTL.
Figure 5. Proportion of IFN-γ-secreting and TNF-α-secreting cells in GFP-DC-CTLs and CA9-DC-CTLs. A. Compare to GFP-DC-CTLs, the proportion of IFN-γ-secreting and TNF-α-secreting cells in CA9-DC-CTLs is significantly increased, while the proportion of IL-6-secreting cells was not changed significantly. B. Statistical analysis of the proportion of cells secreting IFN-γ, TNF-α and IL-6 in CD3+ cells. The proportion of IFN-γ-secreting and TNF-α-secreting cells is significantly increased in CA9-DC-CTL group compared with that in GFP-DC-CTL group. *p < .05, **p < .01. The bars indicate standard deviation (SD). The P value indicate the difference of the comparisons between GFP-DC-CTL group and CA9 -DC-CTL group analyzed by a Student’s t-test.
Tumor cytotoxicity in vivo
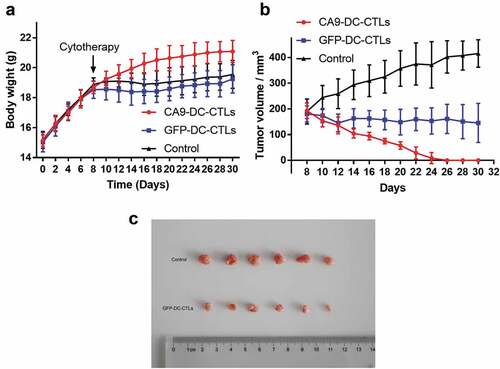
All nude mice were raised well until day 30 without death. At day 30, the nude mice were euthanized by excess CO2, and blood-letting was performed for confirmation. The tumors were then dissected and photographed for recording. As shown in , tumor inoculation was performed on day one, adoptive cellular immunotherapy was delivered on day 8. The body weight of the mice in the control and CTL groups was slightly increased and these 12 mice displayed signs of distress, such as poor appetite, weight loss, and back arching, whereas the six mice in the CA9-DC-CTL group showed the most obvious weight gain and good appetite. On the eighth day after the subcutaneous transplantation of 786-o cells, the mice were treated with or without immune cells. The tumor volume increased significantly at the endpoint of the experiment in the control group and was slightly decreased in the GFP-DC-CTL group. At day 30, the tumor volume was analyzed using a one-way ANOVA followed by Tukey’s multiple comparisons test among three groups. Significant differences were found between control group and GFP-DC-CTL group (p = .003) and between GFP-DC-CTL group and CA9-DC-CTL group (p = .007). The CA9-DC-CTL cells exhibited strong anti-tumor effects and the xenografted tumor disappeared 2–3 weeks after the mice received immune cell therapy (). These indicate that CA9-DC-CTL has higher cytotoxicity than GFP-DC-CTL to human kidney cancer cell line 786-o in vivo, which provide evidence for subsequent clinical applications.
Figure 6. In vivo detection of tumor cytotoxicity. A. Weight gain in mice from day 0 to day 30 after transplant with 786-O cells. Cytotherapy was performed at day 8. B. Tumor volume growth in mice after cytotherapy (at day 8) to day 30. C. Photographic recording of tumors at day 30. The data was analyzed by a one-way ANOVA followed by Tukey’s multiple comparisons test.
Discussion
The occurrence and development of RCC are related not only to the nature of the tumorigenic event and gene expression but also to defects in the immune function in the patients. Due to insufficient numbers of DCs in the tumor-bearing hosts, tumor antigens cannot be presented effectively. Cytokines, such as VEGF, IL-10, TGF-β, and PGE2, secreted by tumor cells allow the DCs to remain in the naive stage or to differentiate into other endothelial cells.Citation18 These cytokines, which also cause the low expression of MHC class II molecules and certain costimulatory molecules, results in loss or severe decrease in the ability of the DCs to present antigens and activate T-cells. Using genetic engineering technology to modify the DCs may solve the above problems.
In this study, we used adenovirus as a genetic tool to enhance the antigen-presenting ability of the DCs. Our results showed that the CA9-DC-CTL cells possessed higher tumor specificity, proliferation capacity, and cytotoxicity effects than the GFP-DC-CTL cells. These results may be attributed to the adenovirus we constructed. Flagellin is a ligand of TLR5 and induces the maturation and the chemokines production of human DCS via its interaction with TLR5. Immunization with purified, soluble flagellin protein is recognized primarily by Toll-like receptor 5 (TLR5) and can induce profound responses in innate and adaptive immune cells.Citation19 Additionally, the immunization of mice with S-Flagellin has been shown to enhance the protective ability of mice to against viral infectionsCitation20 and radiation exposure,Citation21 and promote antigen presentation through MHC-II.Citation22 As a negative feedback factor for immune regulation, the silencing of SOCS1 may affect the phenotype and the function of the DCs from multiple signaling pathways, such as the JAK-STAT or TLR pathways. Compared to the traditional method, SOCS1-silenced DCs were reported to fully activate human CTL cells that possessed robust cytotoxicity against natural antigen-expressing tumor cells.Citation23 This indicates that siRNA-SOCS1 can promote the maturity of DCs and thus, improve the antigen presentation function of DCs.Citation24 The expression of carbonic anhydrase IX (CA9) is not found in most tissues but is specifically found in RCC.Citation12 Here, CA9 was used as a tumor marker and expressed in DCs. Once CA9 is expressed, it is captured and processed by lysosomes, the antigen peptide is then assembled with MHC-I, transferred to the surface of the DCs, and finally presented to CD8+ T-helper cells. That may be the reason why the CA9-DC-CTL cells exhibited specificity to CA9.
Adenovirus infection not only enhances the antigen presentation of DCs, but also indirectly changes some of the biological characteristics of CTL cells after DCs are co-cultured with T-cells. CA9-DC-CTL cells exhibited a higher CD4+/CD8+ ratio, indicating an improved immunity in vitro. Additionally, the modified DCs may activate T-cells and increase their proliferative capacity. The improved cytotoxicity of CA9-DC-CTL cells to 293 FT cells expressing CA9 in vitro was demonstrated by RTCA and may be attributed to the increased IFN-γ and TNF-α. These results were consistent with the activation of acquired immunity evaluated by IFN-γ secretion from CD8 + T cell. The levels of IFN-γ in sera of DC-treated mice were significantly higher than those of untreated mice.Citation25 It remains unclear whether the DC transmits the signal to the CTL via MHC I or MHC II molecules. We did not analyze the expression of MHC class I and MHC class II for DC maturation, which may be the cause of the increase in the proportion of CD4+ cells in T-cells and IFN-γ secretion.
Zitvogel et al. reported that in vivo the anti-tumor effects of peptide-pulsed DC vaccination were dependent on T cells, CD80 costimulation, and T helper cell 1-associated cytokines such as IFN-γ and tumor necrosis factor- α.Citation26 The results of our experiments in vitro are consistent with Zitvogel et al. . In our study, the phenotype and proliferation ability of T-cells were significantly optimized. After being induced by Ad-siSC-CA9-IRES-F adenoviruses, the maturity and CD80 ratio of DC cells increased significantly. The amount of IFN-γ and TNF-α secreted by CA9-DC-CTL cells increased significantly. These are factors that improve the cytotoxicity of lymphocytic T-cells to tumors. The improved cytotoxicity of CA9-DC-CTL cells to 293 FT cells expressing CA9 in vitro was demonstrated by RTCA.
To verify whether CA9-DC-CTL has higher cytotoxicity than GFP-DC-CTL, we evaluated the anti-tumor effect of CA9-DC-CTL cells in tumor-bearing nude mice in vivo. A steady increase in the body weight of the mice in the CA9-DC-CTL treatment group indicated the health condition of these mice. The body weight of mice is affected by many factors, including appetite, defecation, and mental state. As the results showed, CA9-DC-CTL treatment not only improved the quality of life in the mice compared to the untreated mice but also destroyed the 786-o xenograft within 2–3 weeks. No obvious toxic side effects were observed throughout the trial.
CA9 protein is highly expressed in RCC, but not in normal tissues, which becomes a specific target of RCC and provides a new idea for targeted immunotherapy. CA9-loaded CA9-DC-CTL immunotherapy was highly effective against CA9-293 FT and 786-o cells which may provide a novel treatment option for RCC. Immunotherapy targeting CA9 protein improves the specificity of normal CIK cell therapy against RCC. Compared to cytokine therapy with agents such as IL-2 and interferon, CA9-loaded CA9-DC-CTL immunotherapy cause less damage to other tissues. While further studies on its safety are needed for clinical evaluation.
Abbreviations
| DCs | = | dendritic cells |
| CA9 | = | carbonic anhydrase IX |
| RCC | = | renal cell carcinoma |
| iAPA | = | inhibition of antigen presentation attenuators |
| CTLs | = | cytotoxic T-lymphocytes |
| CIK | = | cytokineinduced killer |
| PFS | = | progression-free survival |
| OS | = | overall survival |
| SOCS1 | = | Suppressor Of Cytokine Signaling 1 |
| MOI | = | multiplicity of infection. |
Authors’ contributions
Yi Tan conceived and designed this study. Heran Ma analyzed the data, collected and collated references, and wrote and supervised the manuscript. Jianhui Zhang performed the main experiments, and made all figures in the manuscript. Dingke Wen and NaQu was involved in animal experiments. Qunfang Kong was involved in cell culture experiments. Kun Li and Suxia Ma participated in the experiments. All authors approved the final manuscript.
Disclosure of potential conflicts of interest
No potential conflicts of interest were disclosed.
Statement of Ethics
The use of experimental animals in this project conforms to the “3R” principle of animal experiment ethics, and the research unit has the relevant qualifications. The experimental design has been conformed to the Ethical Principle And Requirements of animal experiments. The Committee of Institute of Pharmacy Shandong Academy of Medical Sciences agreed that the project leader would conduct the research on the project.
Supplemental Material
Download TIFF Image (260.2 KB)Acknowledgments
We are grateful for support from the Collaborative Innovation Center of Technology and Equipment for Biological Diagnosis and Therapy at the Universities of Shandong.
Availability of data and materials
The datasets used and/or analyzed during the current study are available from the corresponding author on reasonable request.
Supplementary material
Supplemental data for this article can be accessed on the publisher’s website at https://doi.org/10.1080/21645515.2021.1955610
Additional information
Funding
References
- Liou LS, Shi T, Duan ZH, Sadhukhan P, Der SD, Novick AA, Hissong J, Skacel M, Almasan A, DiDonato JA, et al. Microarray gene expression profiling and analysis in renal cell carcinoma. BMC Urol. 2004;22(4):9. doi:10.1186/1471-2490-4-9.
- Janzen NK, Kim HL, Figlin RA, Belldegrun AS. Surveillance after radical or partial nephrectomy for localized renal cell carcinoma and management of recurrent disease. Urol Clin North Am. 2003;30(4):843–52. doi:10.1016/S0094-0143(03)00056-9.
- Cohen HT, McGovern FJ. Renal-Cell Carcinoma. N Eng J Wed. 2005;353(23):2477–90. doi:10.1056/NEJMra043172.
- Abel EJ, Wood CG. Cytoreductive nephrectomy for metastatic RCC in the era of targeted therapy. Nat Rev Urol. 2009;6(7):375–83. doi:10.1038/nrurol.2009.102.
- Negrier S, Escudier B, Lasset C, Douillard JY, Savary J, Chevreau C, Ravaud A, Mercatello A, Peny J, Mousseau M, et al. Recombinant human interleukin-2, recombinant human interferon alfa-2a, or both in metastatic renal-cell carcinoma. Groupe Français d’Immunothérapie. N Engl J Med 1998 30;338(18):1272–78. doi:10.1056/NEJM199804303381805.
- Liu L, Zhang W, Qi X, Li H, Yu J, Wei S, Hao X, Ren X. Randomized study of autologous cytokine-induced killer cell immunotherapy in metastatic renal carcinoma. Clin Cancer Res. 2012;18:1751. doi:10.1158/1078-0432.CCR-11-2442.
- Evel-Kabler K, Chen SY. Inhibition of antigen-presentation attenuators to augment vaccines. Curr Opin Mol Ther. 2006;8:24–30.
- Shen L, Evel-Kabler K, Strube R, Chen SY. Silencing of SOCS1 enhances antigen presentation by dendritic cells and antigen-specific anti-tumor immunity. Nat Biotechnol. 2004;22(12):1546–53. doi:10.1038/nbt1035.
- Yuan Y, Wang XF, Zhang Y, Wang JY, Luan N, Surgery N. Research of SOCS1 silent DC vaccine on laryngocarcinoma therapy. Lin Chung Er Bi Yan Hou Tou Jing Wai Ke Za Zhi. 2012;26:169–73.
- Murakami Y, Kanda K, Tsuji M, Kanayama H, Kagawa S. MN/CA9 gene expression as a potential biomarker in renal cell carcinoma. BJU Int. 1999;83(7):743–47. doi:10.1046/j.1464-410x.1999.00007.x.
- Bui MHT, Seligson D, Han K, Pantuck AJ, Dorey FJ, Huang Y, Horvath S, Leibovich BC, Chopra S, Liao SY, et al. Carbonic anhydrase IX is an independent predictor of survival in advanced renal clear cell carcinoma: implications for prognosis and therapy. Clin Cancer Res. 2003;9:802–11.
- Duivenvoorden WC, Hopmans SN, Gallino D, Farrell T, Gerdes C, Glennie D, Lukka H, Pinthus JH. Inhibition of carbonic anhydrase IX (CA9) sensitizes renal cell carcinoma to ionizing radiation. Oncol Rep. 2015;34:1968–76. doi:10.3892/or.2015.4184.
- Lucarini L, Magnelli L, Schiavone N, Crisci A, Innocenti A, Puccetti L, Cianchi F, Peri S, Supuran CT, Papucci L, et al. Plasmatic carbonic anhydrase IX as a diagnostic marker for clear cell renal cell carcinoma. J Enzyme Inhib Med Chem. 2018 Dec;33(1):234–40. doi:10.1080/14756366.2017.1411350.
- Zitzmann K, Brand S, De Toni EN, Baehs S, Göke B, Meinecke J, Spöttl G, Meyer HH, Auernhammer CJ. SOCS1 silencing enhances antitumor activity of type I IFNs by regulating apoptosis in neuroendocrine tumor cells. Cancer Res. 2007;67(10):5025–32. doi:10.1158/0008-5472.CAN-06-2575.
- Rammah M, Dandachi F, Salman R, Shihadeh A, El-Sabban M. In vitro cytotoxicity and mutagenicity of mainstream waterpipe smoke and its functional consequences on alveolar type II derived cells. Toxicol Lett. 2012;211:220–31. doi:10.1016/j.toxlet.2012.04.003.
- Naito S, von Eschenbach AC, Giavazzi R, Fidler IJ. Growth and metastasis of tumor cells isolated from a human renal cell carcinoma implanted into different organs of nude mice. Cancer Res. 1986;46:4109.
- Uemura H, Fujimoto K, Tanaka M, Yoshikawa M, Hirao Y, Uejima S, Yoshikawa K, Itoh K. A phase I trial of vaccination of CA9-derived peptides for HLA-A24-positive patients with cytokine-refractory metastatic renal cell carcinoma. Clin Cancer Res 2006 15;12(6):1768–75. doi:10.1158/1078-0432.CCR-05-2253.
- George DJ, Kaelin WG Jr. The von Hippel-Lindau protein, vascular endothelial growth factor, and kidney cancer. N Engl J Med 2003 31;349(5):419–21. doi:10.1056/NEJMp030061.
- Floreslangarica A, Müller KL, Persson EK, Cook CN, Bobat S, Marshall JL, Dahlgren MW, Hägerbrand K, Toellner KM, Goodall MD. CD103+CD11b+ mucosal classical dendritic cells initiate long-term switched antibody responses to flagellin. Mucosal Immunol. 2018;11(3):681–92. doi:10.1038/mi.2017.105.
- Zhang B, Chassaing B, Shi Z, Uchiyama R, Zhang Z, Denning TL, Crawford SE, Pruijssers AJ, Iskarpatyoti JA, Estes MK. Viral infection. Prevention and cure of rotavirus infection via TLR5/NLRC4-mediated production of IL-22 and IL-18. Science. 2014;346:861–65. doi:10.1126/science.1256999.
- Burdelya LG, Krivokrysenko VI, Tallant TC, Strom E, Gleiberman AS, Gupta D, Kurnasov OV, Fort FL, Osterman AL, Didonato JA. An agonist of toll-like receptor 5 has radioprotective activity in mouse and primate models. Science. 2008;320:226–30. doi:10.1126/science.1154986.
- Letran SE, Lee SJ, Shaikh A, Uematsu S, Akira S, Mcsorley SJI. TLR5 functions as an endocytic receptor to enhance flagellin-specific adaptive immunity. Eur J Immunol. 2011;41:29–38. doi:10.1002/eji.201040717.
- Hong B, Ren W, Song XT, Evel-Kabler K, Chen SY and Huang XF. Human SOCS1 controls immunostimulatory activity of monocyte-derived dendritic cells. Cancer Res. 2009;69:8076. doi:10.1158/0008-5472.CAN-09-1507.
- Evel-Kabler K, Song XT, Aldrich M, Huang XF, Chen SY. SOCS1 restricts dendritic cells’ ability to break self-tolerance and induce antitumor immunity by regulating IL-12 production and signaling. J Clin Invest. 2005;116(1):90–100. doi:10.1172/JCI26169.
- Tatsumi T1, Takehara T, Yamaguchi S, Sasakawa A, Sakamori R, Ohkawa K, Kohga K, Uemura A, Hayashi N. Intrahepatic delivery of alpha-galactosylceramide-pulsed dendritic cells suppresses liver tumor. Hepatology. 2007 Jan;45(1):22–30. doi:10.1002/hep.21447.
- Zitvogel L, Mayordomo JI, Tjandrawan T, DeLeo AB, Clarke MR, Lotze MT, Storkus WJ. Therapy of murine tumors with tumor peptide-pulsed dendritic cells: dependence on T cells, B7 costimulation, and T helper cell 1-associated cytokines. J Exp Med. 1996;183:87–97. doi:10.1084/jem.183.1.87.